
Disrupting the Borg is expensive and time consuming!

Google Search
-
Recent Posts
- The Real Hockey Stick Graph
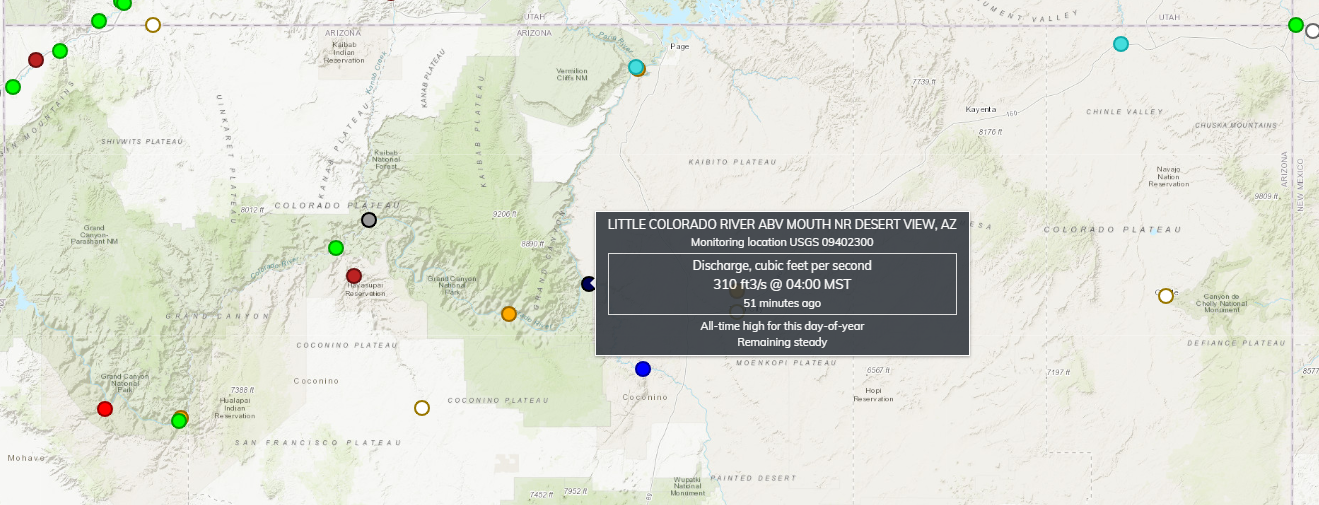
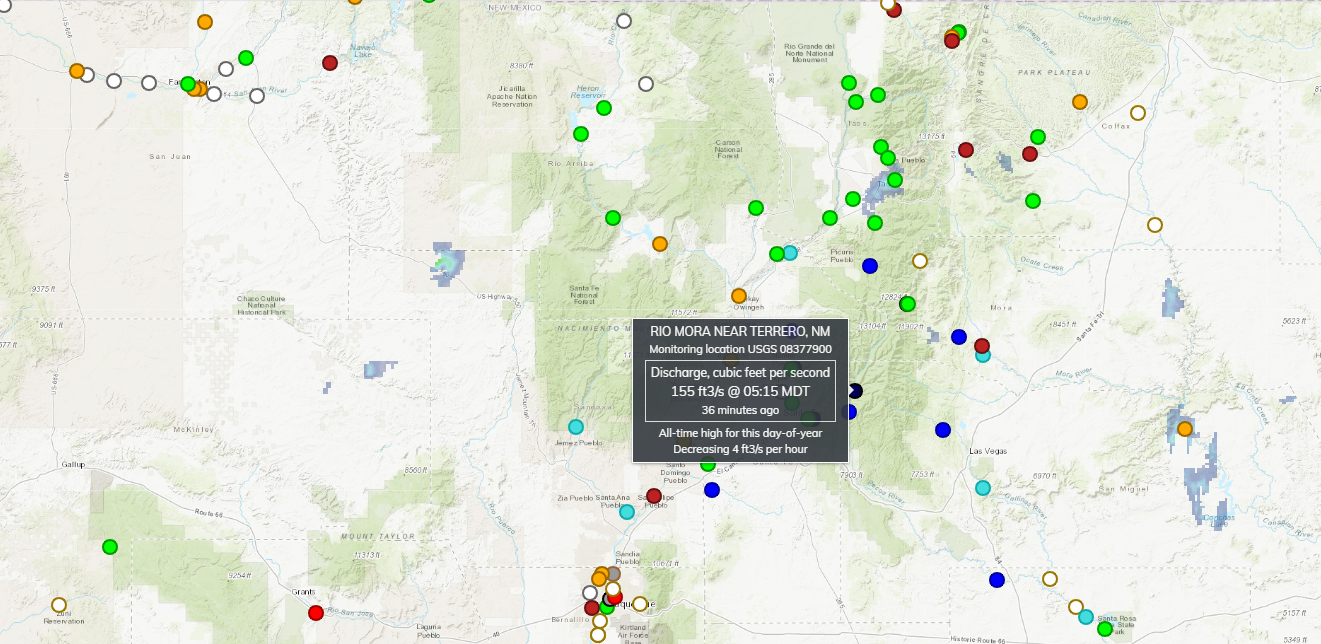
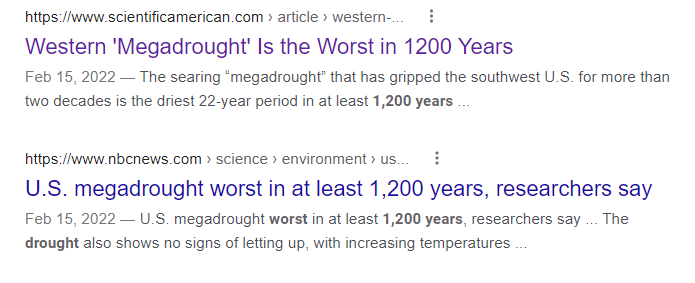
- Analyzing The Western Water Crisis
- Gaslighting 1924
- “Why Do You Resist?”
- Climate Attribution Model
- Fact Checking NASA
- Fact Checking Grok
- Fact Checking The New York Times
- New Visitech Features
- Ice-Free Arctic By 2014
- Debt-Free US Treasury Forecast
- Analyzing Big City Crime (Part 2)
- Analyzing Big City Crime
- UK Migration Caused By Global Warming
- Climate Attribution In Greece
- “Brown: ’50 days to save world'”
- The Catastrophic Influence of Bovine Methane Emissions on Extraterrestrial Climate Patterns
- Posting On X
- Seventeen Years Of Fun
- The Importance Of Good Tools
- Temperature Shifts At Blue Hill, MA
- CO2²
- Time Of Observation Bias
- Climate Scamming For Profit
- Climate Scamming For Profit
April 2026 M T W T F S S 1 2 3 4 5 6 7 8 9 10 11 12 13 14 15 16 17 18 19 20 21 22 23 24 25 26 27 28 29 30 Recent Comments
- arn on The Real Hockey Stick Graph
- Bob G on The Real Hockey Stick Graph
- Bob G on The Real Hockey Stick Graph
- Gordon Vigurs on The Real Hockey Stick Graph
- arn on The Real Hockey Stick Graph
- arn on The Real Hockey Stick Graph
- Gordon Vigurs on The Real Hockey Stick Graph
- Peter Carroll on The Real Hockey Stick Graph
- Robertvd on The Real Hockey Stick Graph
- Robertvd on The Real Hockey Stick Graph
150 Years Of Useless Journalists
“I am personally acquainted with hundreds of journalists, and the opinion of the majority of them would not be worth tuppence in private, but when they speak in print it is the newspaper that is talking (the pygmy scribe is not visible) and then their utterances shake the community like the thunders of prophecy.”Mark Twain March 31, 1873
Posted in Uncategorized
Leave a comment
Biden – Truth Over Lies

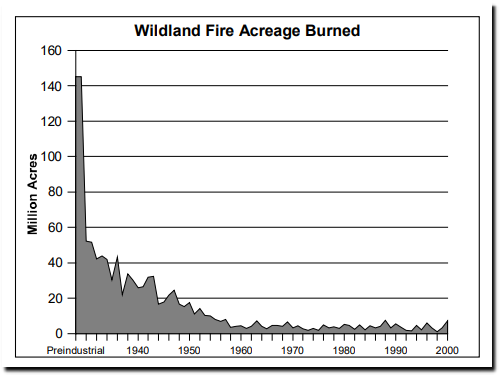
The US Forest Service shows that burn acreage in the US was much higher prior to 1960.
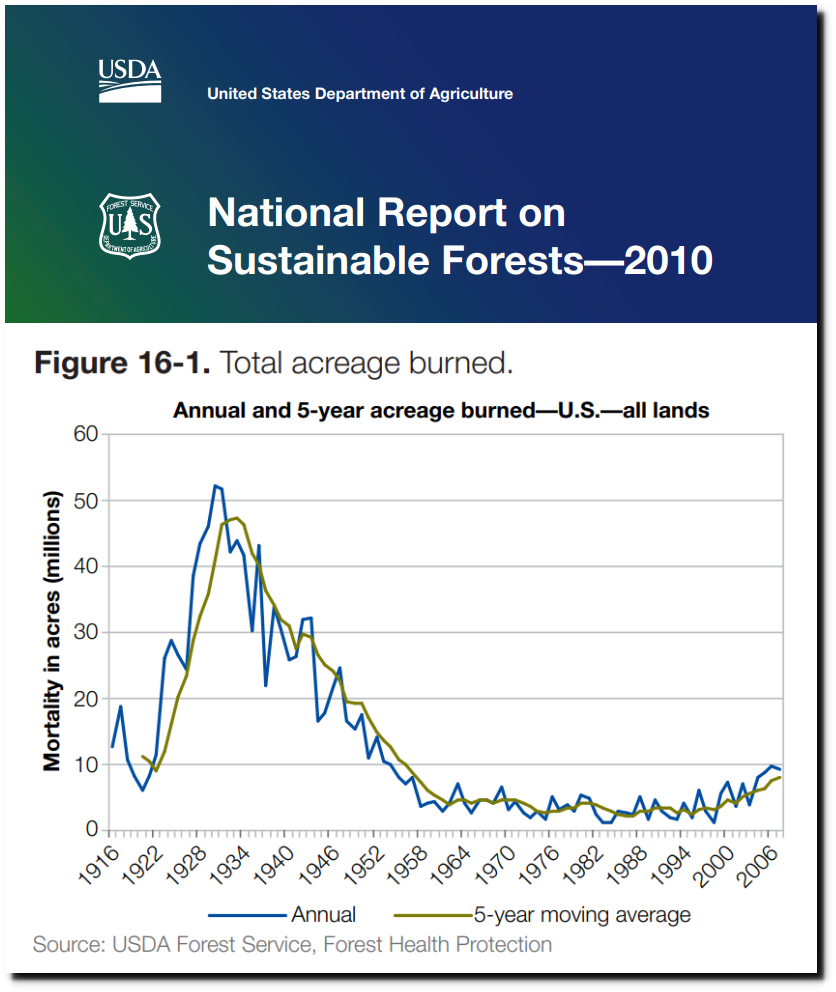
2010-sustainability-report.pdf
The data was kept in great detail, as reported by the New York Times in 1938.
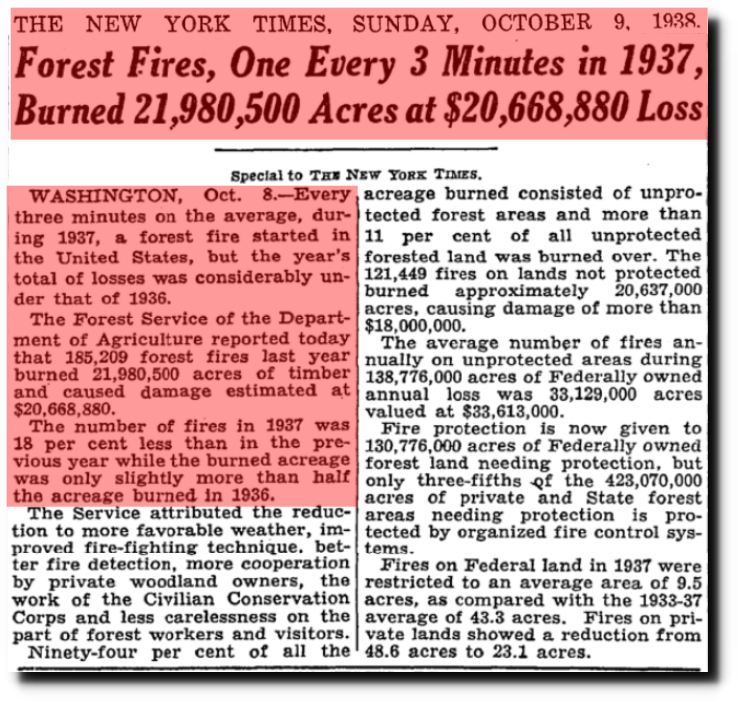
TimesMachine: October 9, 1938 – NYTimes.com
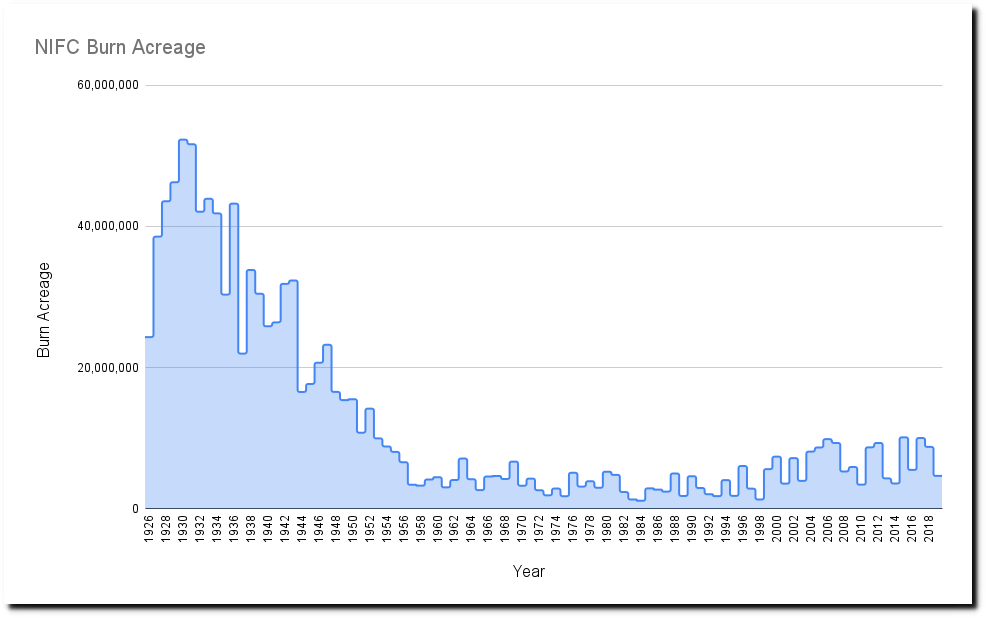
As of January 29, 2021 the National Interagency Fire Center showed the same data through 2019.
It came with this disclaimer, which apparently was referring to a discrepancy in the way the number of fires was counted prior to 1983.
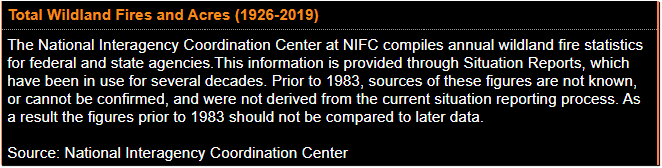
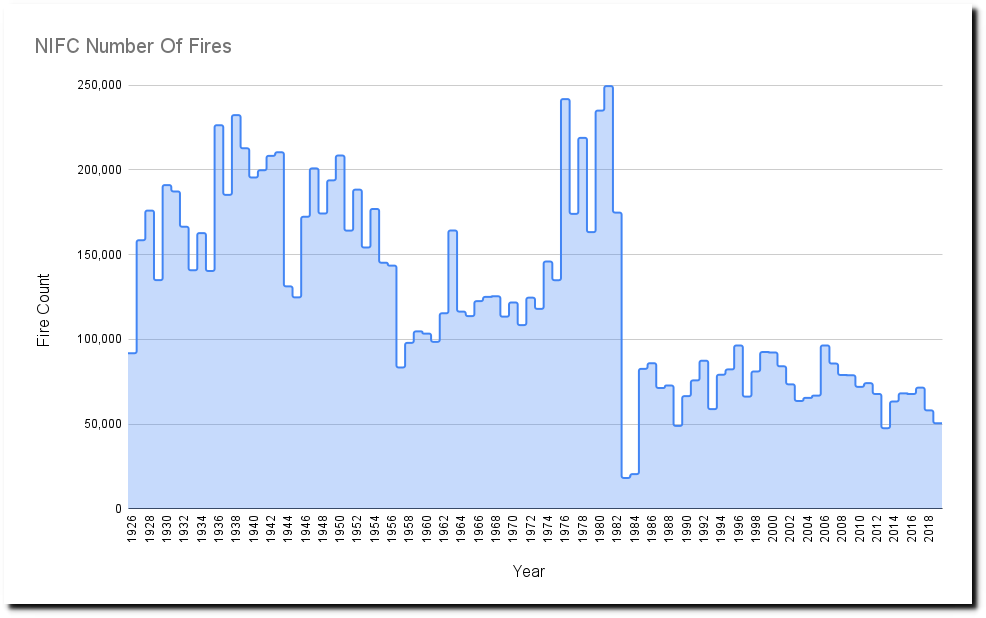
National Interagency Fire Center
But by February 27, 2021 the page had disappeared.

Page not found | National Interagency Fire Center
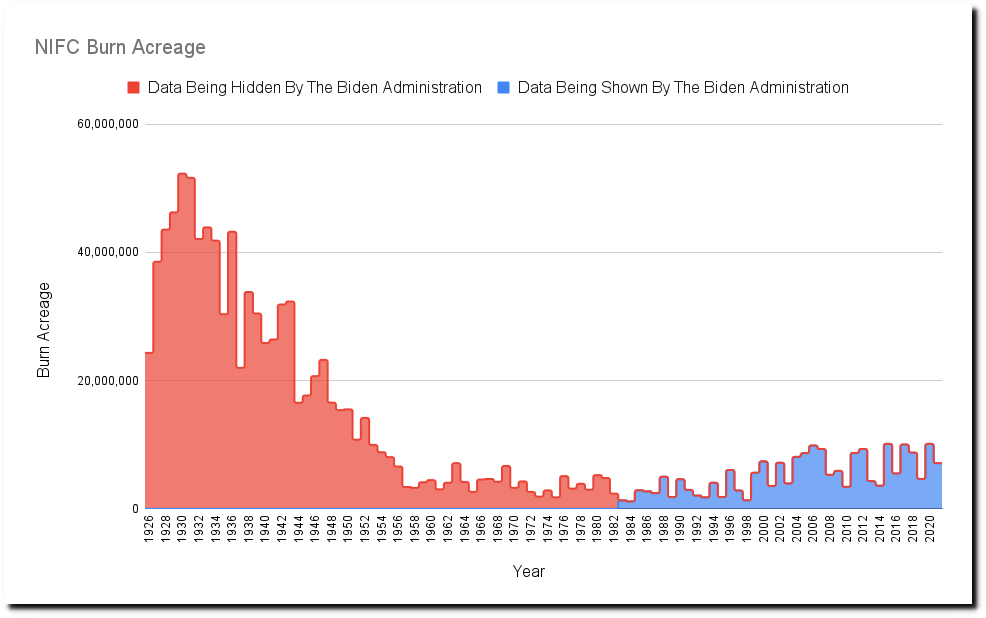
Now if you go to that website it redirects to another page which hides the data prior to 1983.
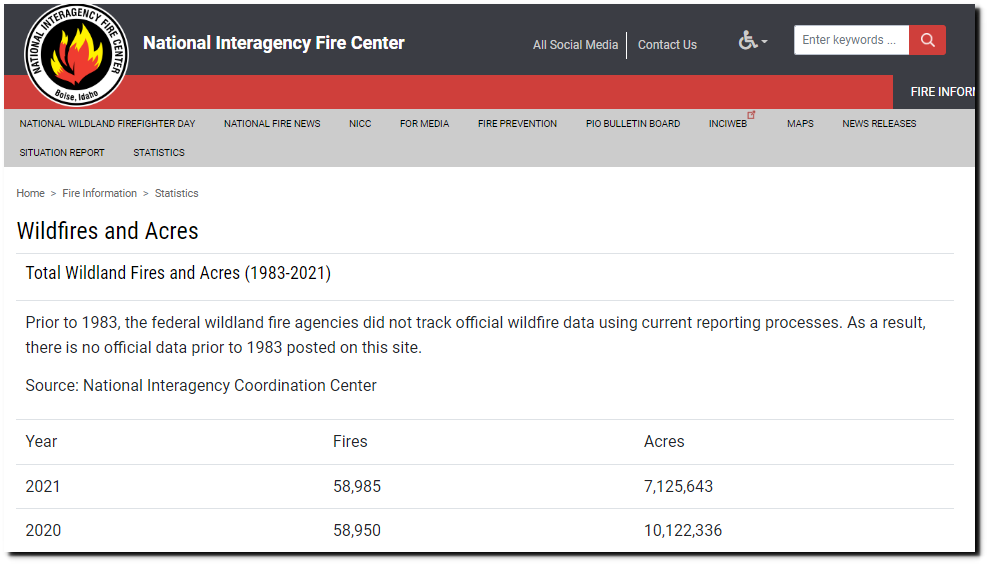
Wildfires and Acres | National Interagency Fire Center
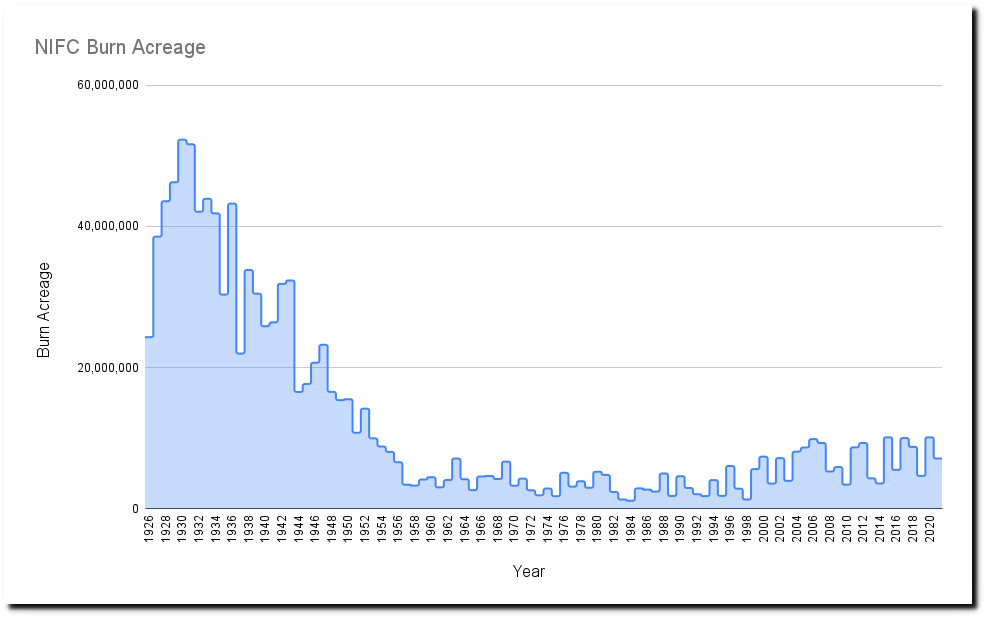
This graph shows the complete data set updated through 2021.
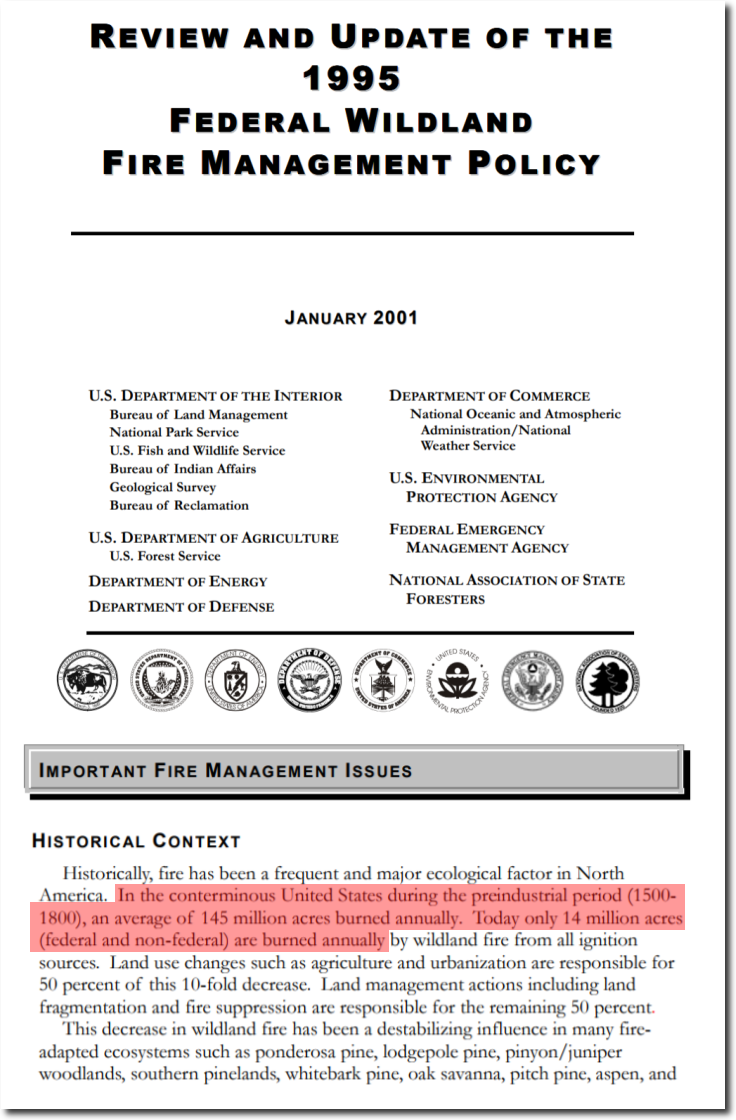
On November 1, 2020 this twenty year old document was on the National Interagency Fire Center website. That was right before the pretend election.
“Historically, fire has been a frequent and major ecological factor in North America. In the conterminous United States during the preindustrial period (1500- 1800), an average of 145 million acres burned annually. Today only 14 million acres (federal and non-federal) are burned annually by wildland fire from all ignition sources.”
The next time it was captured by the Internet Archive was April 25, 2021 and looked like this :

Page not found | National Interagency Fire Center
Now it looks like this :
“The National Interagency Fire Center is committed to making its information and communication technologies accessible to individuals with disabilities”

Posted in Uncategorized
Leave a comment
Imaginary Connections
The press has been working hard to create the perception of a link between fossil fuels, heatwaves and extreme weather. This superstition is not based on historical evidence or science – and has been spread through decades of propaganda, misinformation and censorship.
Posted in Uncategorized
Leave a comment
Climate Comedy From The Press
If you view climate journalism and policy as a dark comedy, it is actually pretty funny.
Posted in Uncategorized
Leave a comment
Imaginary Connections
“Even before summer began, there were extreme heat waves and new heat records throughout the Northern Hemisphere, and the forecast calls for a hotter-than-normal summer in much of the U.S. Scientists say climate change is accelerating and intensifying these kinds of heat waves. It’s taken a while for some TV weather men and women to make these connections
India and Pakistan endured blistering conditions this spring, leading to a loss of life. And the forecast calls for a hotter-than-normal summer in much of the U.S.”
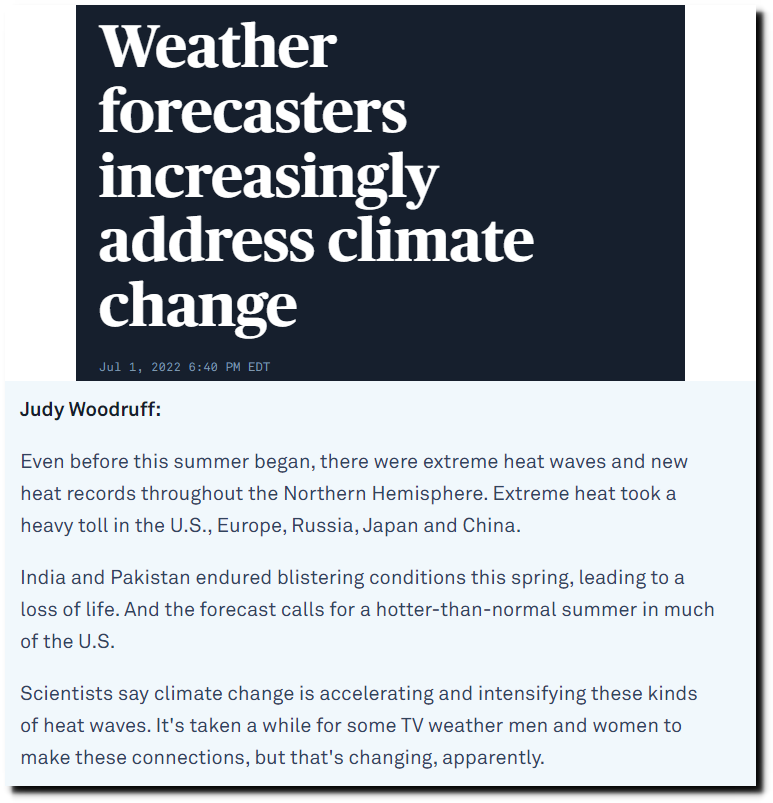
Weather forecasters increasingly address climate change | PBS NewsHour
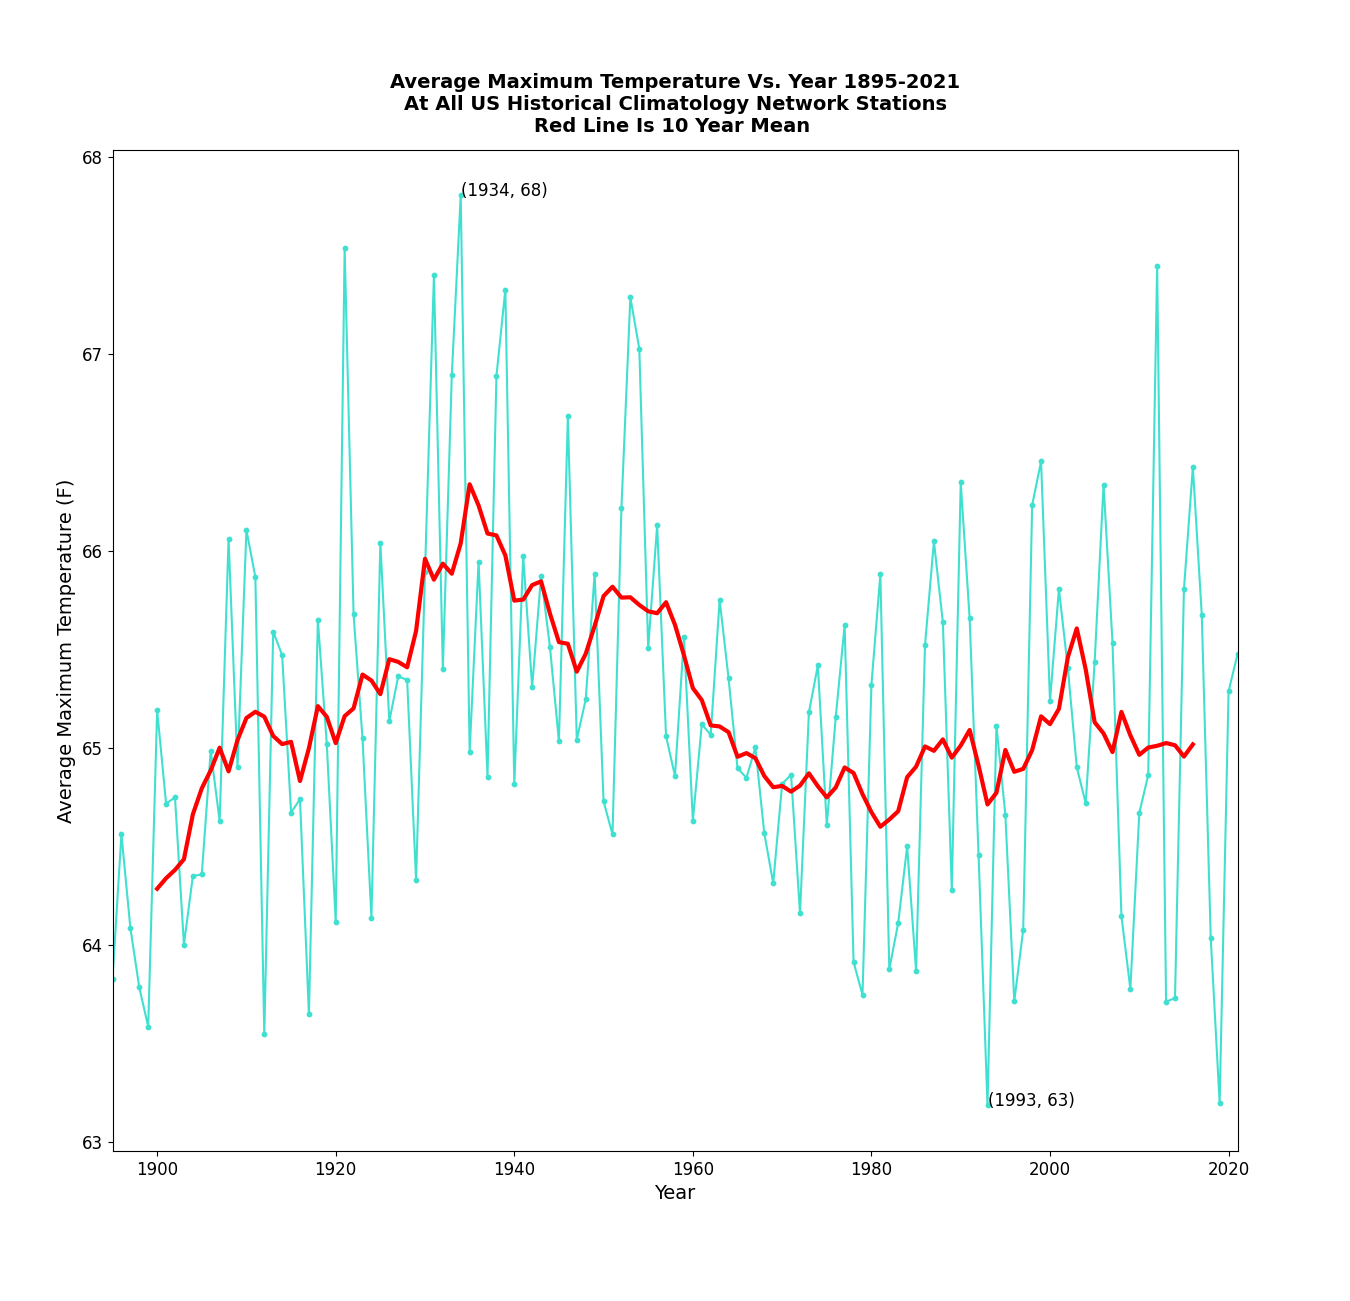
The US is having one of the coolest years on record.
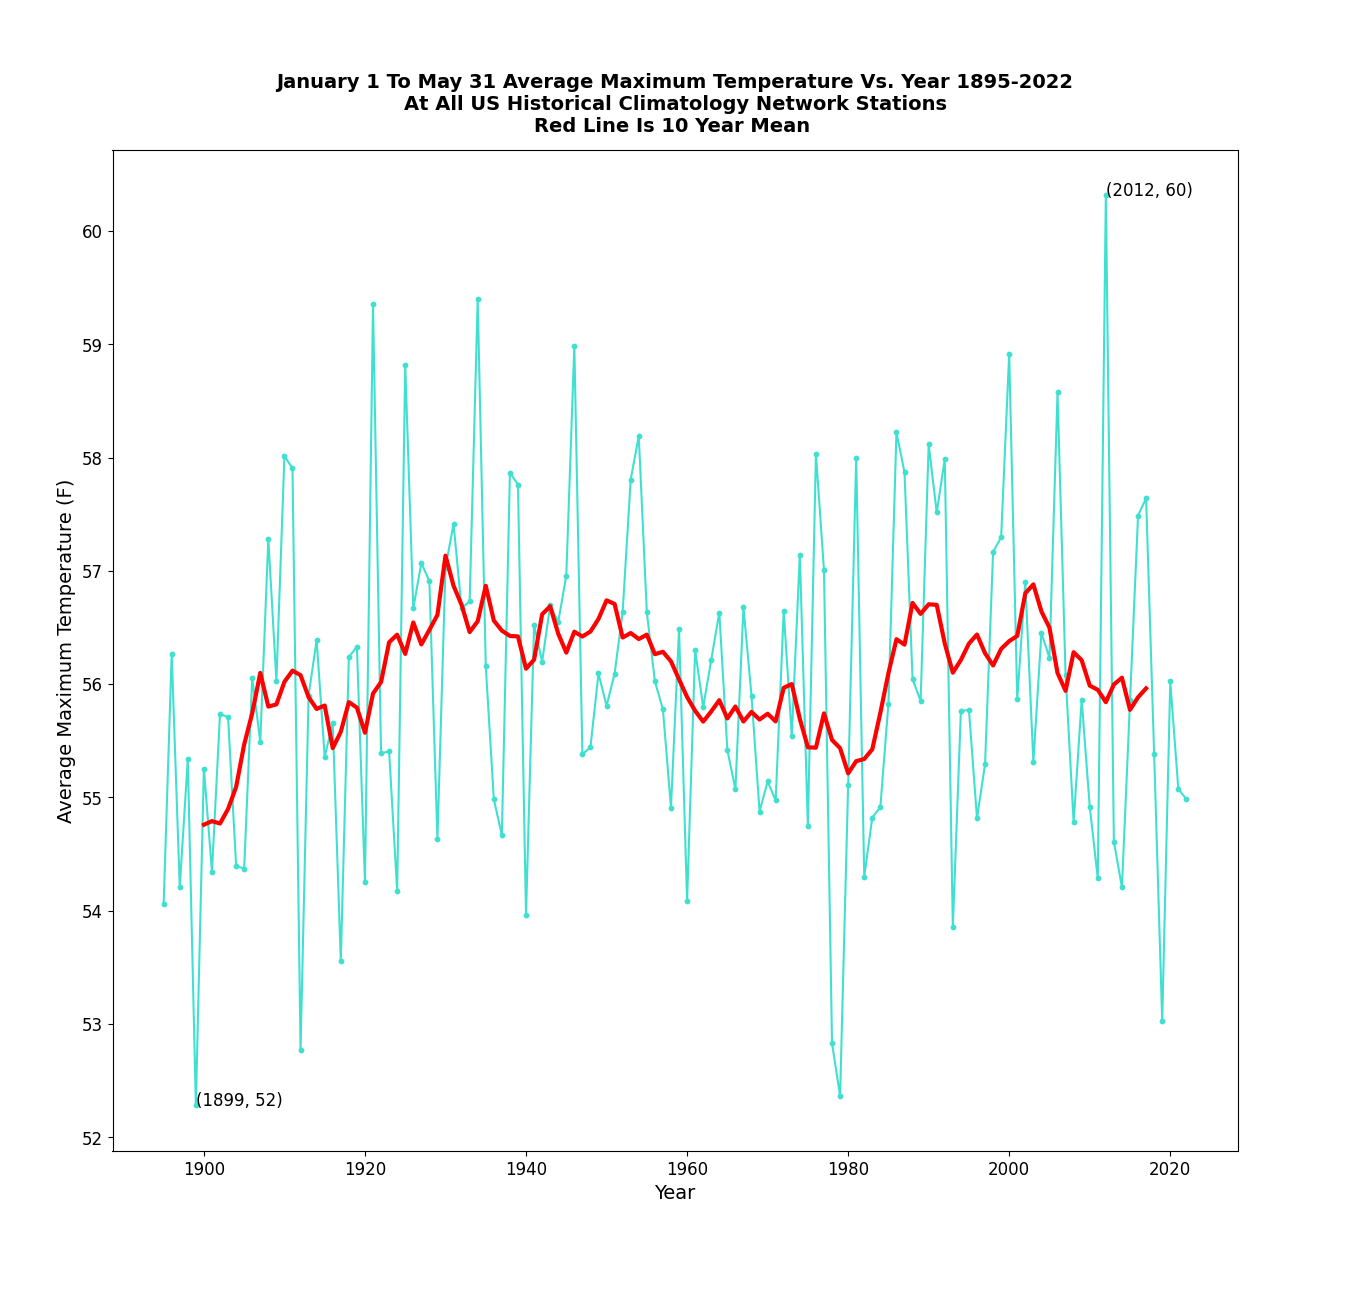
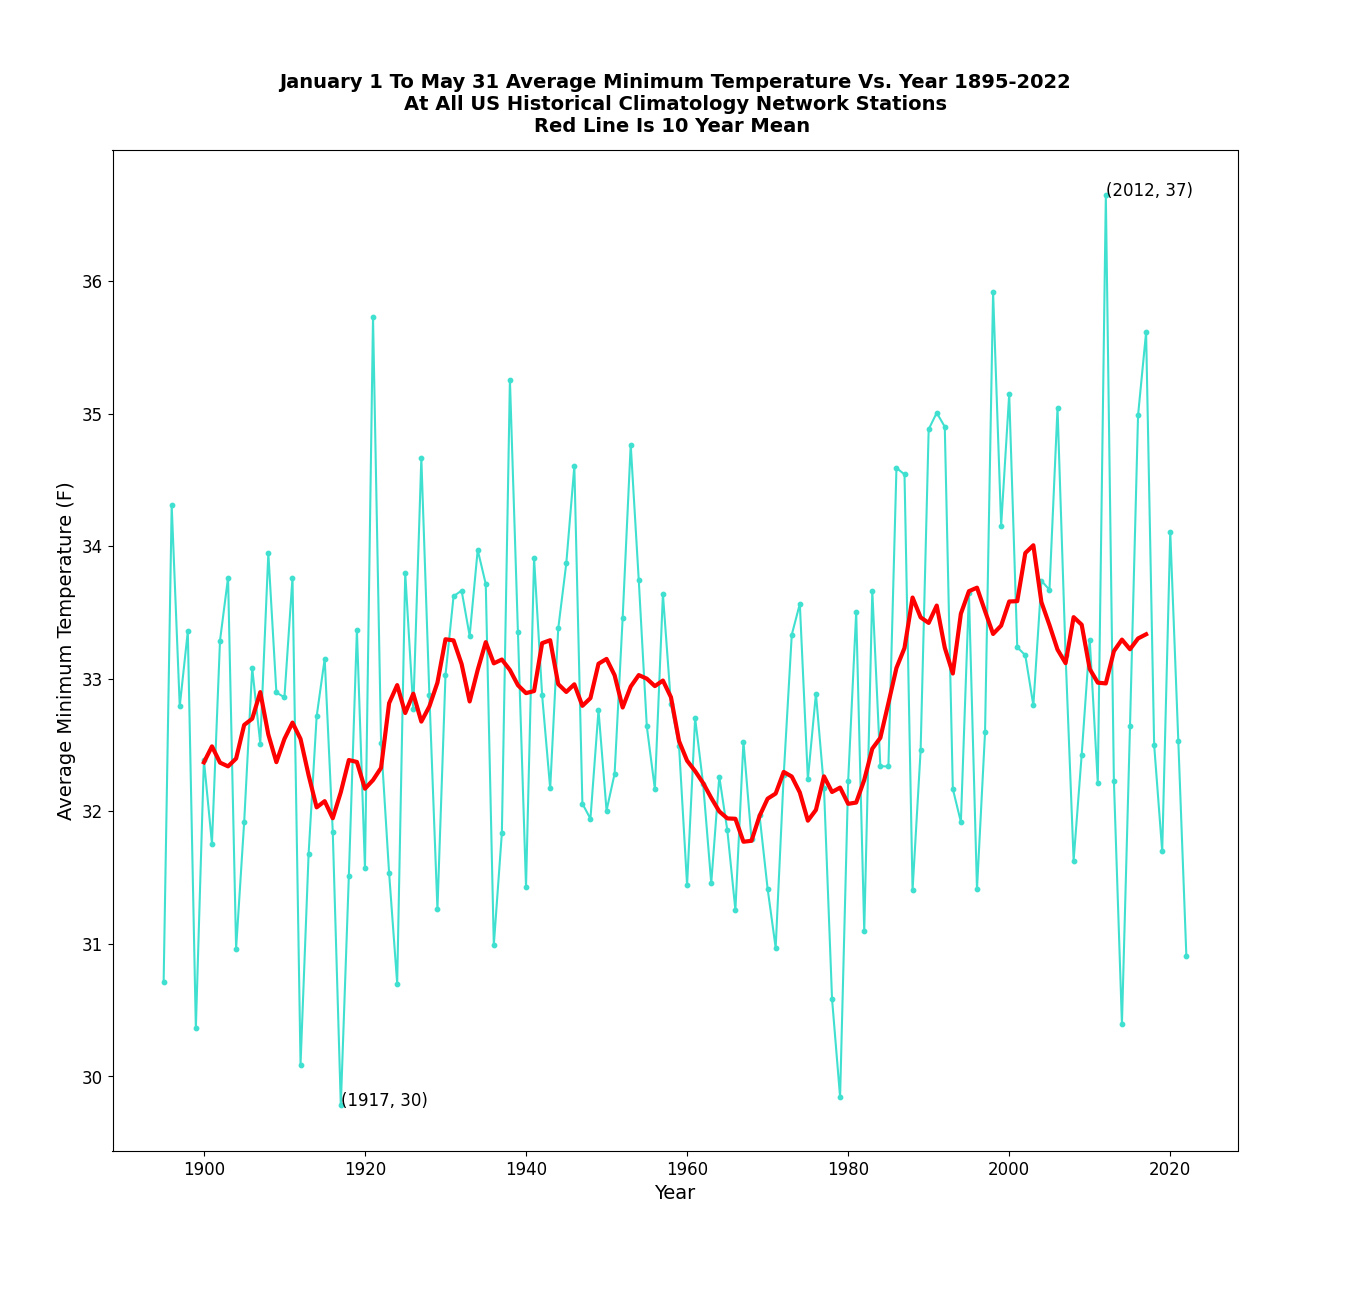
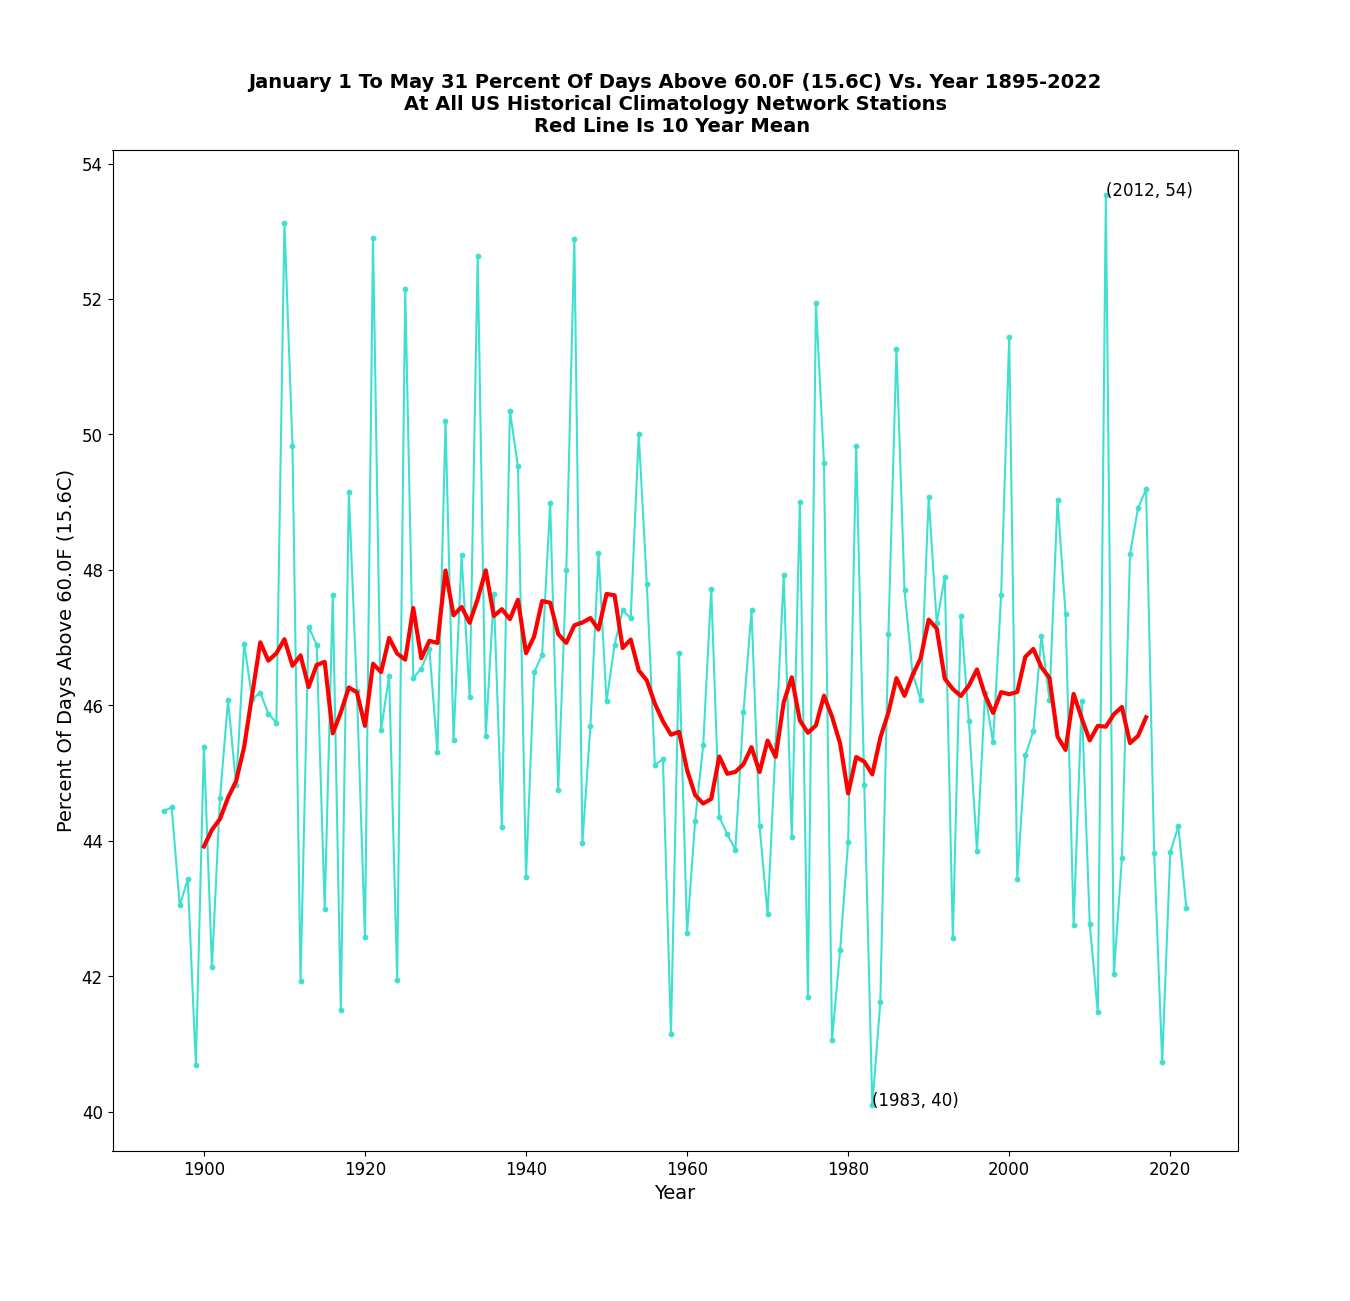
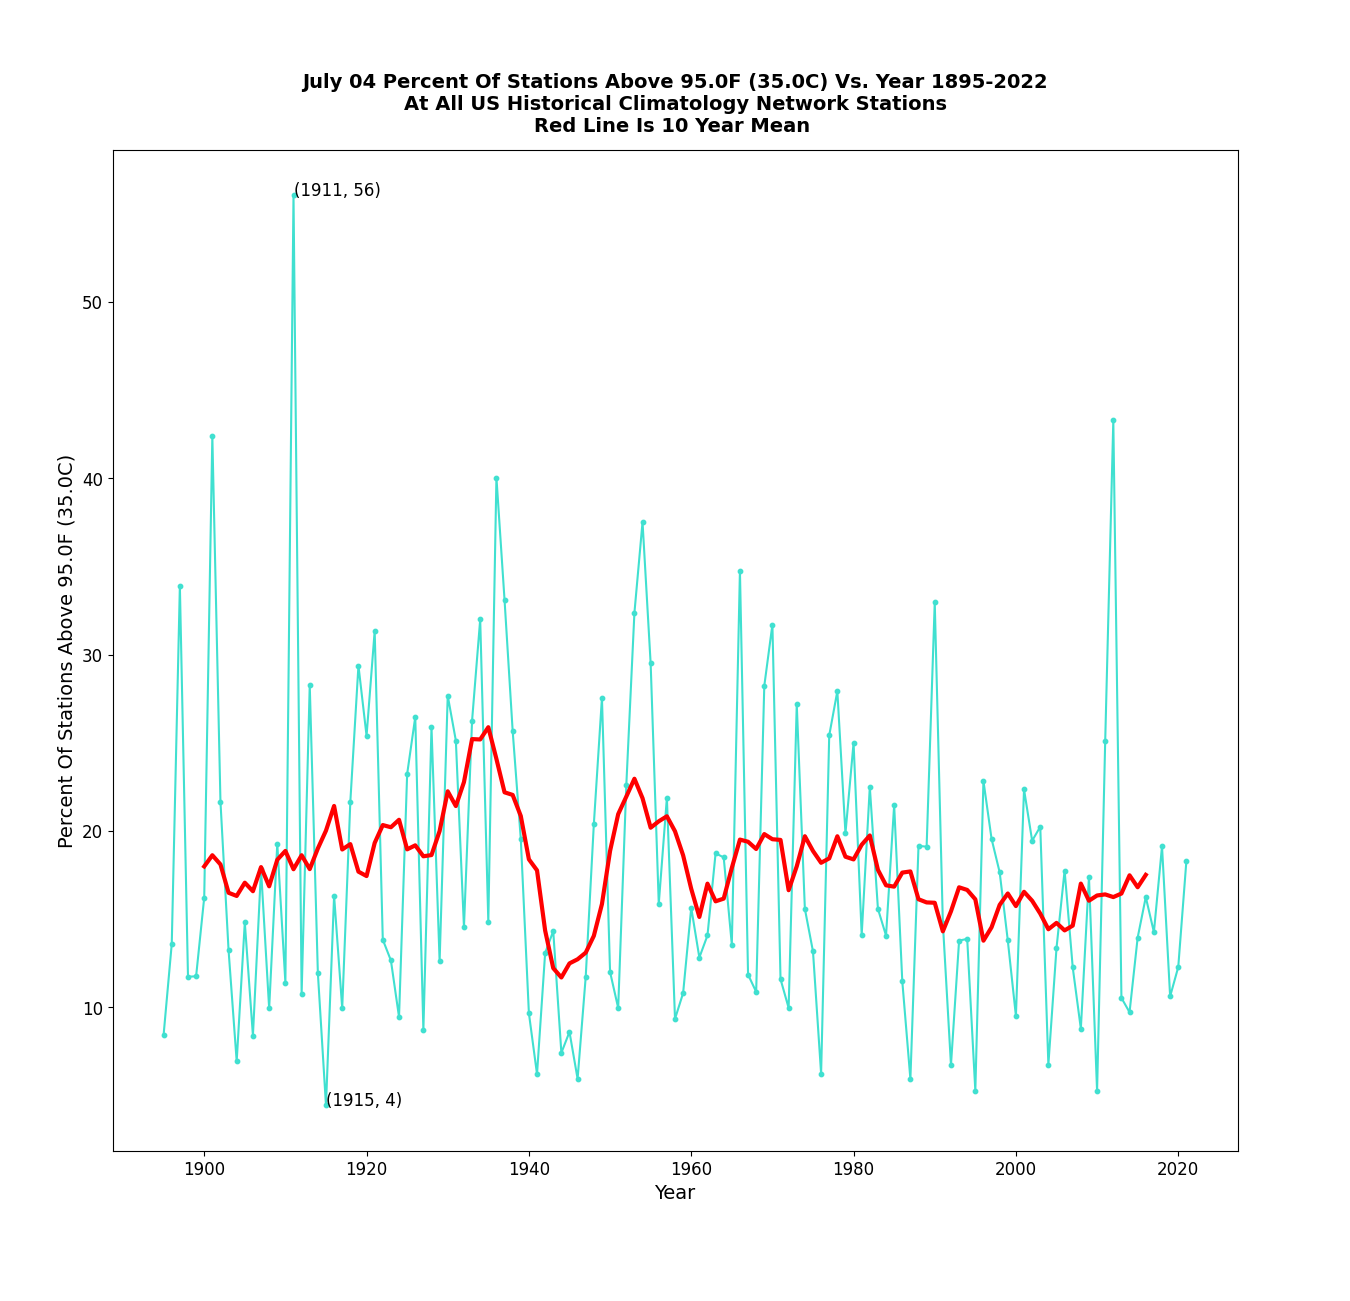
The three hottest springs in the US were 1934, 1911 and 1962.
The 1911 heatwaves began in January
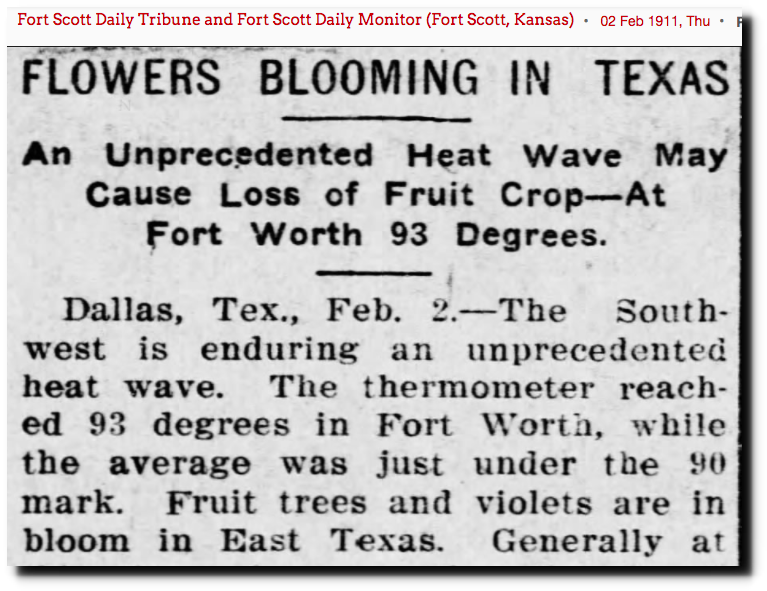
02 Feb 1911, Page 1 – Fort Scott Daily Tribune and Fort Scott Daily Monitor at Newspapers.com
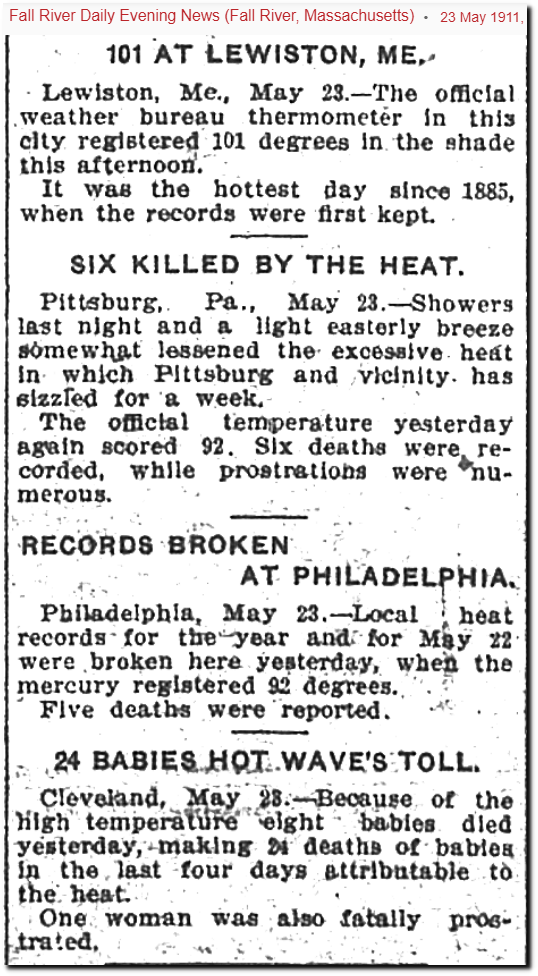
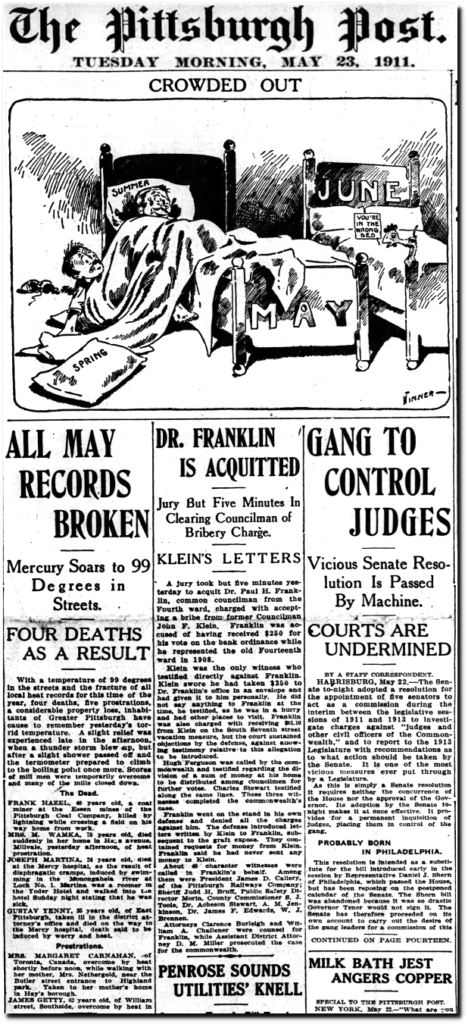
23 May 1911, 9 – Fall River Daily Evening News at Newspapers.com
04 Jul 1911, Page 1 – The Scranton Republican
The hottest July 4 occurred in 1911
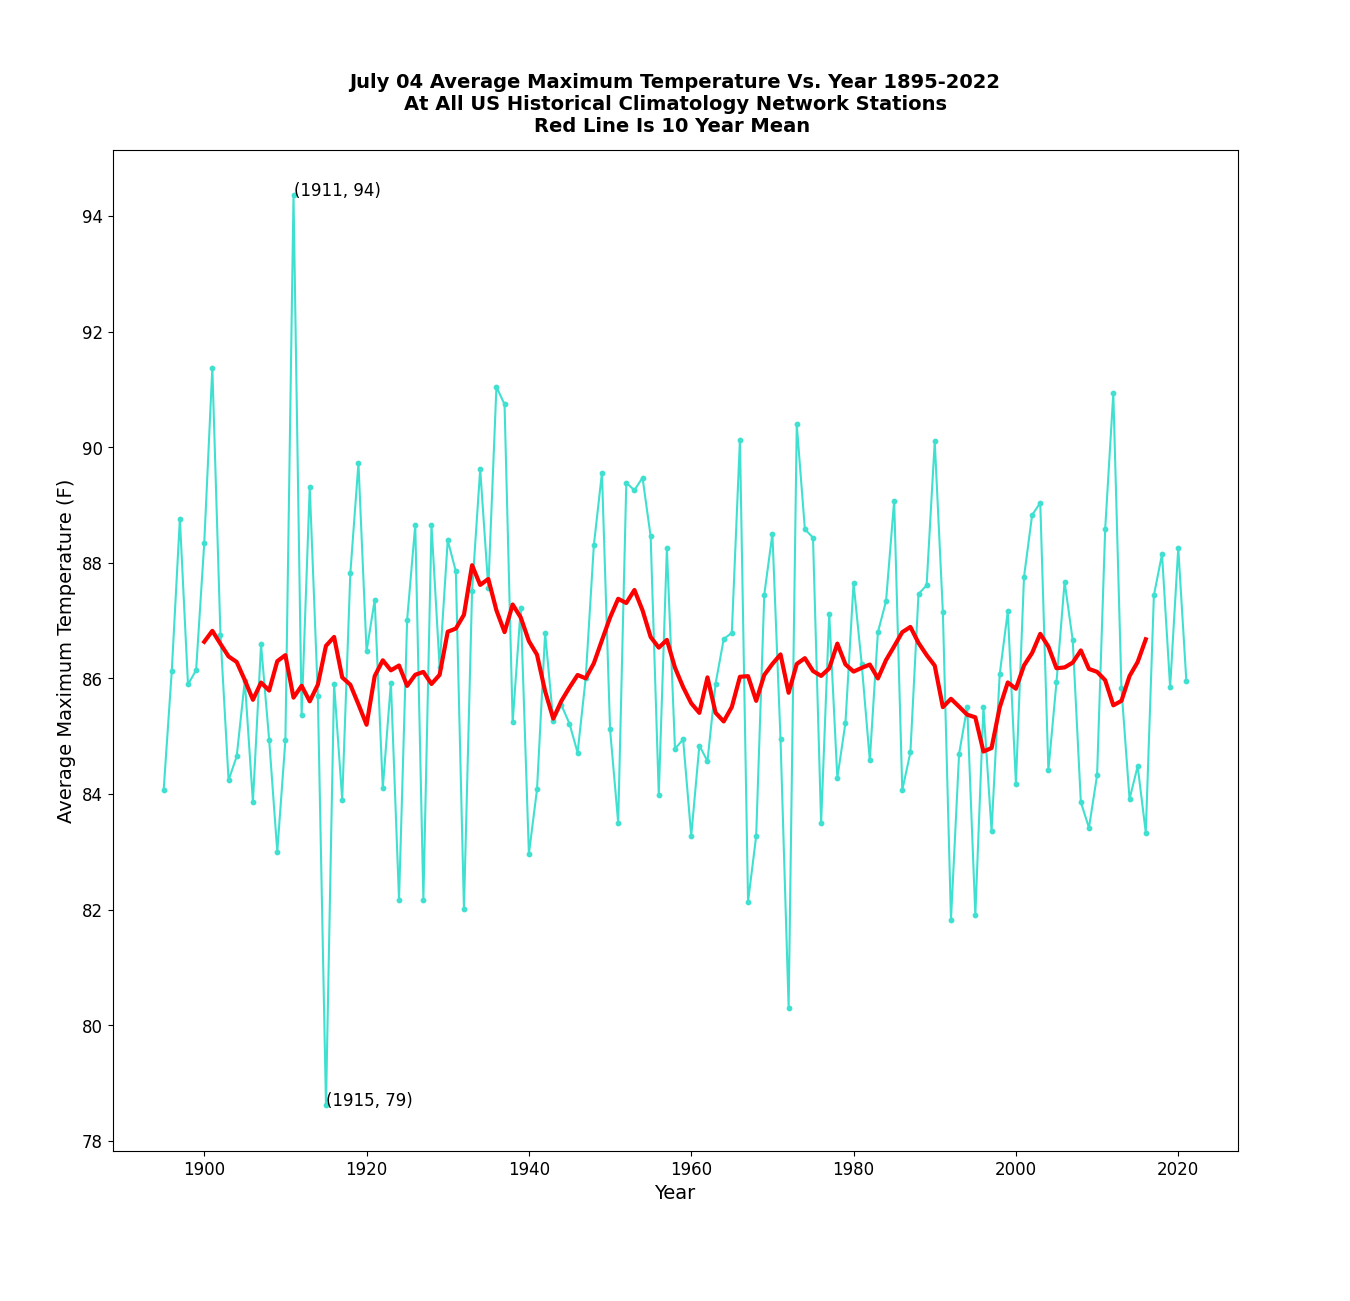
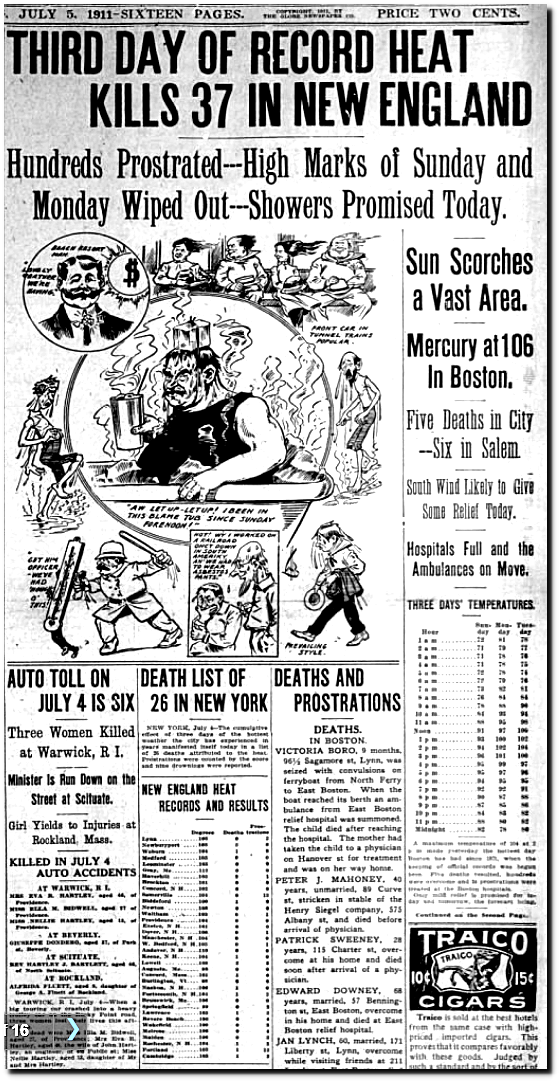
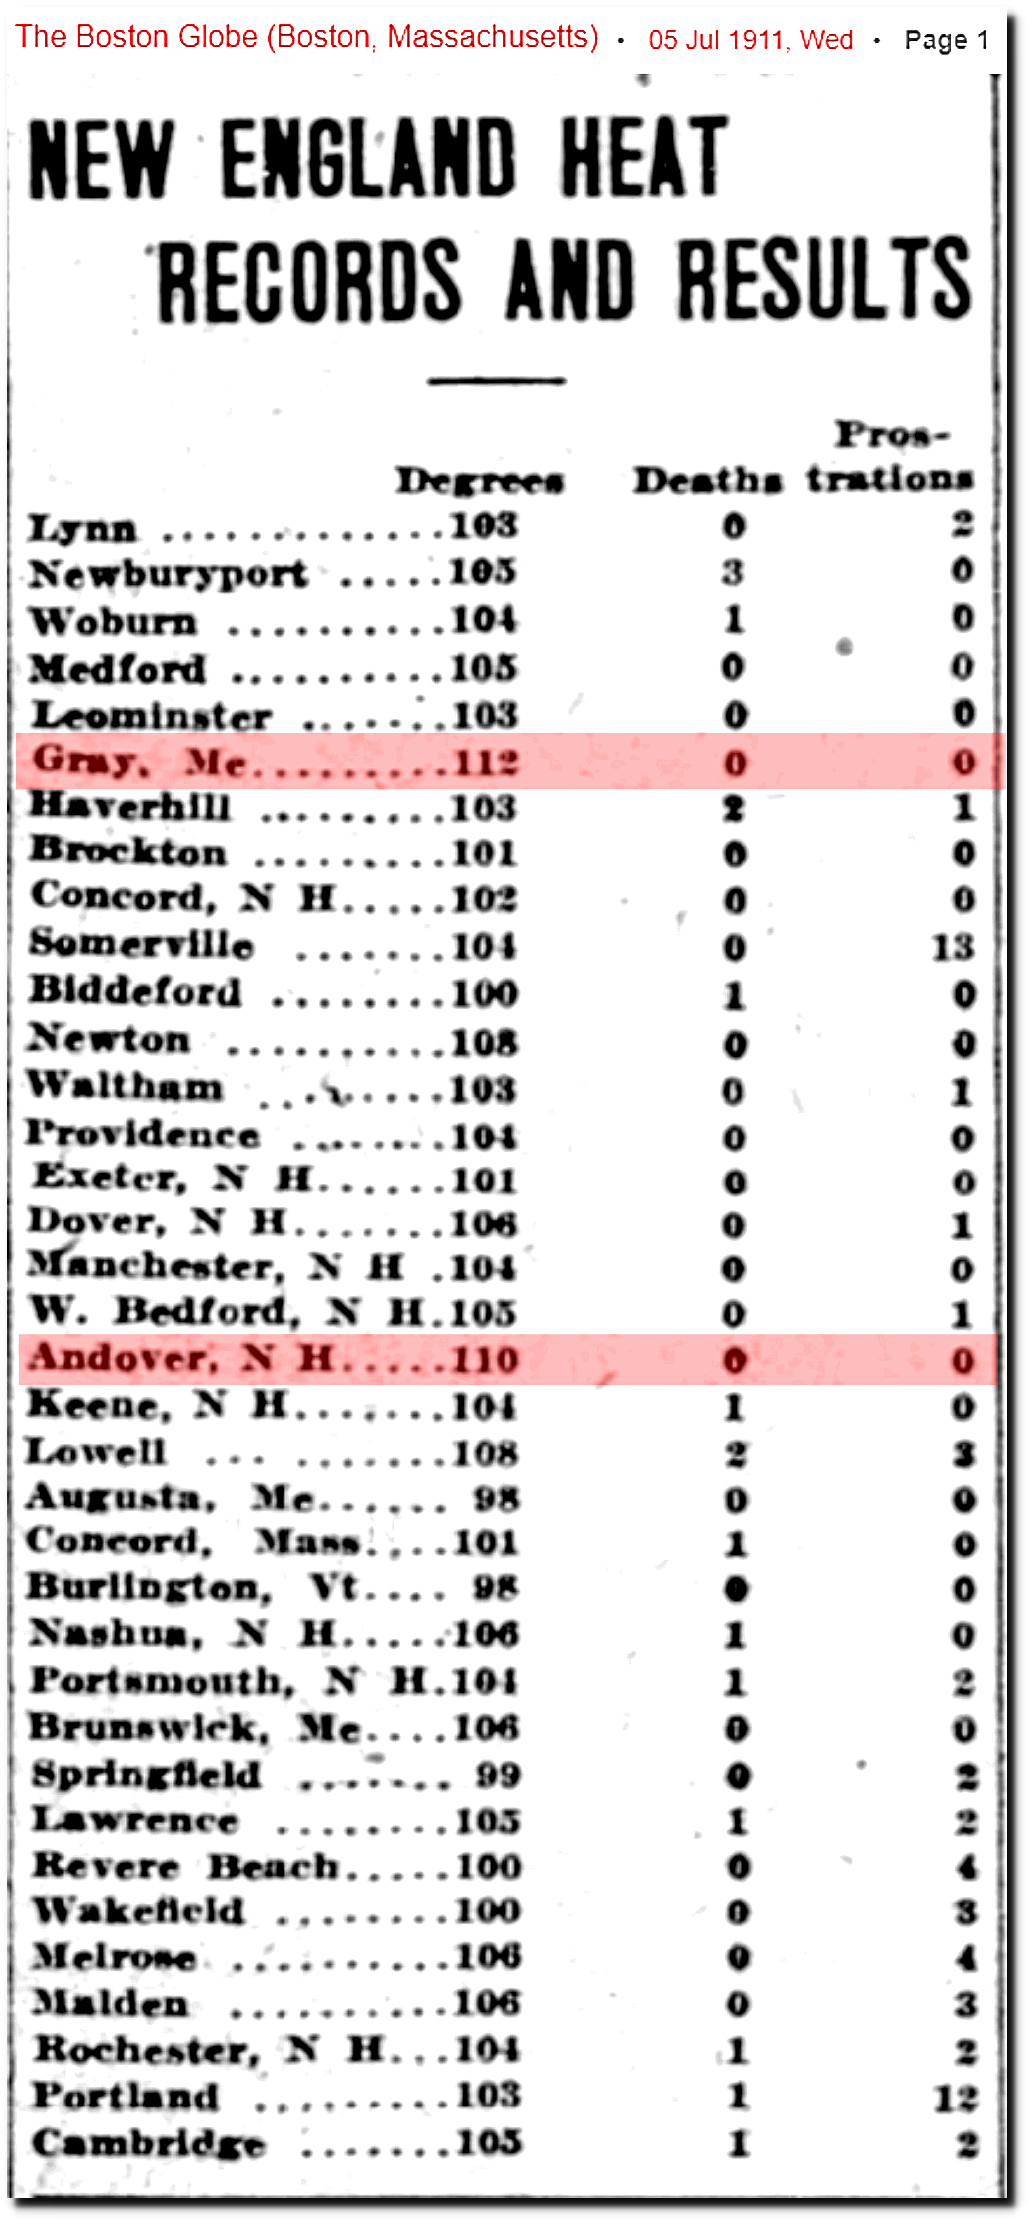
05 Jul 1911, 1 – The Boston Globe at Newspapers.com
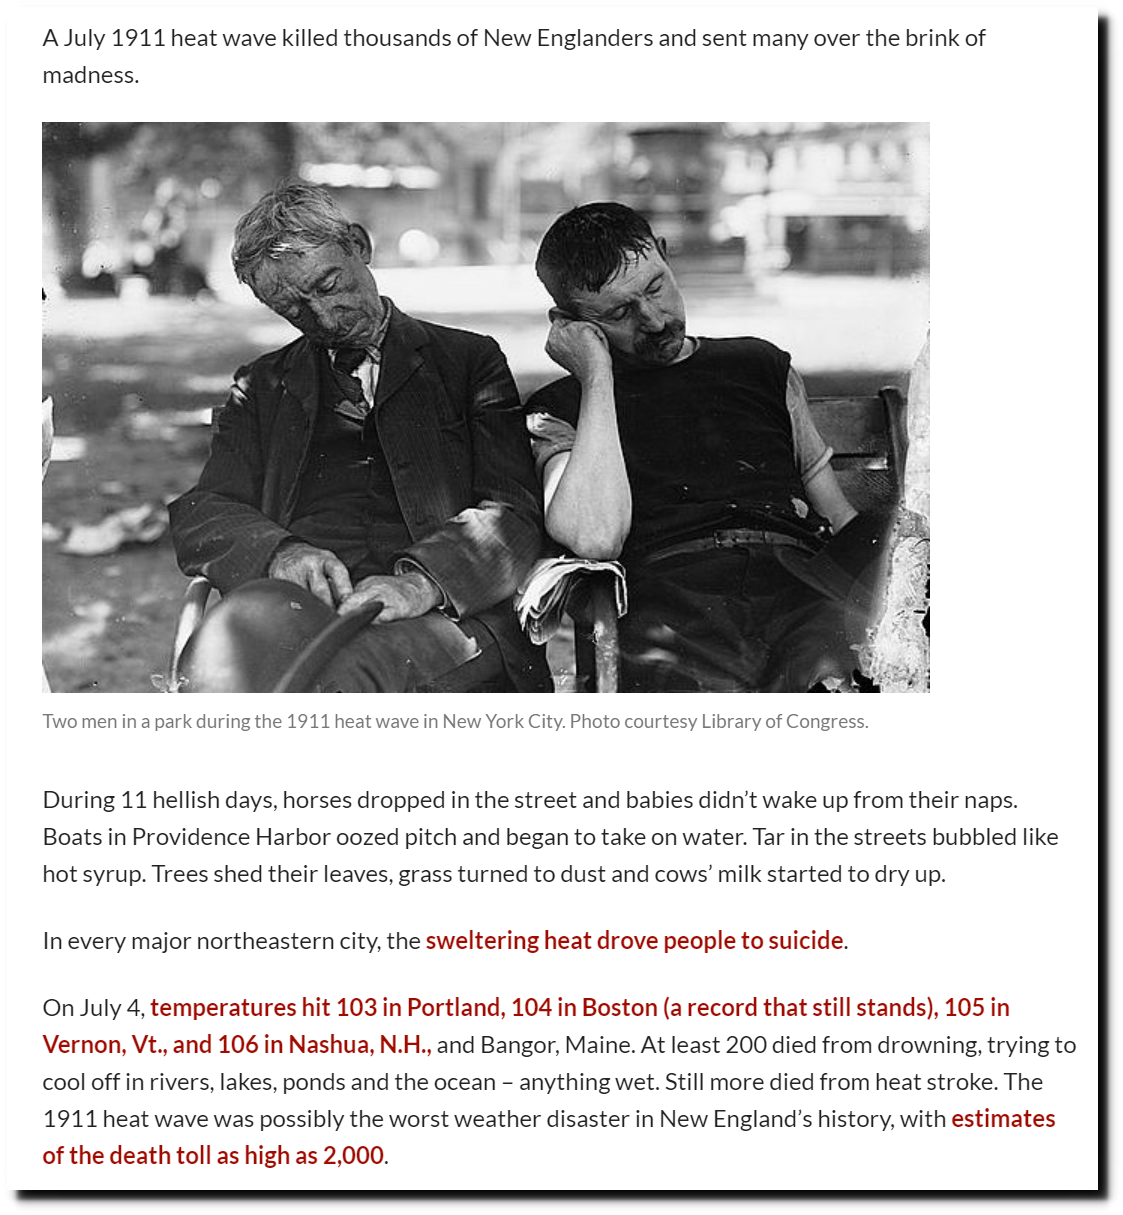
The 1911 Heat Wave Was So Deadly It Drove People Insane – New England Historical Society
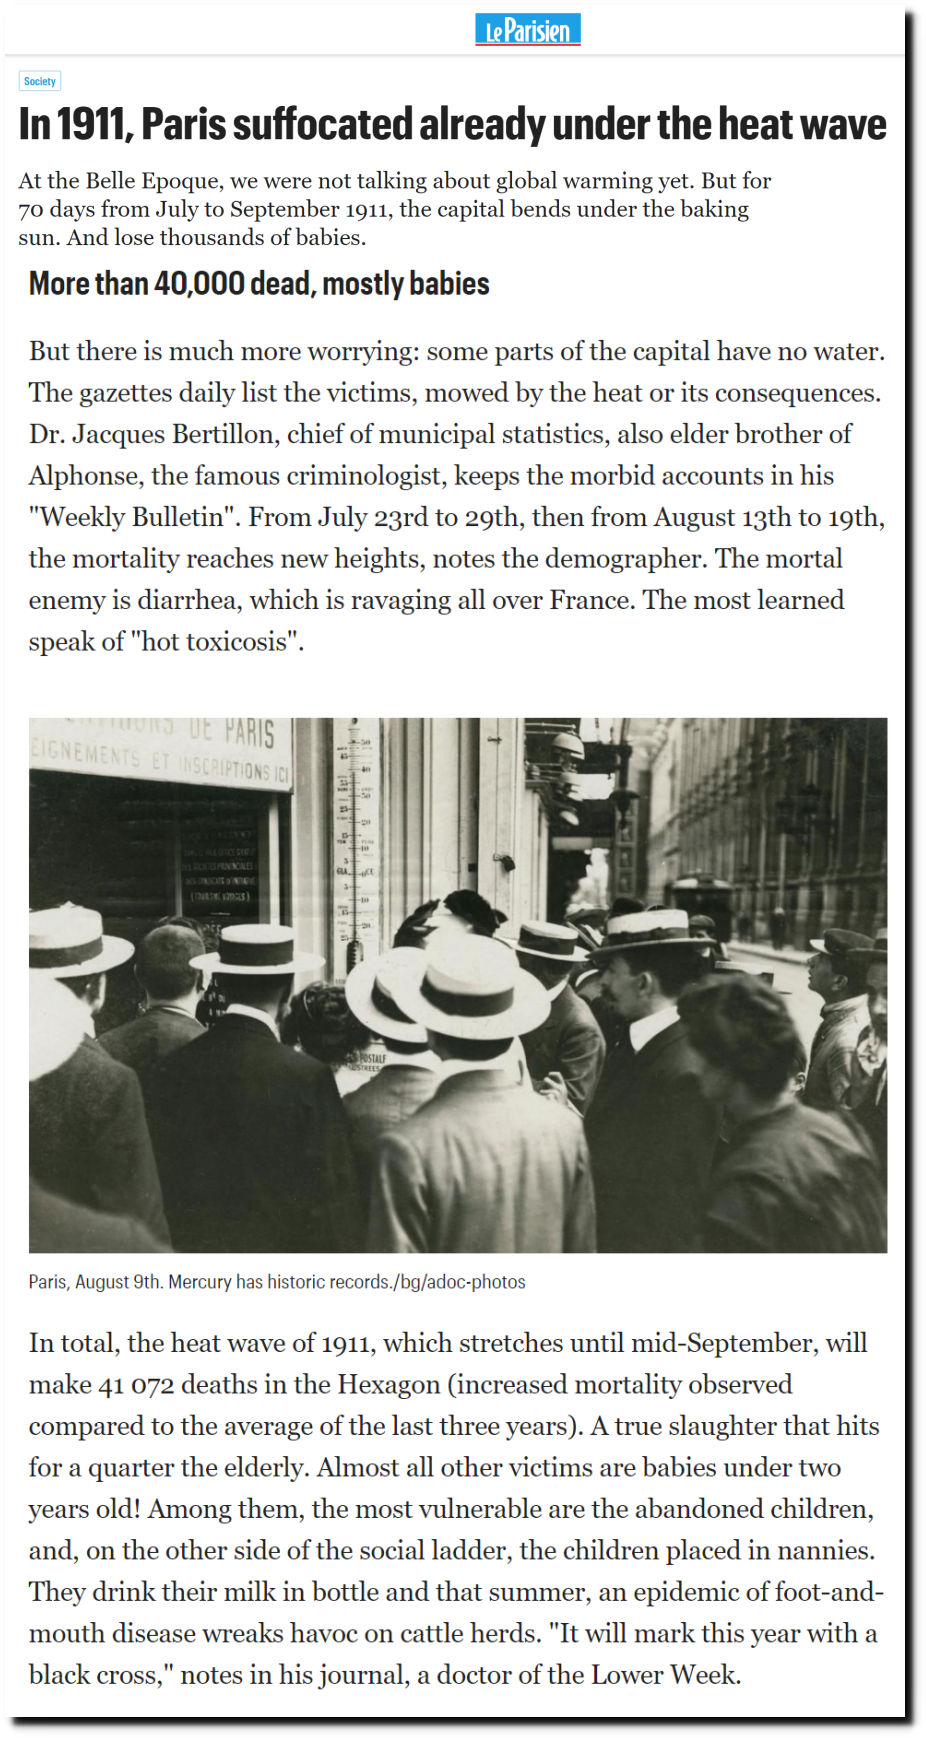
En 1911, Paris suffoquait déjà sous la canicule – Le Parisien
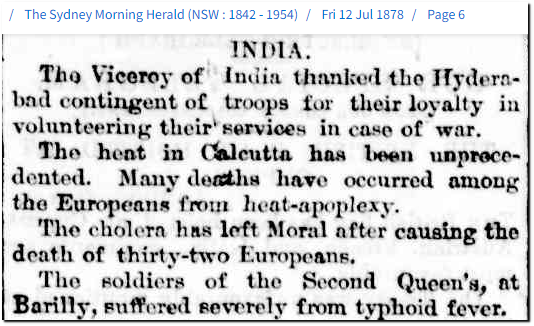
India is always hottest in spring before the monsoon season starts
“When a person is accustomed to 138 in the shade, his ideas about cold weather are not valuable….In India, “cold weather” is merely a conventional phrase and has come into use through the necessity of having some way to distinguish between weather which will melt a brass door-knob and weather which will only make it mushy.”
– Mark Twain
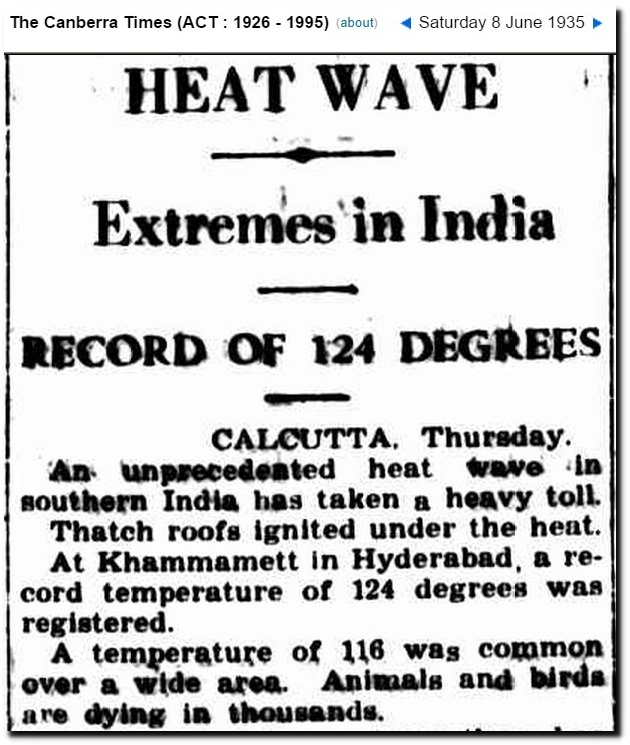
08 Jun 1935 – HEAT WAVE – Trove
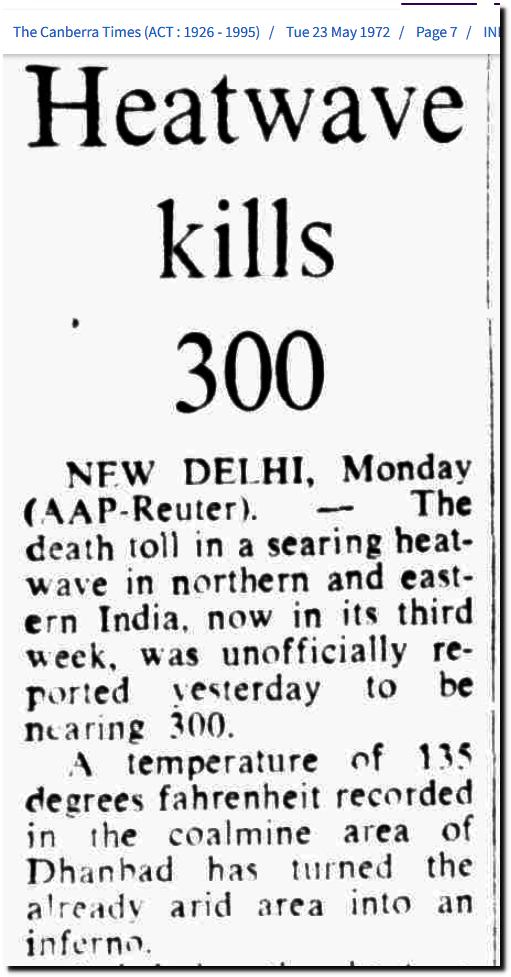
23 May 1972 – INDIA Heatwave kills 300 – Trove
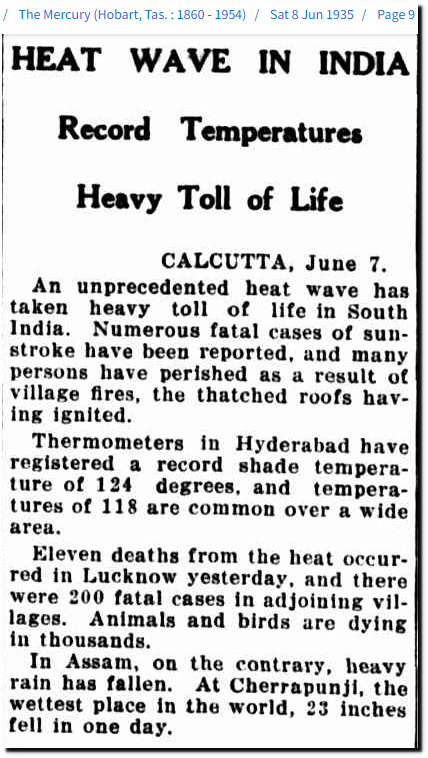
08 Jun 1935 – HEAT WAVE IN INDIA – Trove
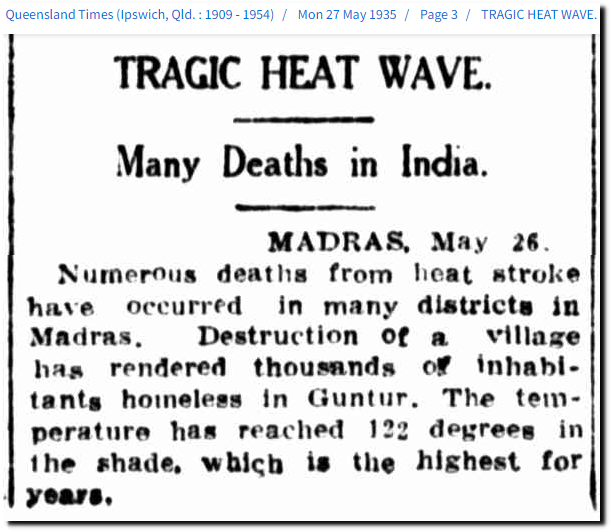
27 May 1935 – TRAGIC HEAT WAVE. – Trove
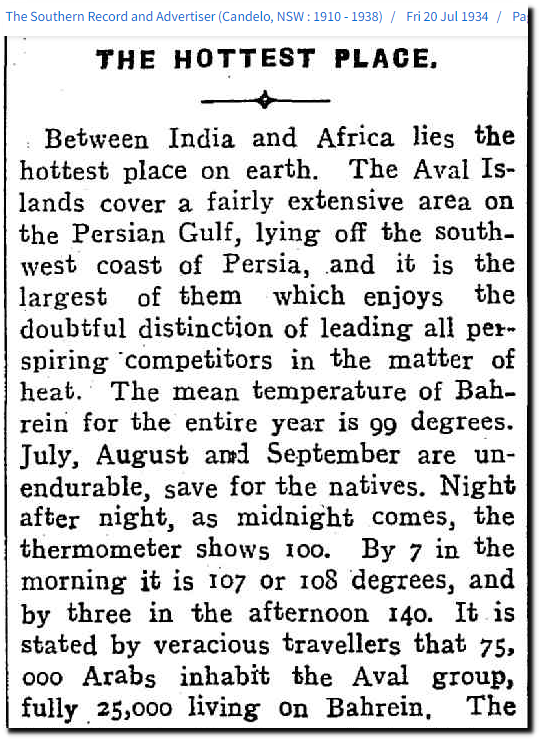
20 Jul 1934 – THE HOTTEST PLACE. – Trove
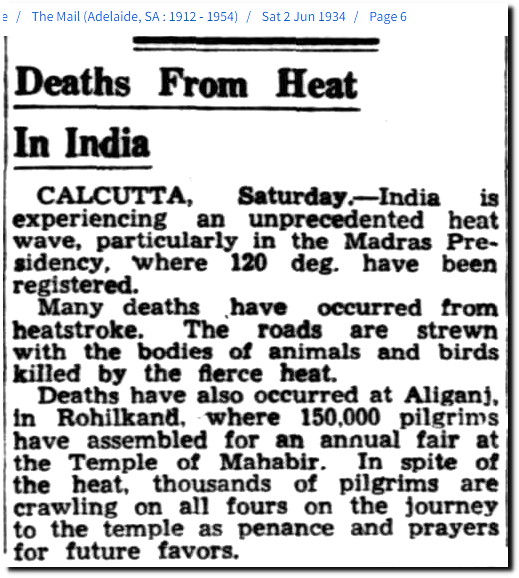
02 Jun 1934 – Deaths From Heat – Trove
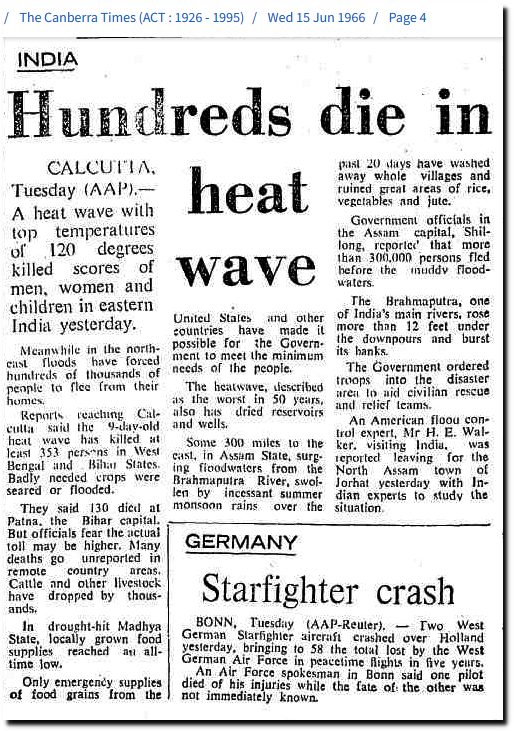
15 Jun 1966 – INDIA Hundreds die in heat wave – Trove
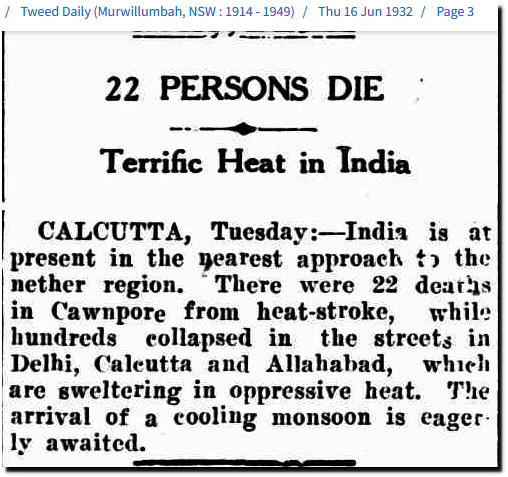
16 Jun 1932 – 22 PERSONS DIE – Trove
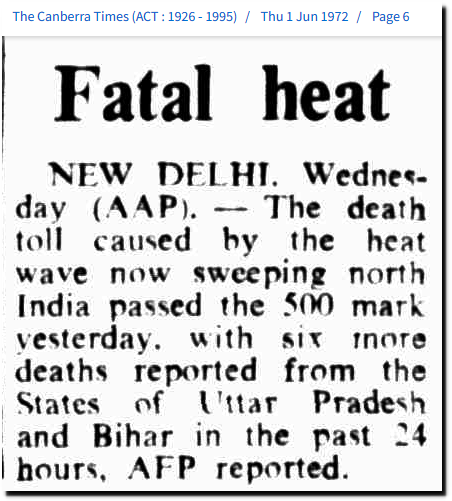
01 Jun 1972 – Fatal heat – Trove
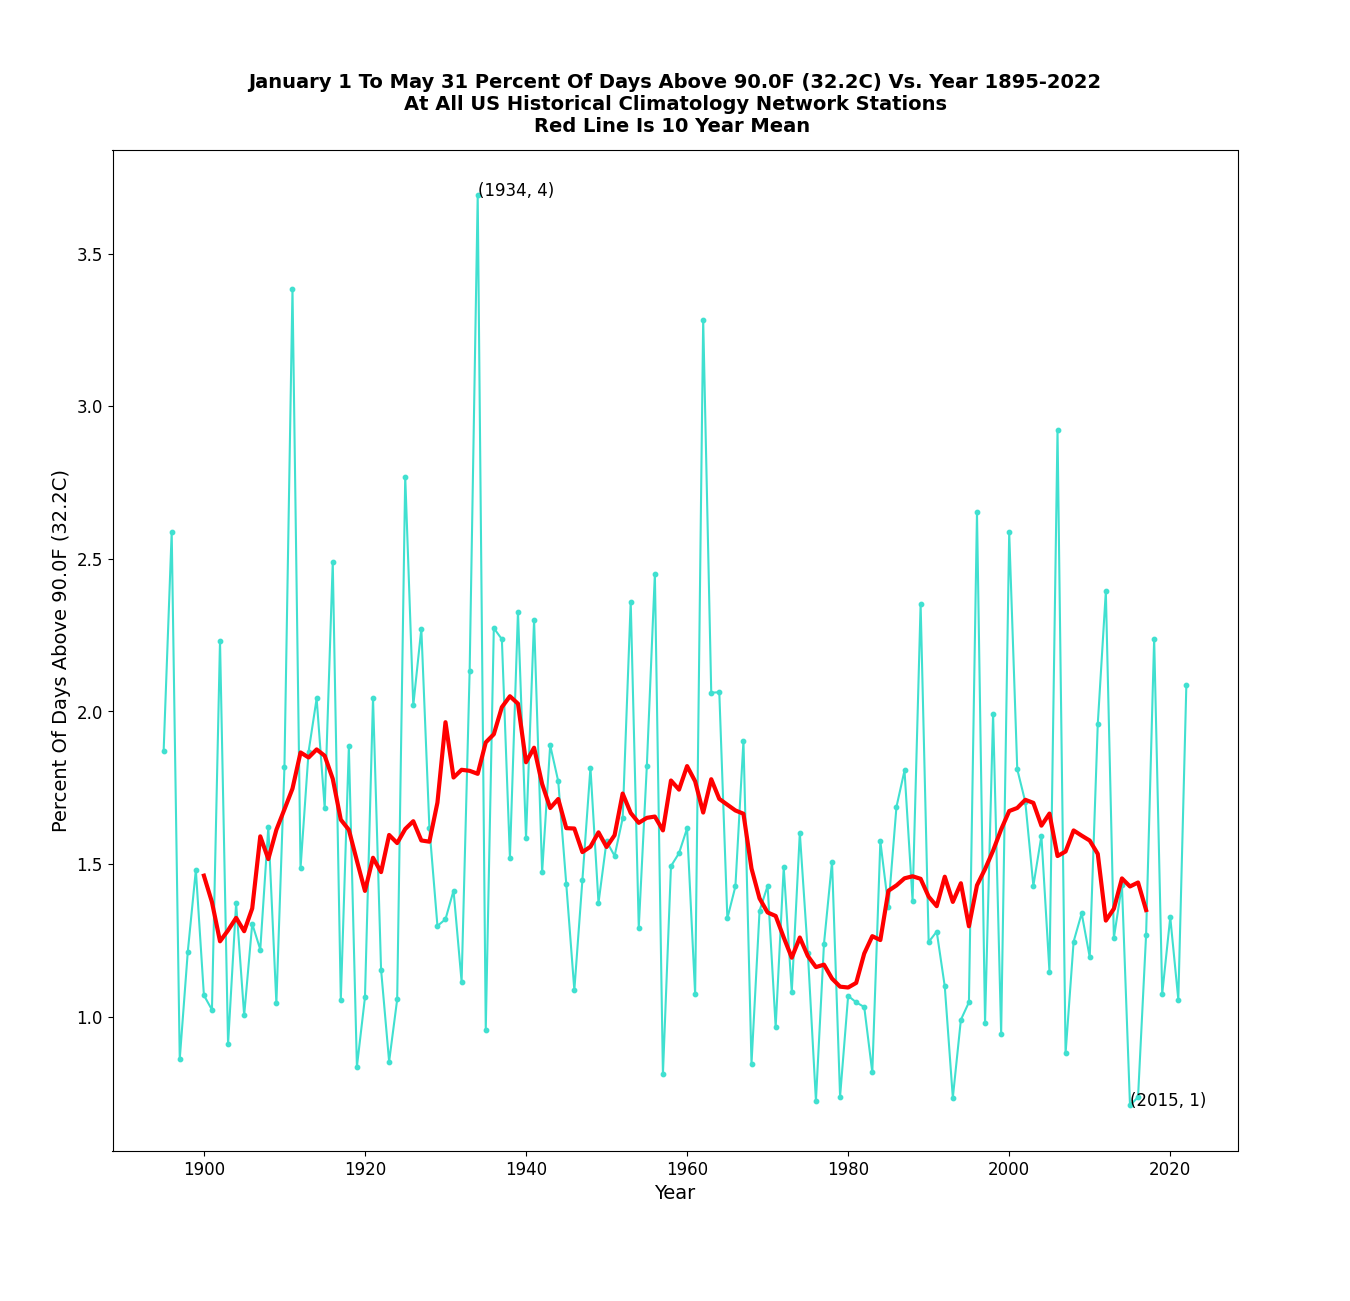
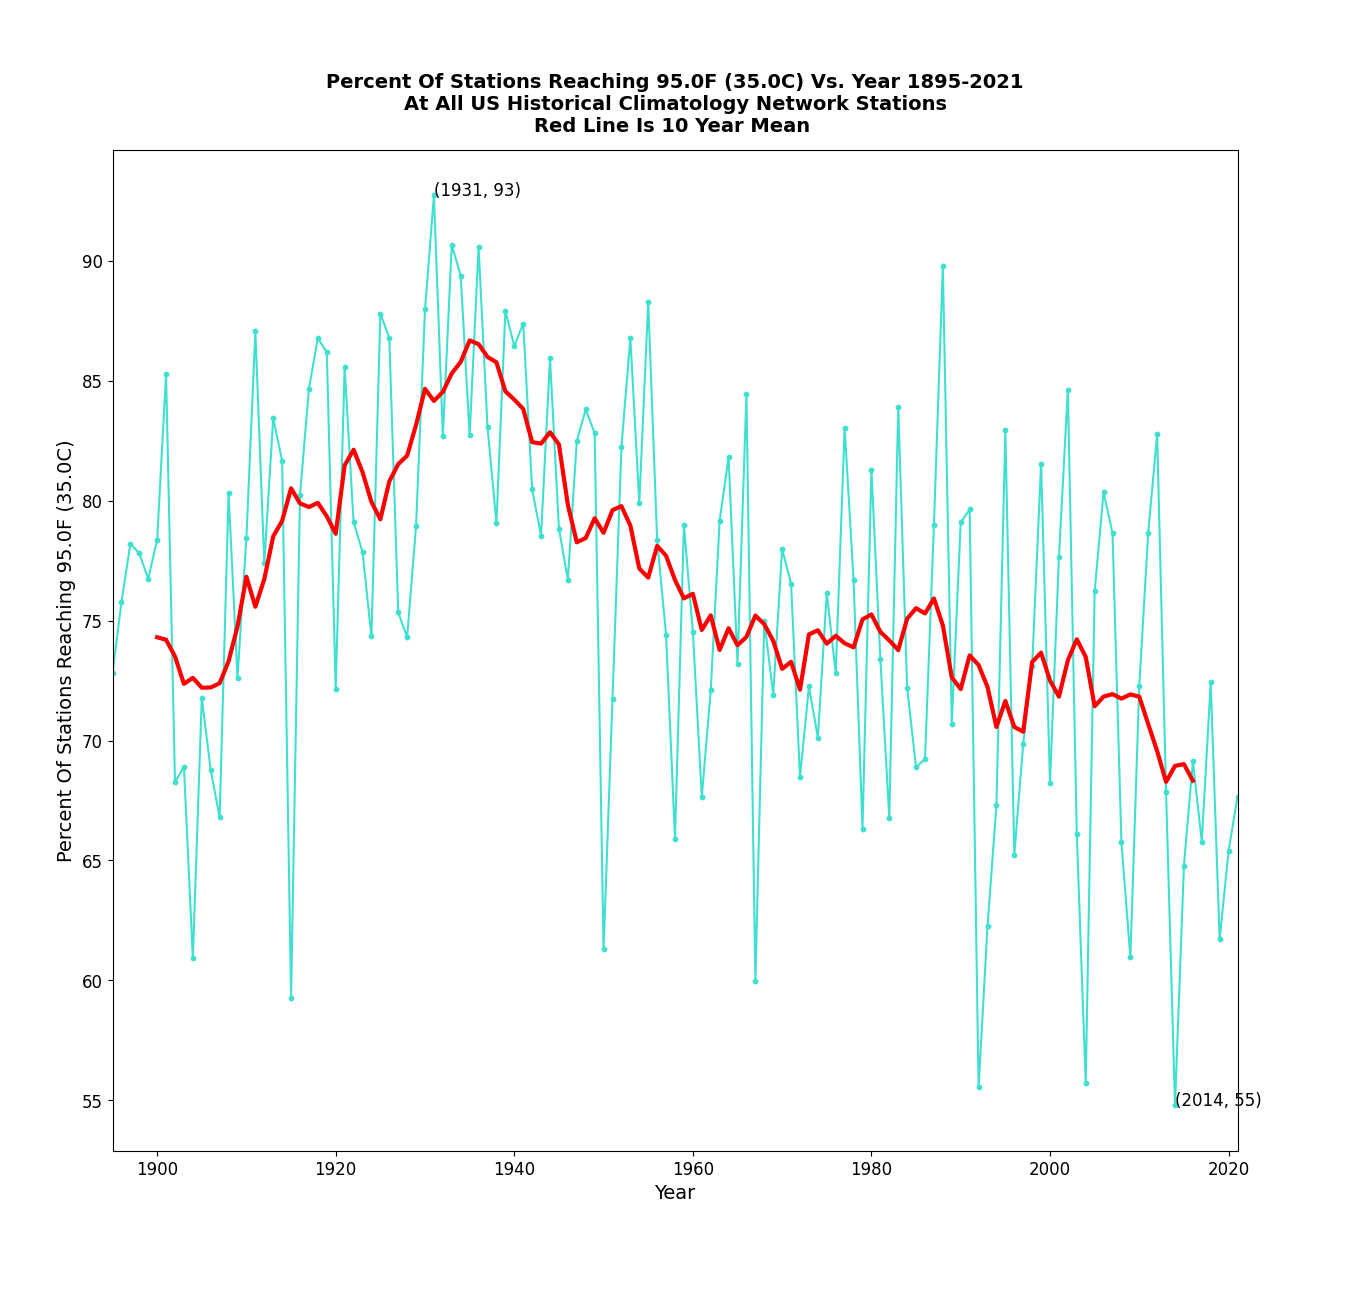
The areal coverage and intensity of US heatwaves are near record lows.
Posted in Uncategorized
Leave a comment
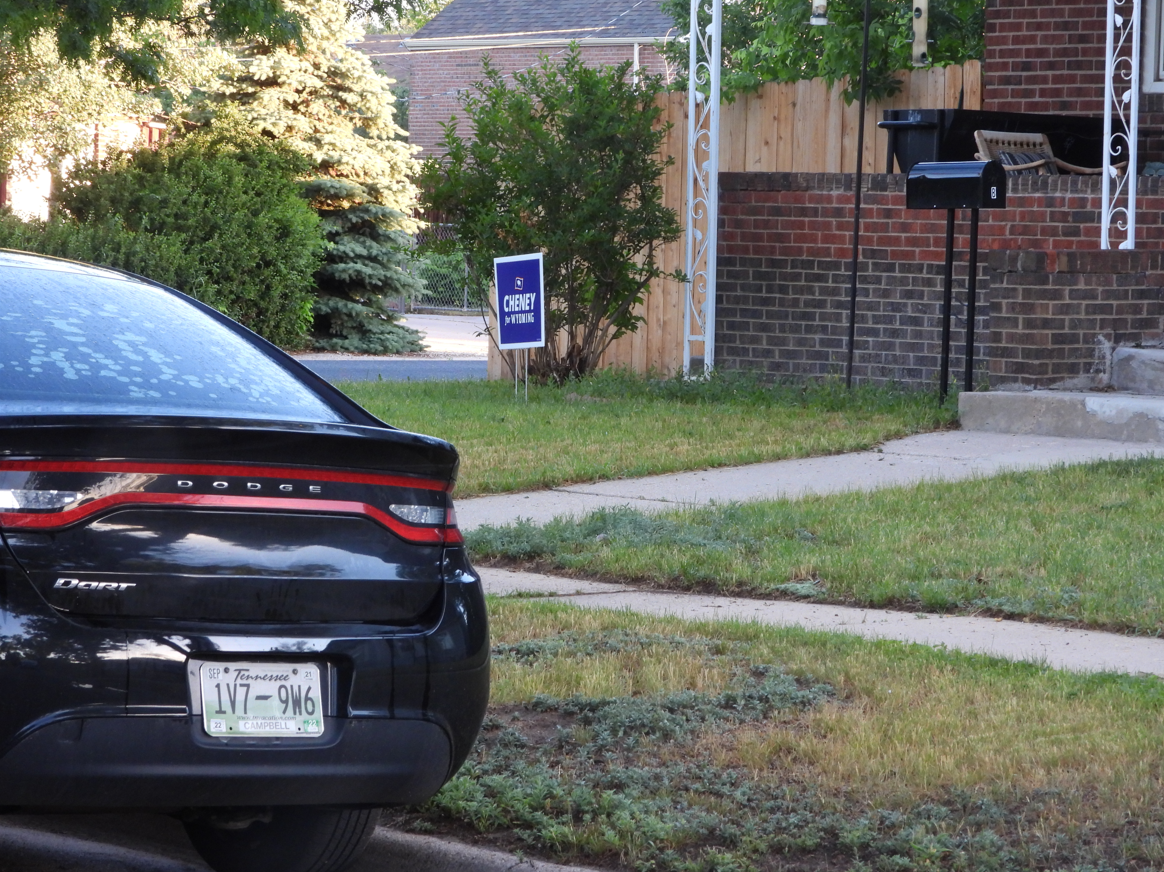
Cheney For Tennessee
These people moved to Cheyenne from Tennessee last summer. They haven’t changed their license plates to Wyoming and they don’t take care of their yard, but they do have a Biden blue “Cheney for Wyoming” sign in front of their house.
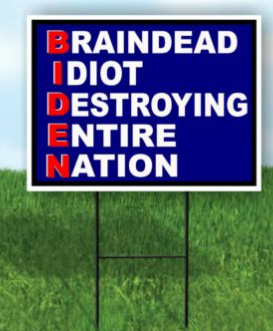
Here is a better sign.
Posted in Uncategorized
Leave a comment