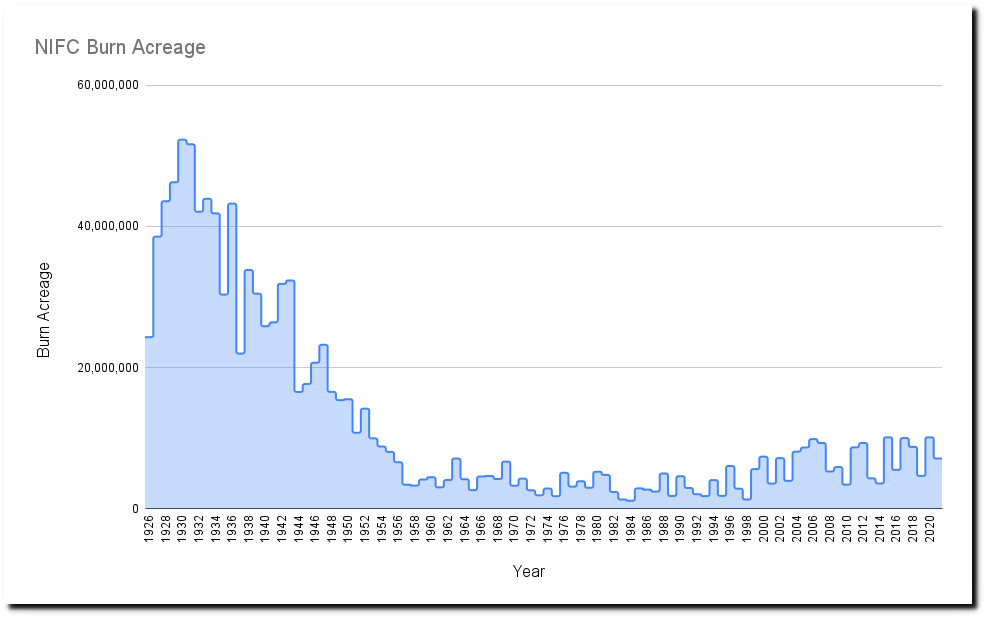
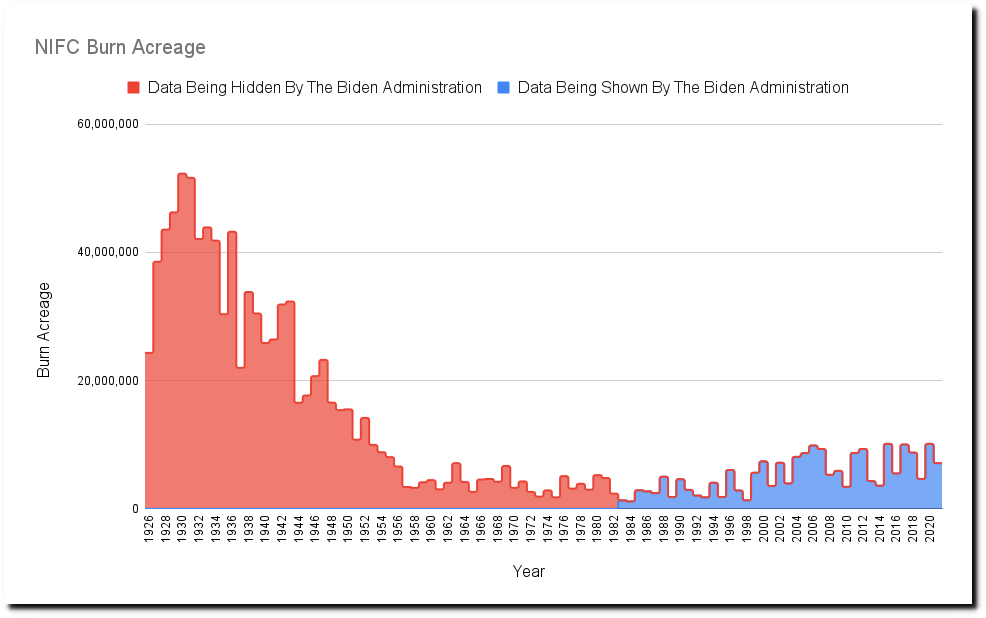
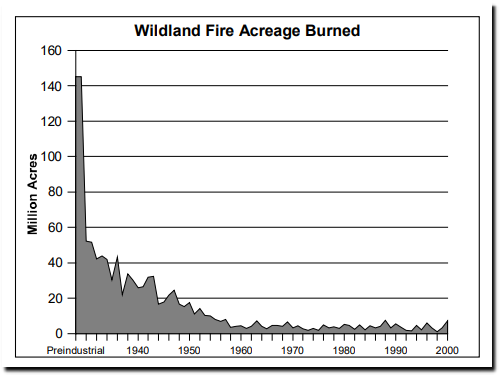
The US Forest Service shows that burn acreage in the US was much higher prior to 1960.
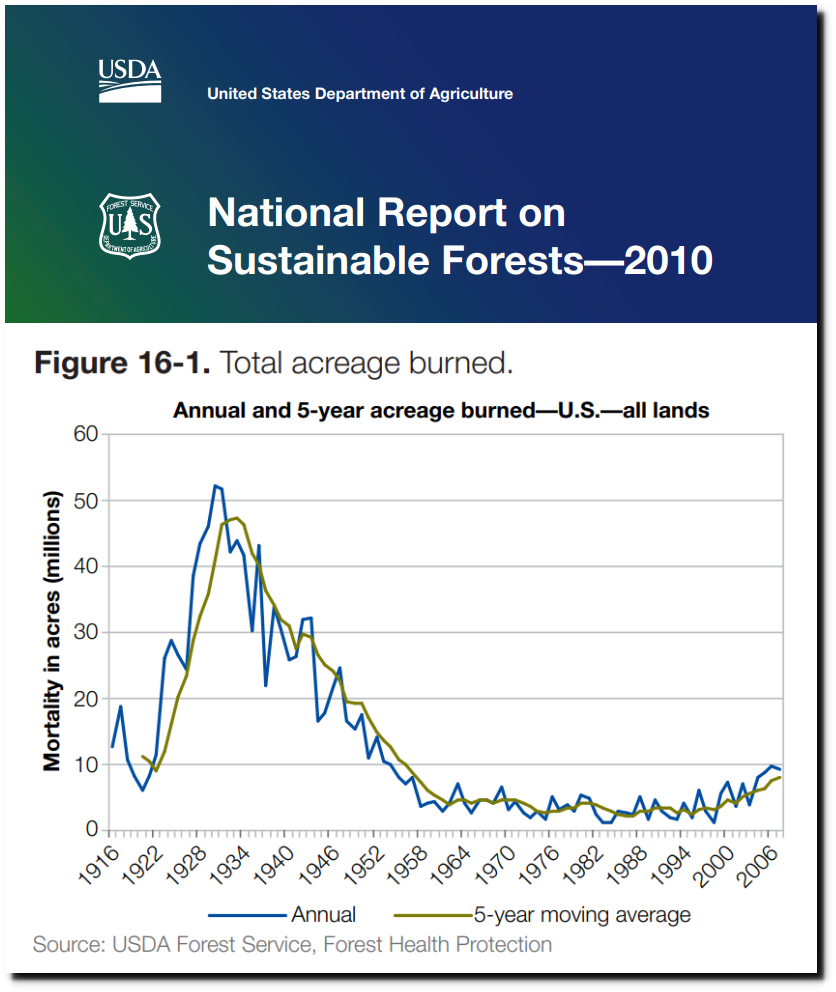
2010-sustainability-report.pdf
The data was kept in great detail, as reported by the New York Times in 1938.
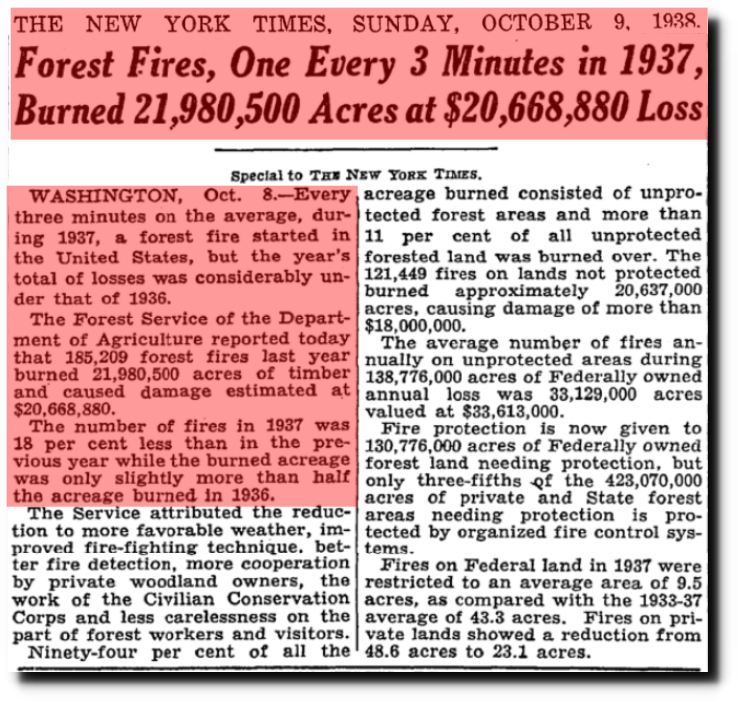
TimesMachine: October 9, 1938 – NYTimes.com
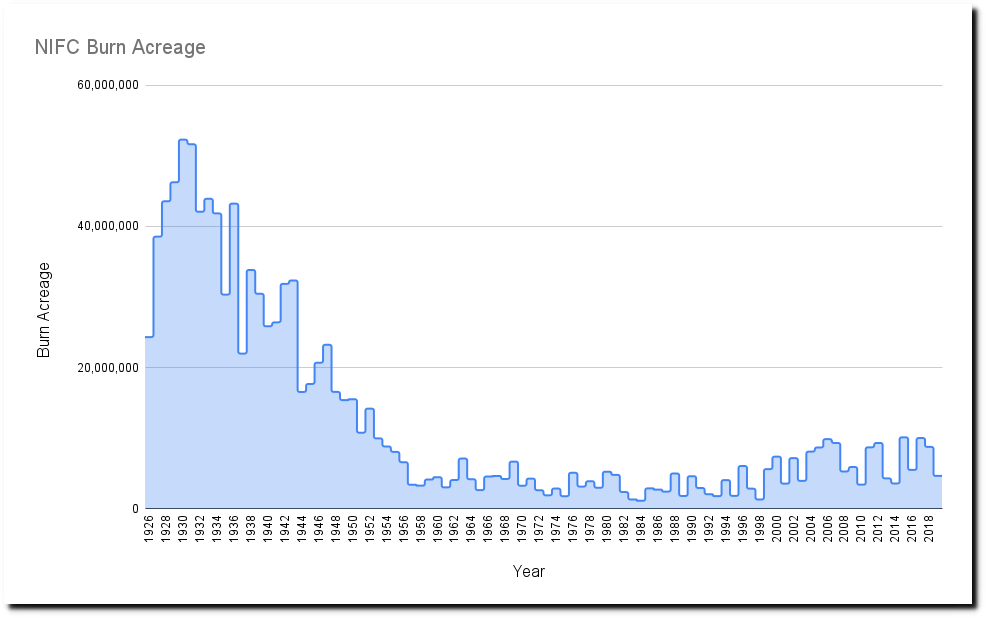
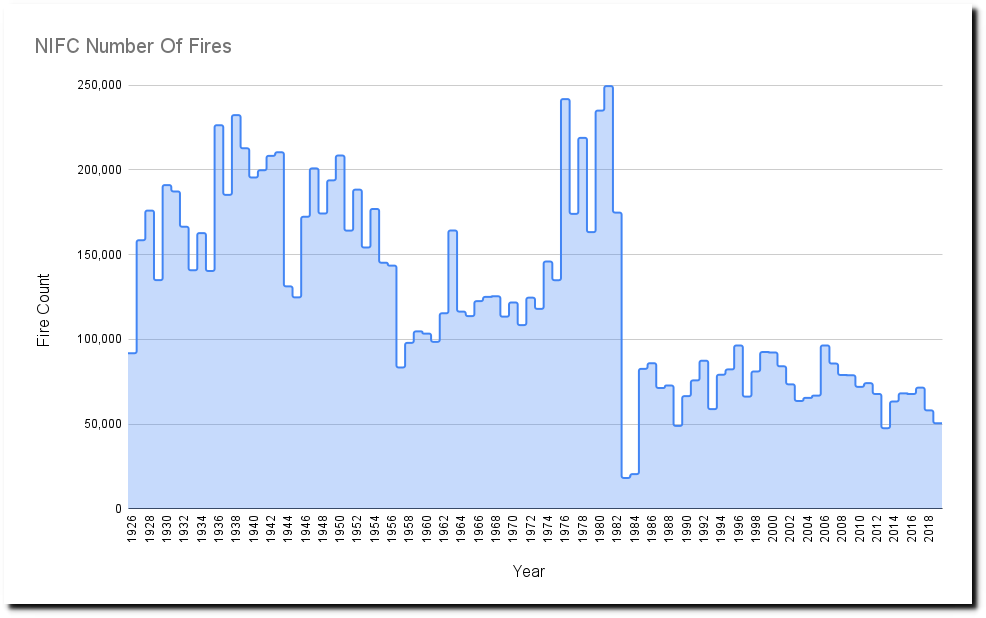
As of January 29, 2021 the National Interagency Fire Center showed the same data through 2019.
It came with this disclaimer, which apparently was referring to a discrepancy in the way the number of fires was counted prior to 1983.
National Interagency Fire Center
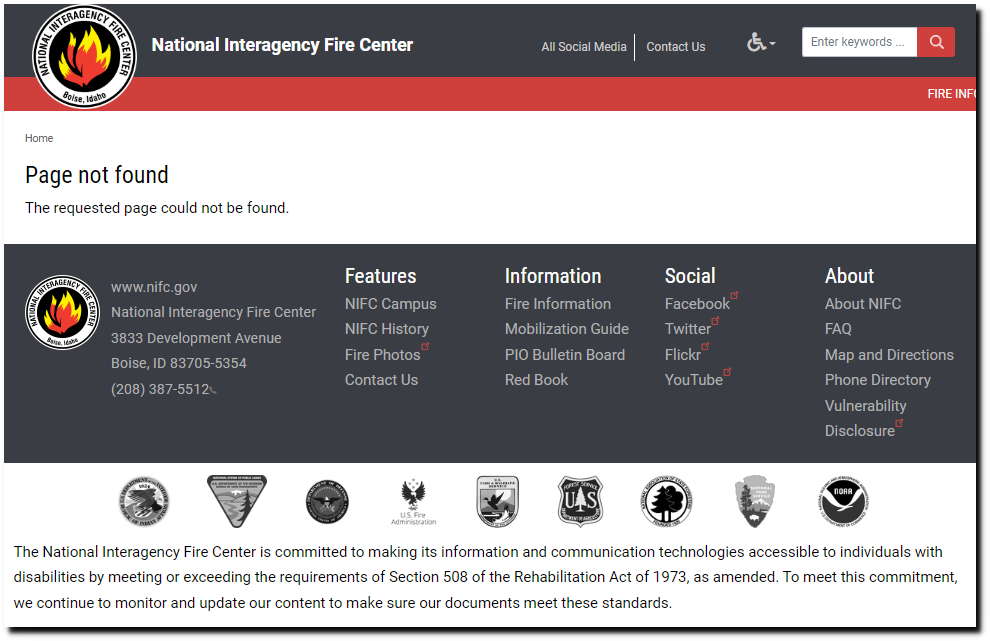
But by February 27, 2021 the page had disappeared.

Page not found | National Interagency Fire Center
Now if you go to that website it redirects to another page which hides the data prior to 1983.
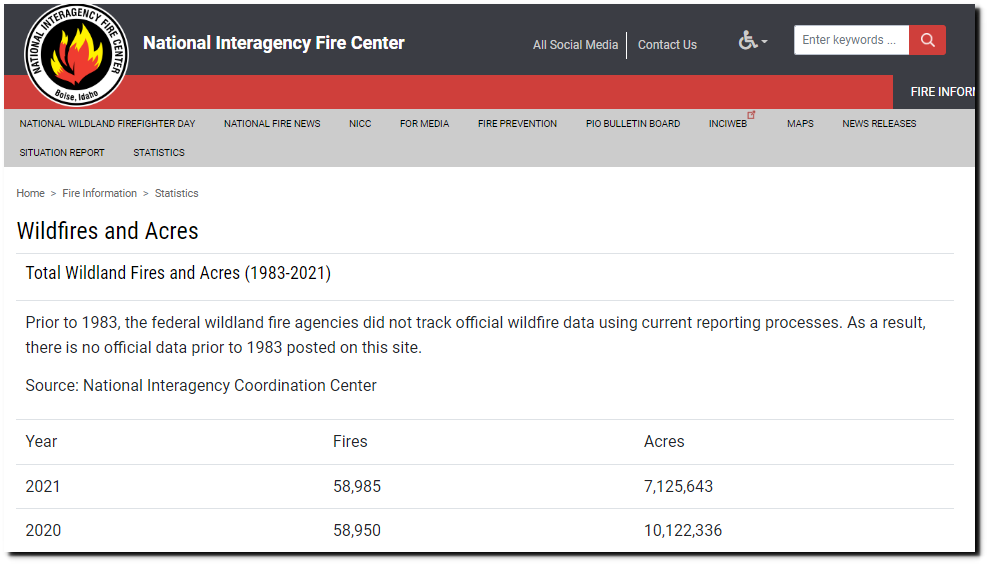
Wildfires and Acres | National Interagency Fire Center
This graph shows the complete data set updated through 2021.
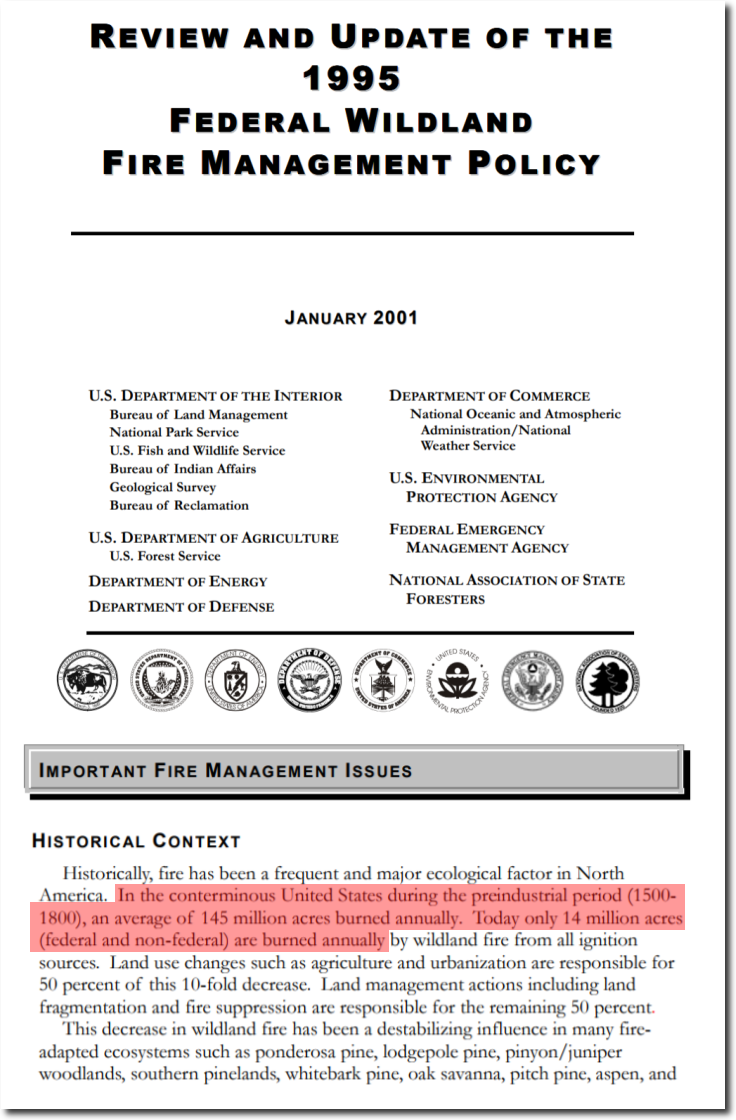
On November 1, 2020 this twenty year old document was on the National Interagency Fire Center website. That was right before the pretend election.
“Historically, fire has been a frequent and major ecological factor in North America. In the conterminous United States during the preindustrial period (1500- 1800), an average of 145 million acres burned annually. Today only 14 million acres (federal and non-federal) are burned annually by wildland fire from all ignition sources.”
Wayback Machine
The next time it was captured by the Internet Archive was April 25, 2021 and looked like this :
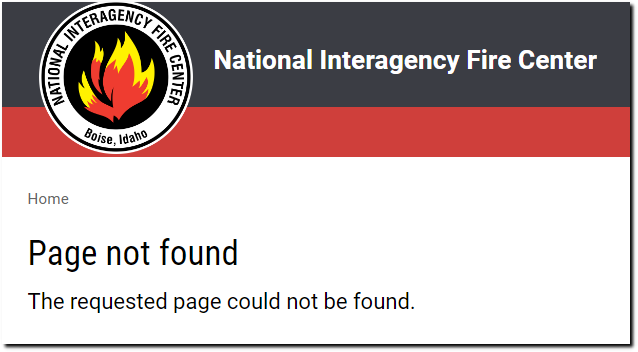
Page not found | National Interagency Fire Center
Now it looks like this :
“The National Interagency Fire Center is committed to making its information and communication technologies accessible to individuals with disabilities”
Page not found | National Interagency Fire Center