


Disrupting the Borg is expensive and time consuming!

Google Search
-
Recent Posts
- Analyzing The Western Water Crisis
- Gaslighting 1924
- “Why Do You Resist?”
- Climate Attribution Model
- Fact Checking NASA
- Fact Checking Grok
- Fact Checking The New York Times
- New Visitech Features
- Ice-Free Arctic By 2014
- Debt-Free US Treasury Forecast
- Analyzing Big City Crime (Part 2)
- Analyzing Big City Crime
- UK Migration Caused By Global Warming
- Climate Attribution In Greece
- “Brown: ’50 days to save world'”
- The Catastrophic Influence of Bovine Methane Emissions on Extraterrestrial Climate Patterns
- Posting On X
- Seventeen Years Of Fun
- The Importance Of Good Tools
- Temperature Shifts At Blue Hill, MA
- CO2²
- Time Of Observation Bias
- Climate Scamming For Profit
- Climate Scamming For Profit
- Back To The Future
March 2026 M T W T F S S 1 2 3 4 5 6 7 8 9 10 11 12 13 14 15 16 17 18 19 20 21 22 23 24 25 26 27 28 29 30 31 Recent Comments
- Bob G on Analyzing The Western Water Crisis
- Gordon Vigurs on Analyzing The Western Water Crisis
- Bob G on Analyzing The Western Water Crisis
- Bob G on Analyzing The Western Water Crisis
- Bob G on Analyzing The Western Water Crisis
- Mike Peinsipp on Analyzing The Western Water Crisis
- Bob G on Analyzing The Western Water Crisis
- Bob G on Analyzing The Western Water Crisis
- Robertvd on Analyzing The Western Water Crisis
- Bob G on Analyzing The Western Water Crisis
Biden To Eliminate Carbon Soon
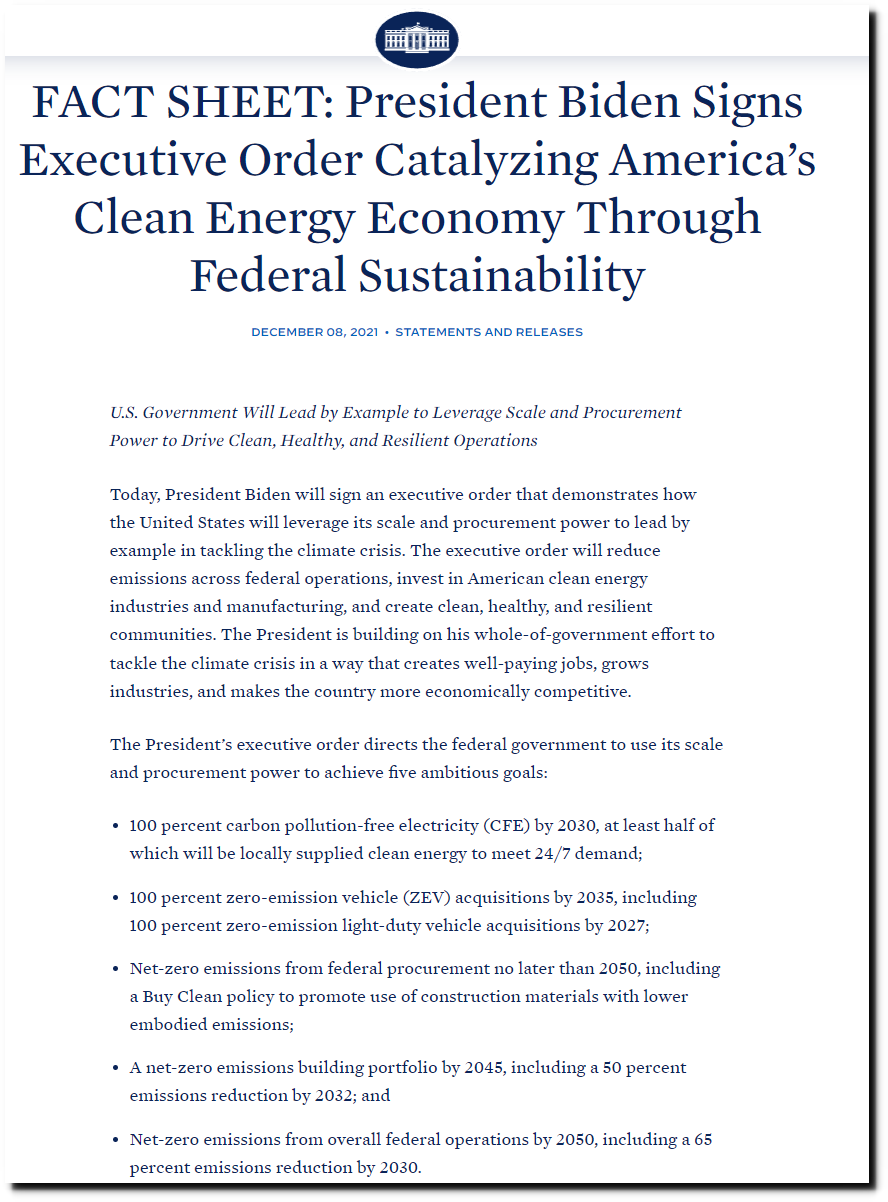
This comes two weeks after he drained the US petroleum reserve in order to increase the supply of oil.
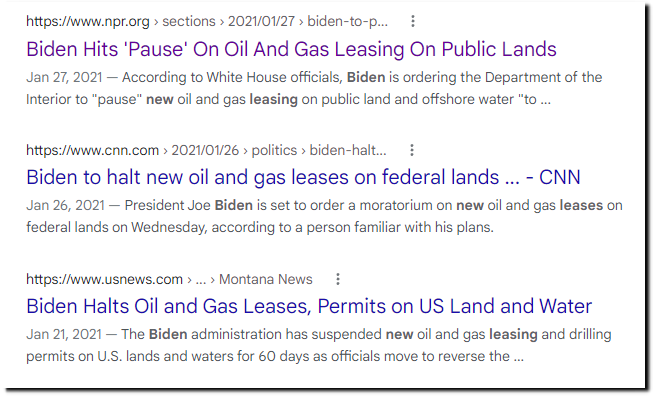
And that came ten months after he banned new oil and gas leases in order to reduce the supply of oil.
Posted in Uncategorized
Leave a comment
Arctic Ice Maps
Russian observational map.
FGBU AANII :: Operational data :: Observation ice maps of the Arctic Ocean
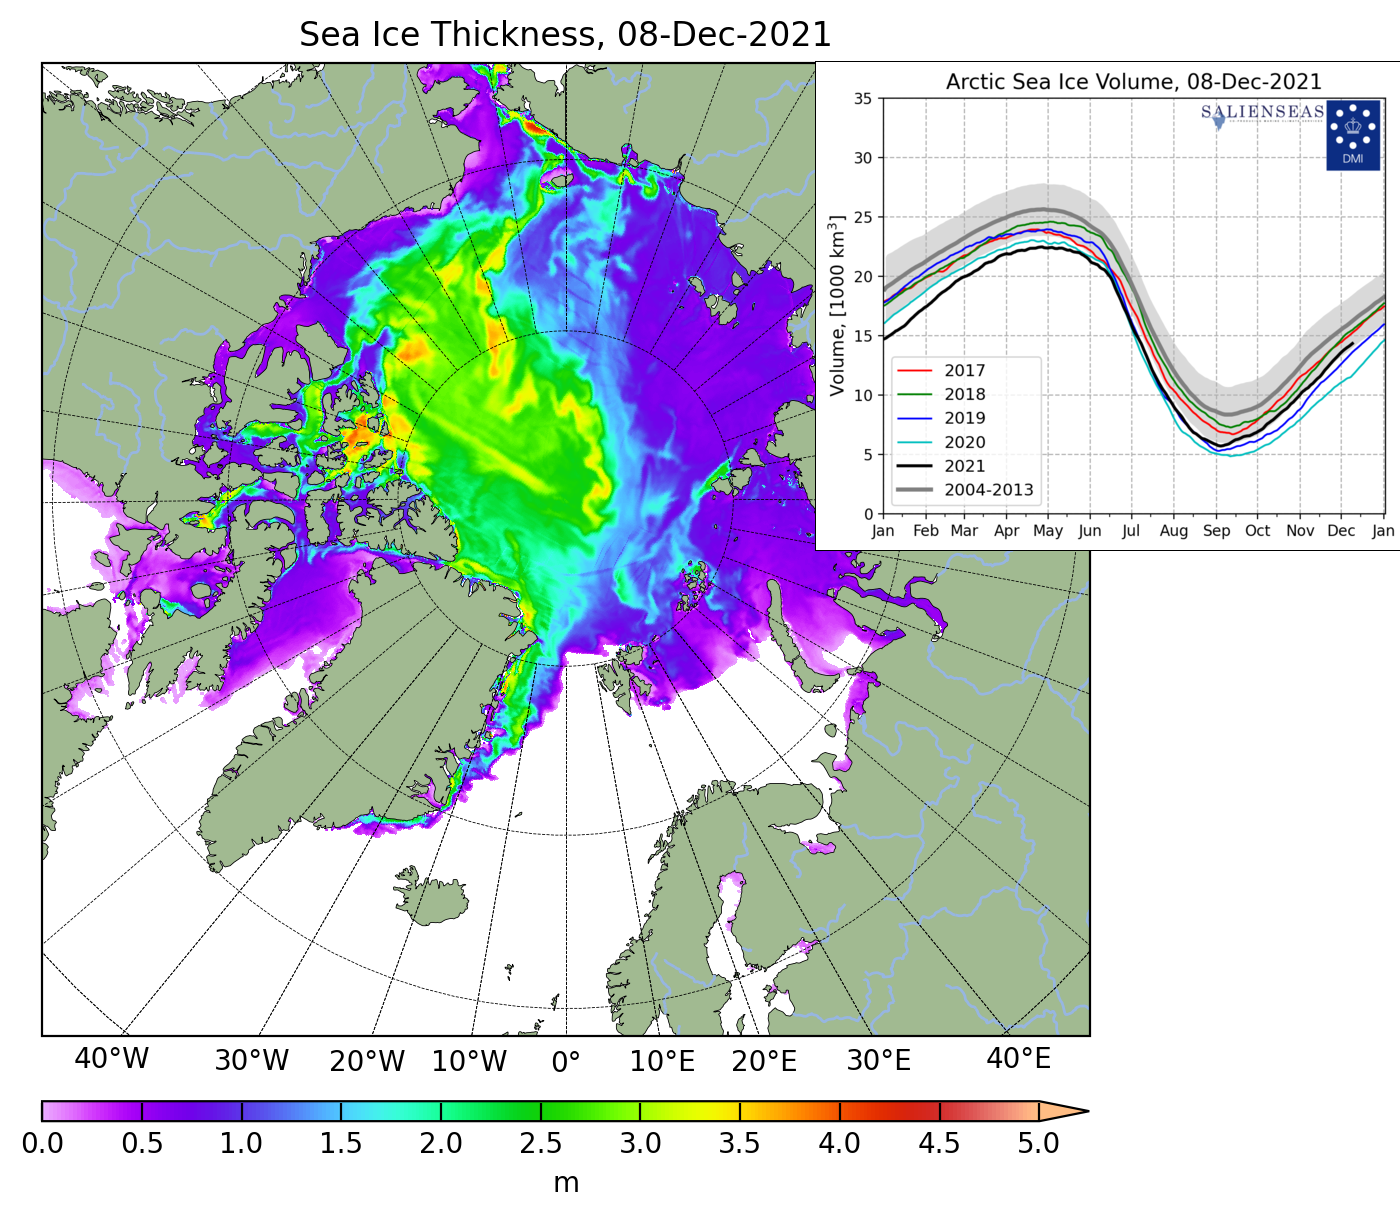
New Danish model map.
Posted in Uncategorized
Leave a comment
The DMI “Improved Model”
DMI’s explanation for why the altered the data. They claim the new model doesn’t change the relative positioning between years and primarily affects melt season volume.
“We have improved the DMI operational ocean and sea-ice model HYCOM-CICE with higher horizontal resolution and updated HYCOM and CICE code. In particular, the sea ice code has been greatly improved with meltponds, sea-ice salinity, improved thermodynamics and much more.
The freshwater discharge from Greenland has also been greatly improved using freshwater product from GEUS, which especially improves the coastal ocean currents and thus the ice transport nearshore Greenland. The model has been running continuously since September 1990.
The model has been running continuously since September 1990. Therefore, we have by December 07, 2021 updated the graphics of sea-ice thickness and volume using the new and improved data on Polarportal and ocean.dmi.dk.
The improved model setup has led to higher variability as well as less adrupt melting during the melt season, which gives a shift of approximately half a month for the time of minimum ice volume. The trend between the years is almost unchanged. Thereby, a year with a large sea-ice volume in the old setup also has a large volume in the new setup, and similar for years with low sea-ice volume.”
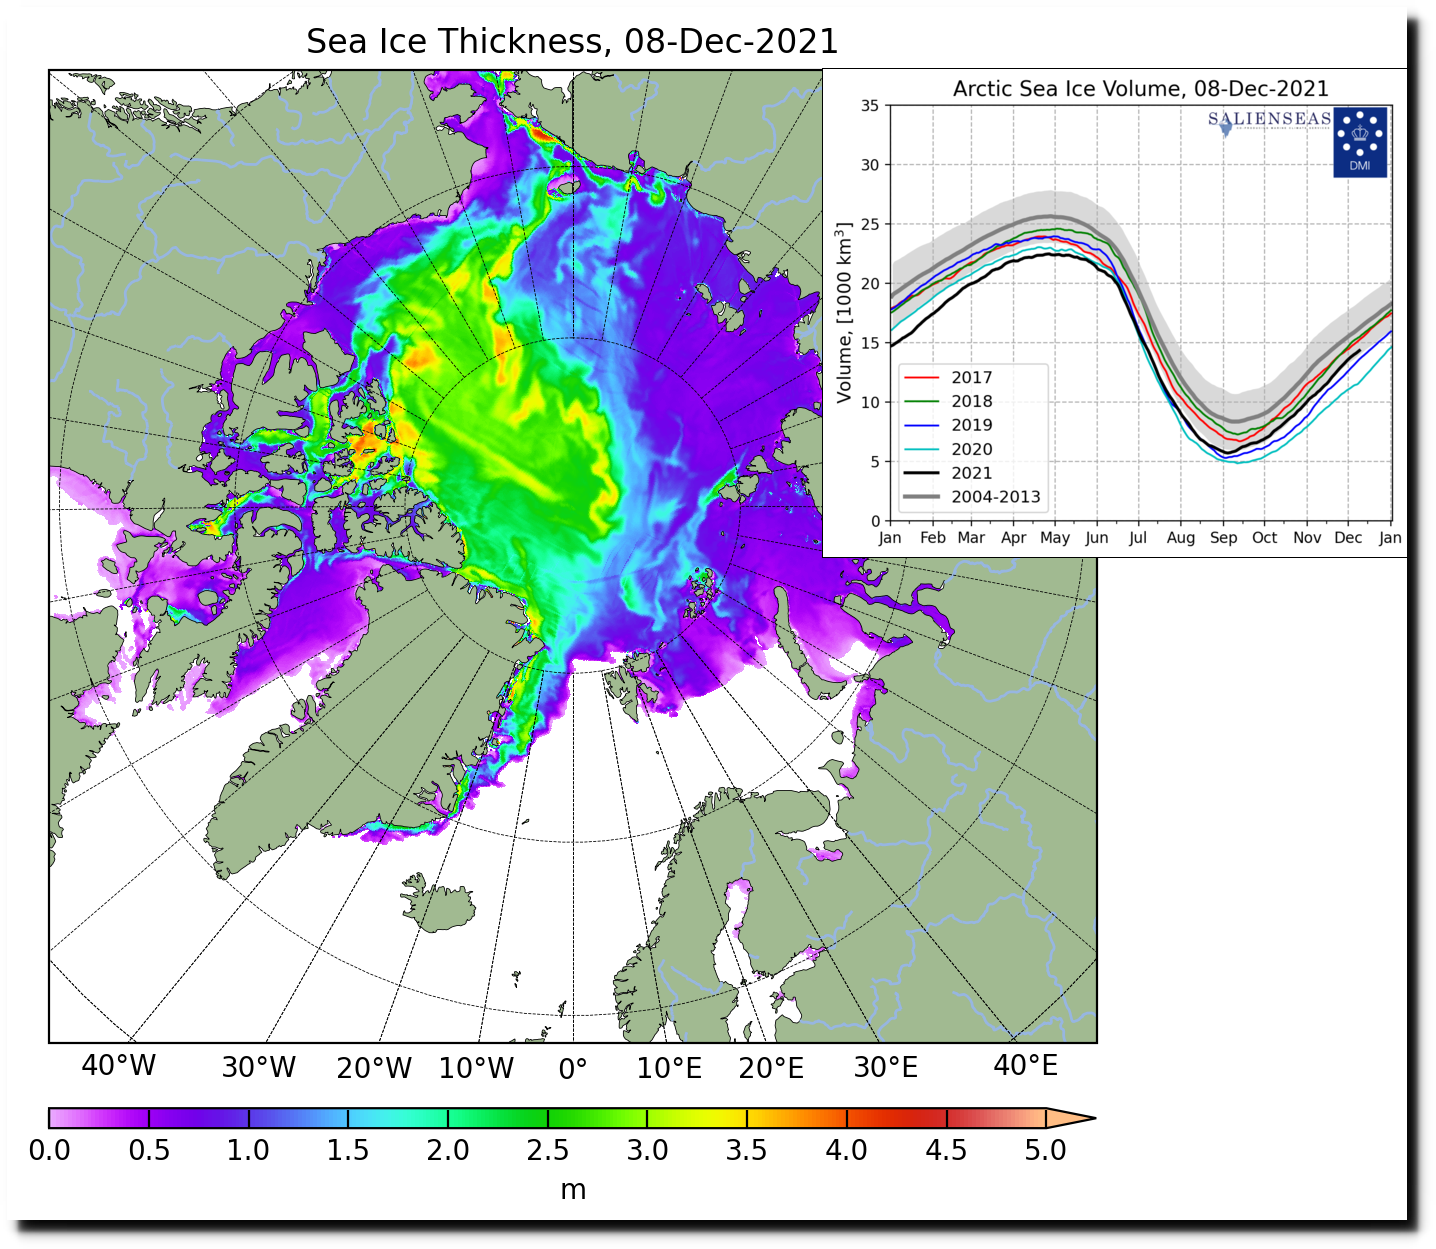
The “new and improved” version put 2021 below the 2004-2013 mean, below 2017 and below 2018. The two years which saw a large reduction in December volume were 2020 and 2021. There aren’t any melt ponds in December. The 2004-2013 mean, and 2017, 2018, 2019 didn’t change significantly – but 2020 and 2021 dropped sharply.
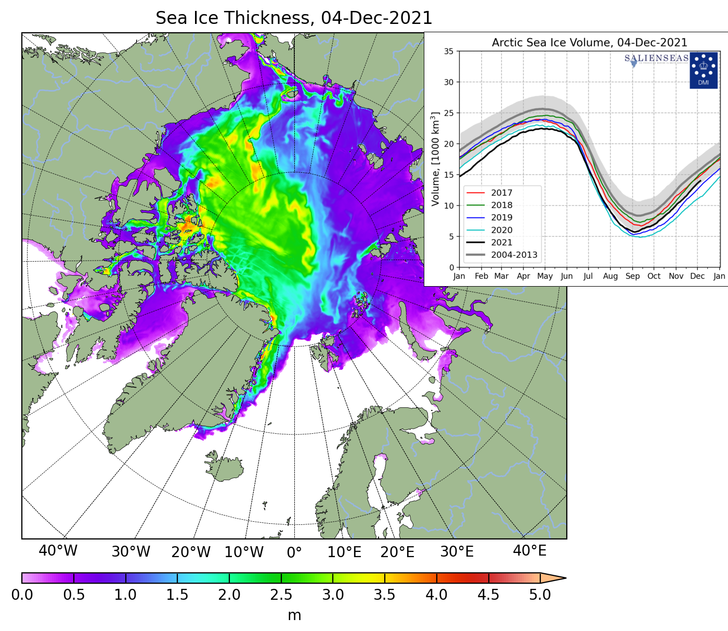
CICE_combine_thick_SM_EN_20211204.png (728×631)
FullSize_CICE_combine_thick_SM_EN_20211204.png
There was very little change to the 2021 summer volume, but lots of change to the winter volume. The is the opposite of other years and the opposite of their description of the changes.
The changes they made occurred during winter, not summer. It appears they rotated the 2021 data several degrees clockwise, which brought spring volume up and winter volume down.
The sailors are trapped in the ice because of an early freeze up, and DMI has altered the data to show the exact opposite.
The 2017 data is rotated counter-clockwise in the new version, but the 2021 data is rotated the other direction. Their changes aren’t credible and are a complete mess.
Posted in Uncategorized
Leave a comment
CNN Announces The End Of Golf
Golf courses are destroying the planet. They are going to turn into bone-dry muddy swaps due to climate change.
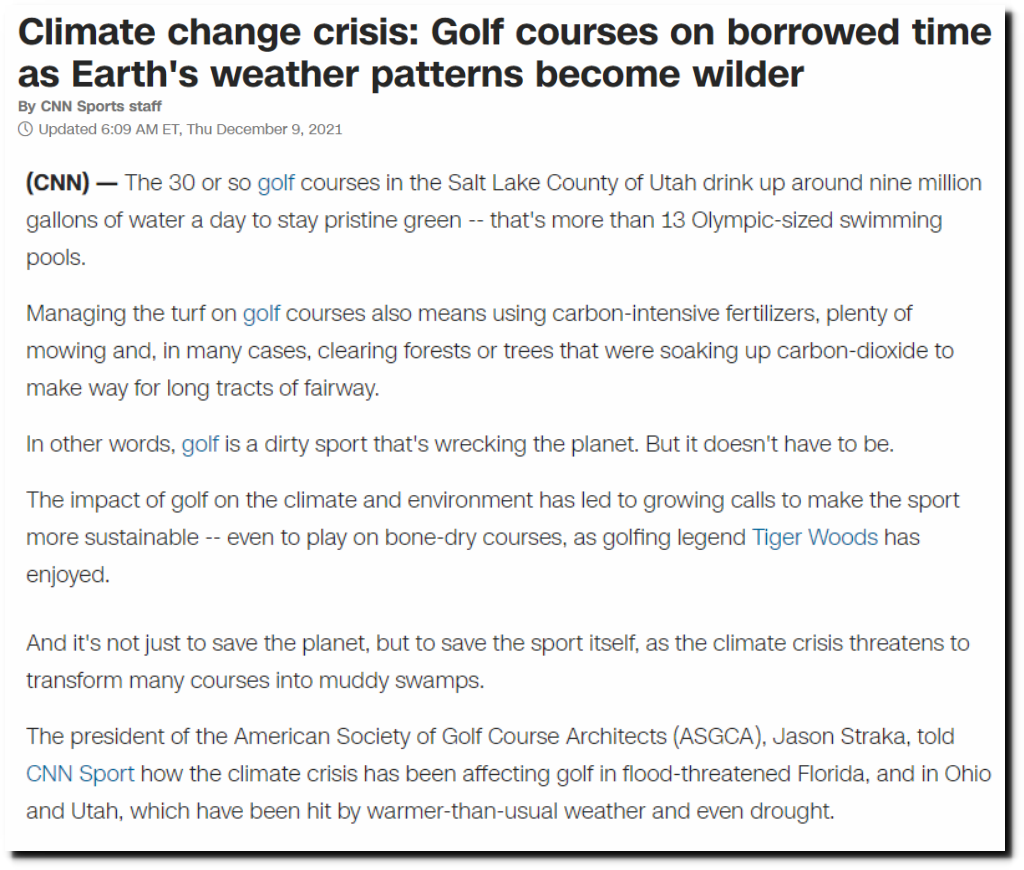
Climate crisis: Golf courses on borrowed time as Earth’s weather patterns become more wild – CNN
Posted in Uncategorized
Leave a comment
Climate Spawns Critters
Berkeley experts say there are too many coyotes in town due to fires caused by climate change.
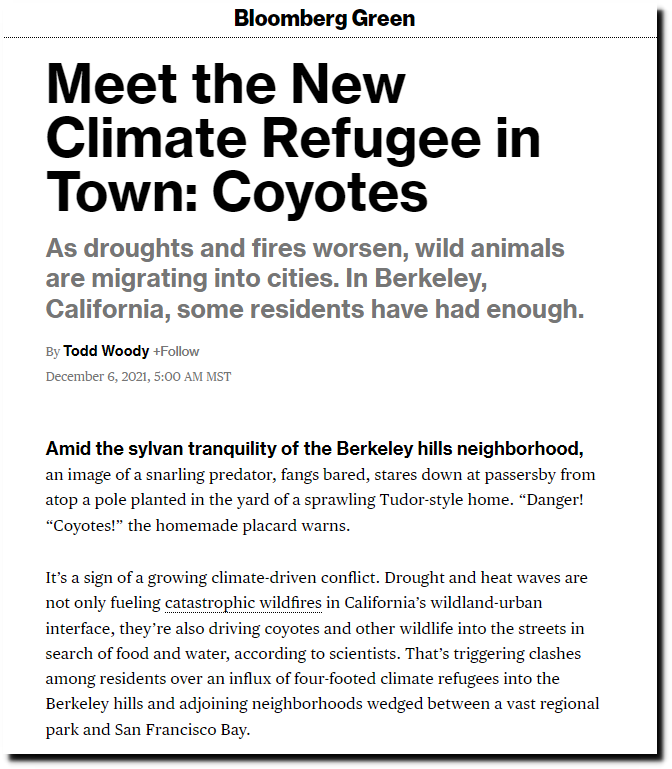
Effects of Climate Change: How Global Warming Forces Wildlife into Cities – Bloomberg
Sixty years ago, Berkeley experts said there were too few coyotes in town because of hunting, trapping and poisons.
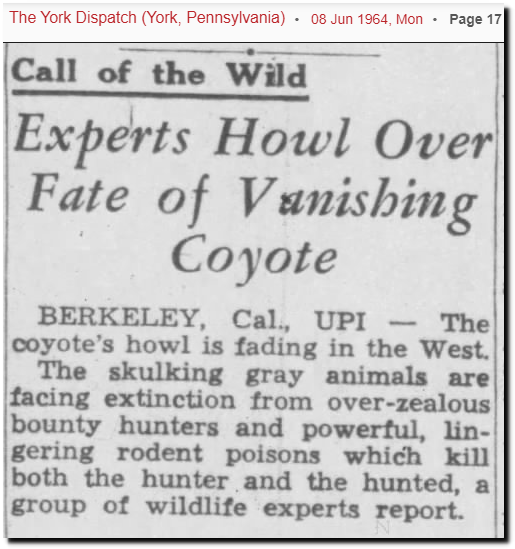
08 Jun 1964, 17 – The York Dispatch at Newspapers.com
On this date in 1943, there were catastrophic fires in Berkeley – apparently not caused by climate change.
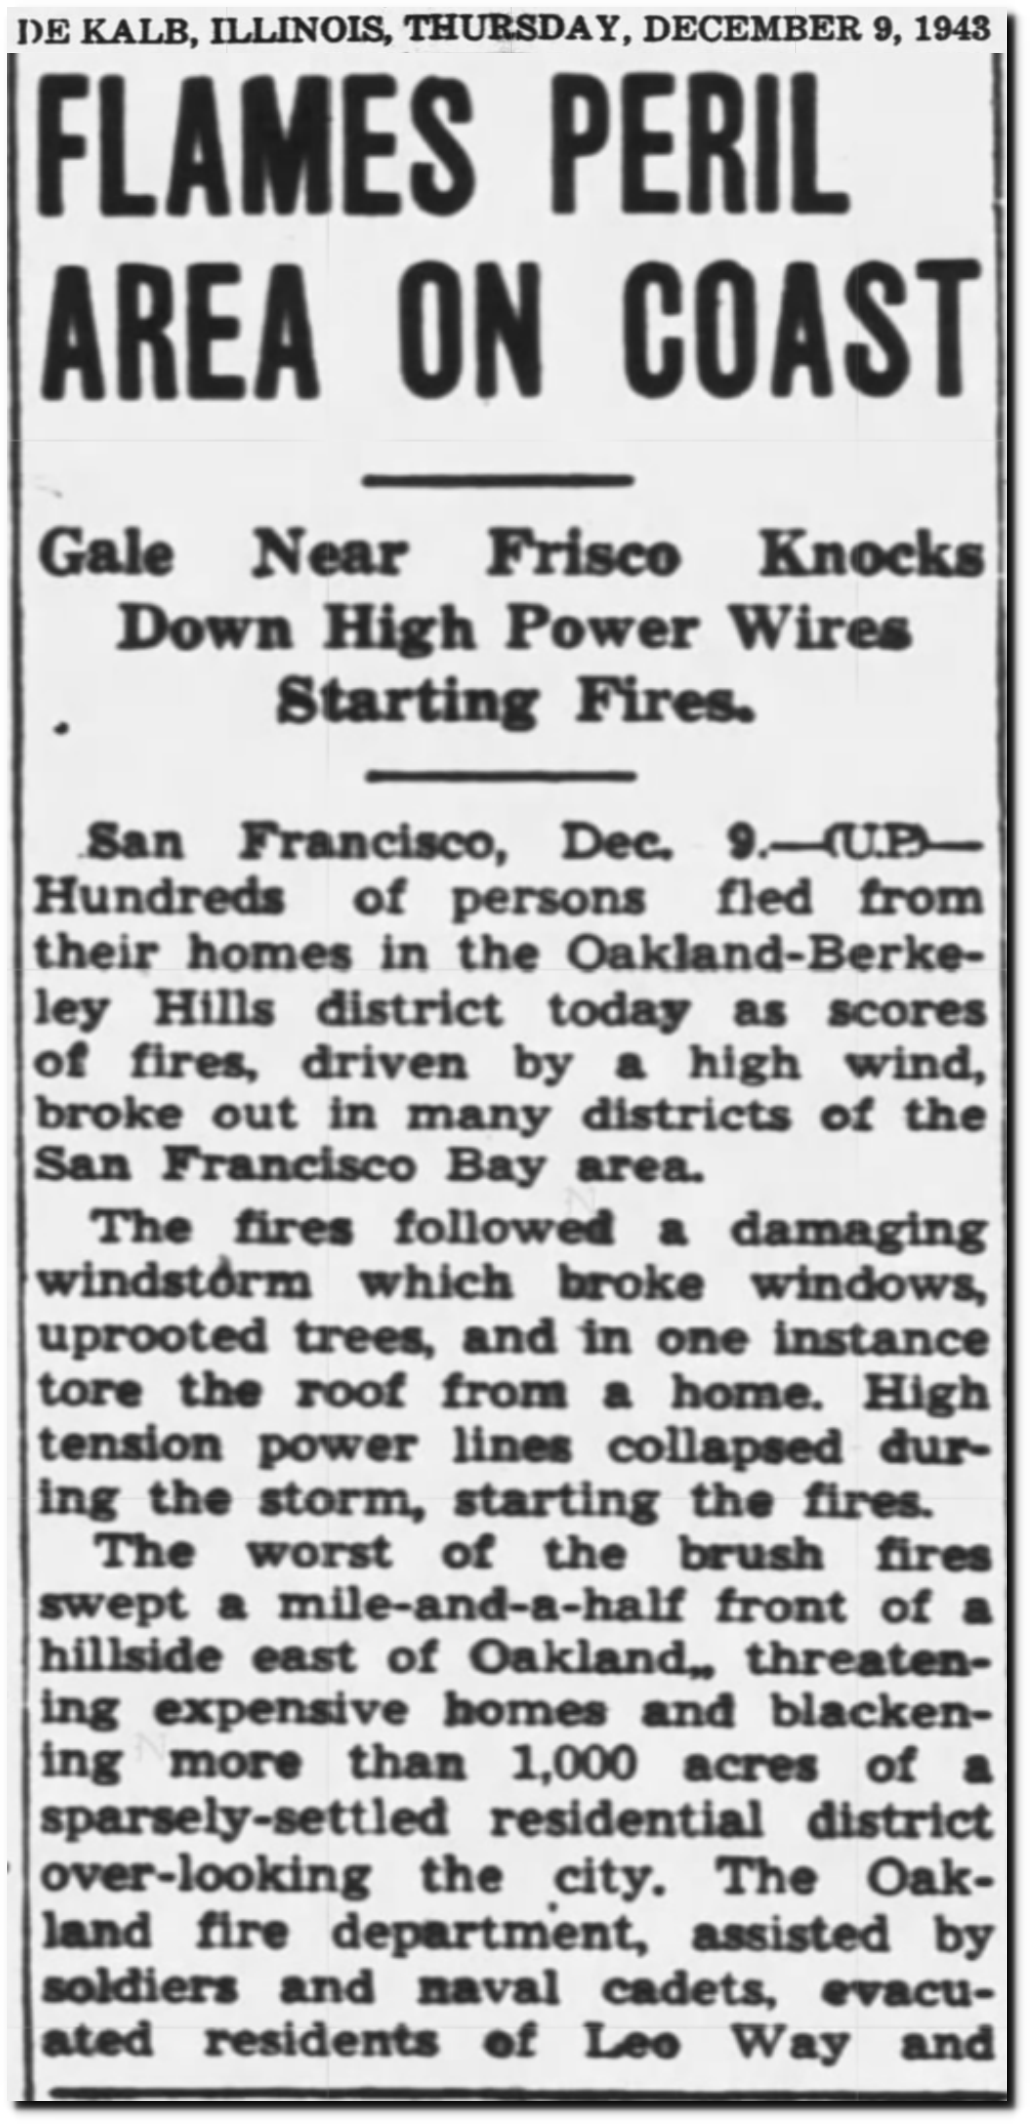
09 Dec 1943, Page 1 – The Daily Chronicle at Newspapers.com
h/t Don Penim
And today the New York Times reports there are too many bison in Yellowstone.
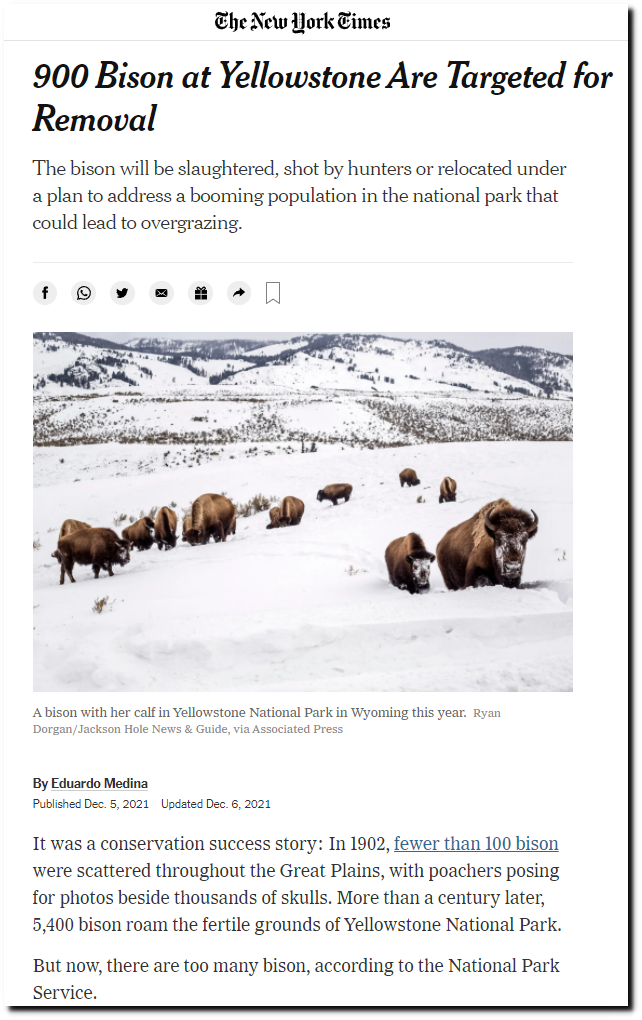
900 Bison at Yellowstone Are Targeted for Removal – The New York Times
The extinction rebellion is difficult to keep up with.
Posted in Uncategorized
Leave a comment