Past NSIDC Data Tampering

This is a repost originally made five years ago.

—————————————

In 2012, I caught NSIDC cheating, just as Arctic sea ice extent was about to cross above the 1979-2000 average. They changed their measurement system using a completely bogus mathematical trick. NSIDC argued with me about it for a while, and eventually admitted that their nature trick was garbage.

NSIDCsNatureTrick

NSIDC’s 2012 Nature Trick | Real Science

They have done a much bigger cheat this time, in order to generate this propaganda:

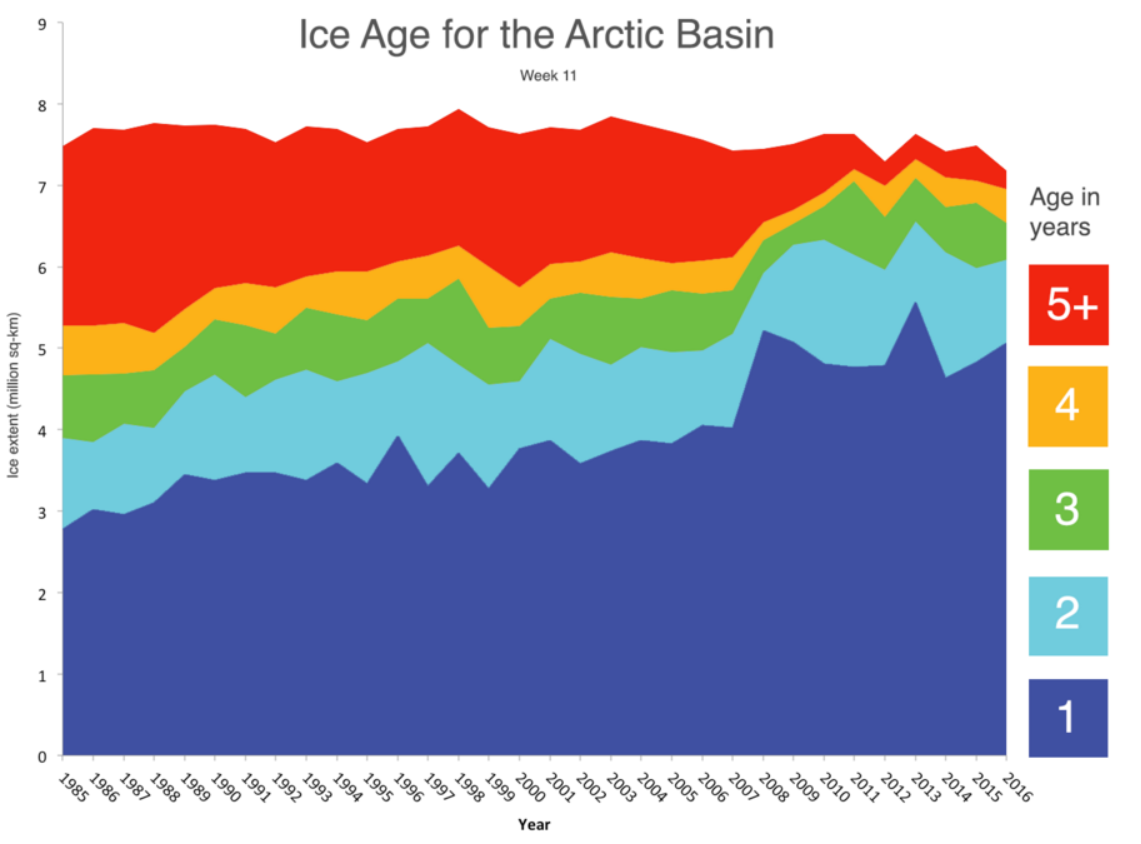
ice at least 5 years or older, is at its smallest level in the satellite record, representing only 3 percent of the total ice cover

2016-04-22061634

March ends a most interesting winter | Arctic Sea Ice News and Analysis

From week 1 1984 to week 37, 2015 NSIDC generated ice age maps in this format:

PaintImage160

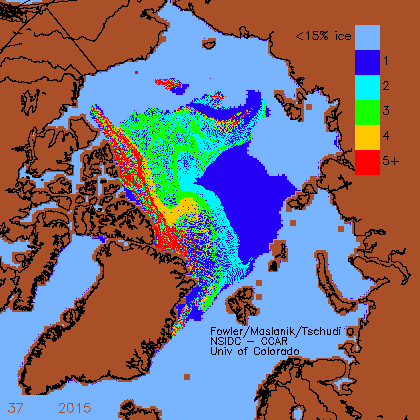
ftp://ccar.colorado.edu/pub/tschudi/iceage/gifs/

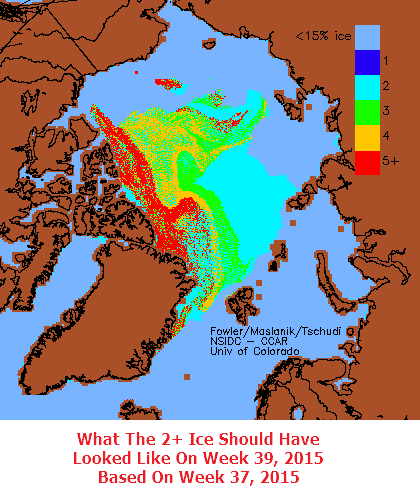
Week 38 (late September) is the week when the ice has its birthday, and all of the ice advances one year. I generated the map below of what week 38 should have looked like, based on advancing the ice age one year. There should have been a large increase in 5+ ice, because all of the 4 year old ice became five year old ice on week 38.

PaintImage162

However, that didn’t happen. What they did was change to a new set of maps on week 39, and actually deleted the directory containing the 1984-2015 maps.  They never generated a week 38 map. Very naughty.

iceage_browse_week_n_2015_39

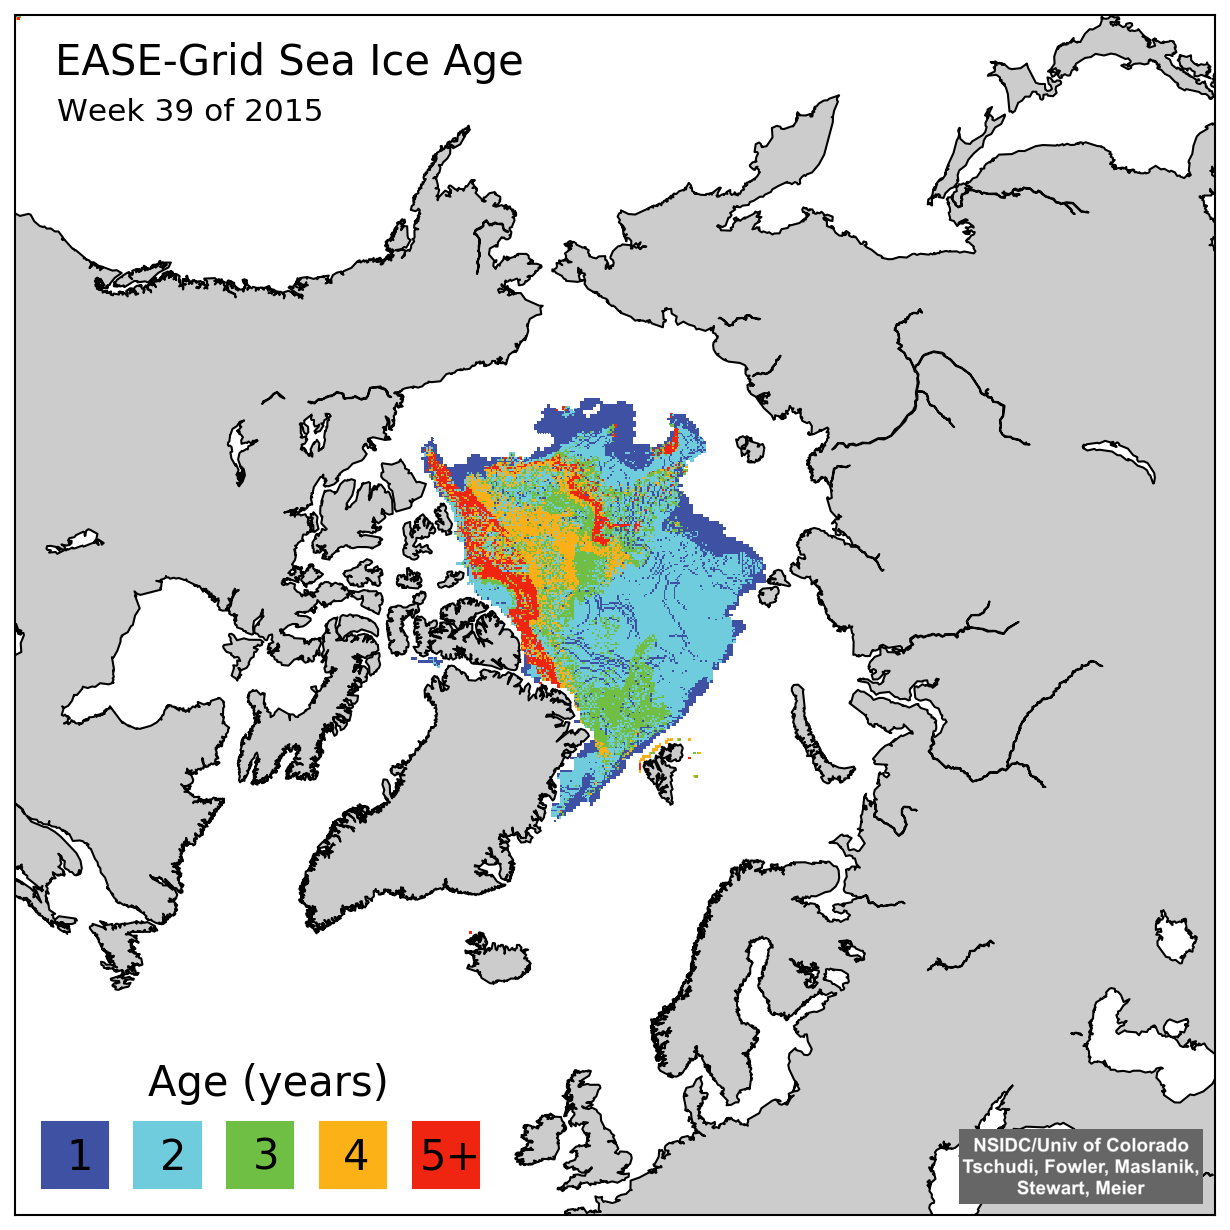
iceage_browse_week_n_2015_39.png (1230×1230)

A large area of four year old ice not only didn’t age, but it disappeared entirely.

PaintImage160

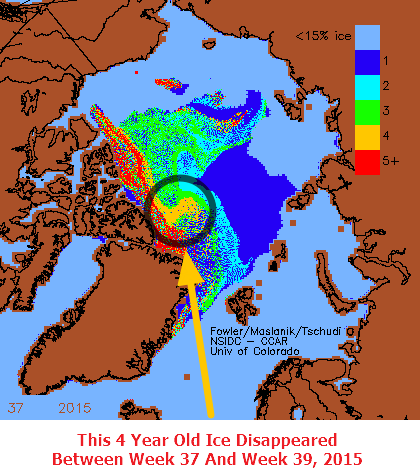
The animation below shows what the map should have looked like compared to what it does look like. They massively reduced the amount of five year old ice that should have been present in the map.

NSIDC-week37-2015-vs-week-39-2015

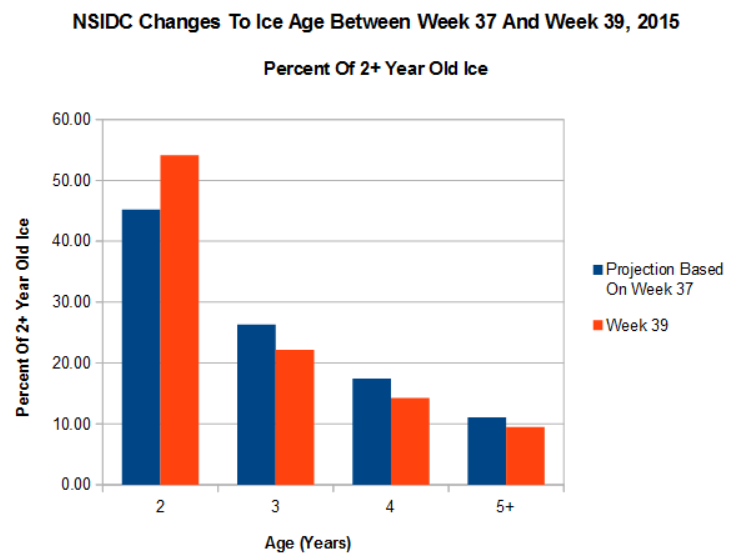
The graph below shows the sum total of they did. When they switched maps, they decreased the amount of 3, 4 and 5+ year old ice, and increased the amount of two year old ice.

2016-04-22070659

Not only did they they alter the data, but they also deleted the evidence. And to make matters worse, they blocked auto archiving of the 1984-2015 data.

2016-04-22065408

The data is not lost however. I have all their old maps archived here. Did they really think I wasn’t going to catch them?

Posted in Uncategorized | Leave a comment

Twitter News December 7, 2021

Is it strong enough to survive a one part per ten thousand increase in CO2 over the past century?

11:18 AM · Dec 7, 2021

Posted in Uncategorized | Leave a comment

1904 : When Scientific American Still Did Science

Scientific American – Google Books

Posted in Uncategorized | Leave a comment

The Miracle Virus

Flu normally kills hundreds of children per year in the US, but there have been no pediatric deaths from flu since the start of the plandemic.

Influenza-associated Pediatric Mortality

Pediatric deaths from COVID-19 make up 0% of US deaths.

CDC COVID Data Tracker

Most COVID-19 hospitalizations in all age groups have occurred since the vaccine was introduced.

CDC COVID Data Tracker

Posted in Uncategorized | Leave a comment

Rapidly Disappearing Arctic Ice

On December 4, DMI showed Arctic sea ice volume above the 2004-2013 average.

Wayback Machine

I tweeted about this and copied BBC News, CNN, NPR and the New York Times.

7:21 AM · Dec 5, 2021

Quite predictably, the data disappeared for three days, and now that it has returned, DMI has massively reduced the amount of sea ice in the Arctic. Much of the thick ice off the coast of Siberia has disappeared.

CICE_combine_thick_SM_EN_20211204.png (728×631)

Presumably their data tampering has freed the Russian ships trapped in the ice.

Posted in Uncategorized | Leave a comment

Rapidly Disappearing Ice

Posted in Uncategorized | Leave a comment

Biden’s Climate Progress

Gas prices are up 60% since last year’s pretend election.

Gas Station Price Charts – Local & National Historical Average Trends – GasBuddy.com

Coal stockpiles are at a record low.

US Coal Stockpiles Hit Record Low

Atmospheric CO2 continues the same trajectory it was on before governments began to pretend they were doing something to restrict it.

Global Monitoring Laboratory – Carbon Cycle Greenhouse Gases

Posted in Uncategorized | Leave a comment

Safe And Effective

5.3.6-postmarketing-experience.pdf

Highly effective against Omicron.

9:43 AM · Dec 8, 2021

Doesn’t work against Omicron.

1:12 AM · Dec 8, 2021

Posted in Uncategorized | Leave a comment

CO2 Coalition’s Latest Members

About – CO2 Coalition

Posted in Uncategorized | Leave a comment

Twitter News December 8, 2021

Mathematics is racist.

12:24 PM · Dec 7, 2021

Posted in Uncategorized | Leave a comment