
Disrupting the Borg is expensive and time consuming!

Google Search
-
Recent Posts
- Analyzing The Western Water Crisis
- Gaslighting 1924
- “Why Do You Resist?”
- Climate Attribution Model
- Fact Checking NASA
- Fact Checking Grok
- Fact Checking The New York Times
- New Visitech Features
- Ice-Free Arctic By 2014
- Debt-Free US Treasury Forecast
- Analyzing Big City Crime (Part 2)
- Analyzing Big City Crime
- UK Migration Caused By Global Warming
- Climate Attribution In Greece
- “Brown: ’50 days to save world'”
- The Catastrophic Influence of Bovine Methane Emissions on Extraterrestrial Climate Patterns
- Posting On X
- Seventeen Years Of Fun
- The Importance Of Good Tools
- Temperature Shifts At Blue Hill, MA
- CO2²
- Time Of Observation Bias
- Climate Scamming For Profit
- Climate Scamming For Profit
- Back To The Future
March 2026 M T W T F S S 1 2 3 4 5 6 7 8 9 10 11 12 13 14 15 16 17 18 19 20 21 22 23 24 25 26 27 28 29 30 31 Recent Comments
- Bob G on Analyzing The Western Water Crisis
- Bob G on Analyzing The Western Water Crisis
- Bob G on Analyzing The Western Water Crisis
- Hank Phillips on Analyzing The Western Water Crisis
- Hank Phillips on Analyzing The Western Water Crisis
- Hank Phillips on Analyzing The Western Water Crisis
- Hank Phillips on Analyzing The Western Water Crisis
- Bob G on Analyzing The Western Water Crisis
- conrad ziefle on Analyzing The Western Water Crisis
- Bob G on Analyzing The Western Water Crisis
Kingman, Kansas Has Had An Obvious Cooling Trend Since 1908!
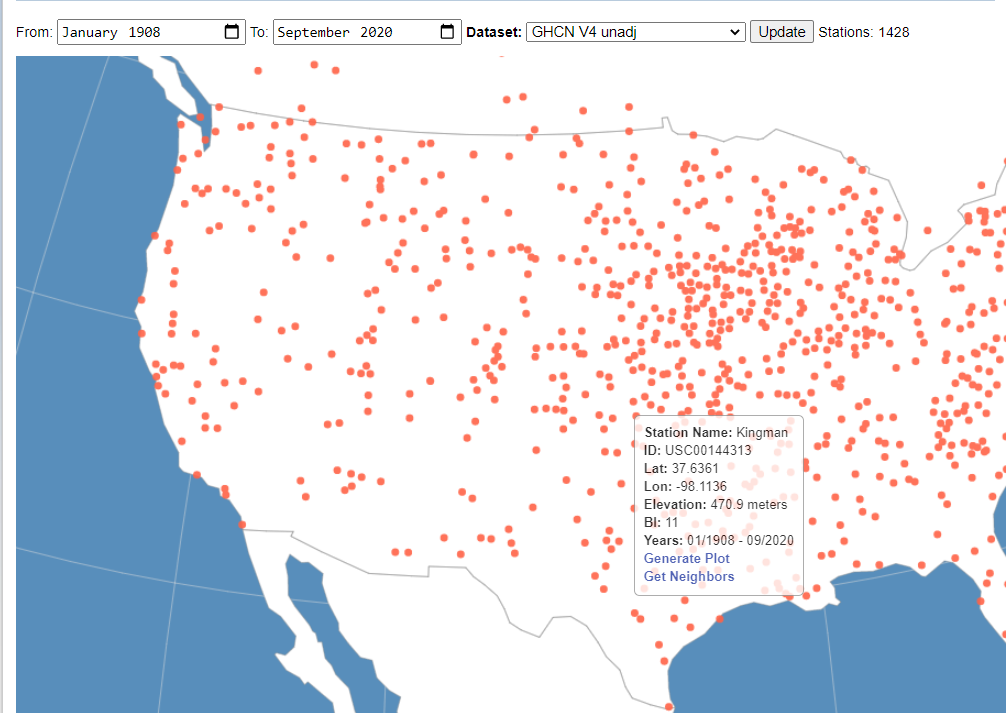
Hi, everyone.
Today, I researched the mean annual temperatures in Kingman, Kansas.
The GHCN V4 Unadjusted data from NASA website show an obvious cooling trend since 1908.
However, the GHCN V4 adj – homogenized data show that the Kingman station doesn’t have any annual temperature data from 1908 to 1952, and the station has had a warming trend.

Why do NASA do such ridiculous things?

As is well known to many people, NASA likes changing their temperature data.
Posted in Uncategorized
Leave a comment
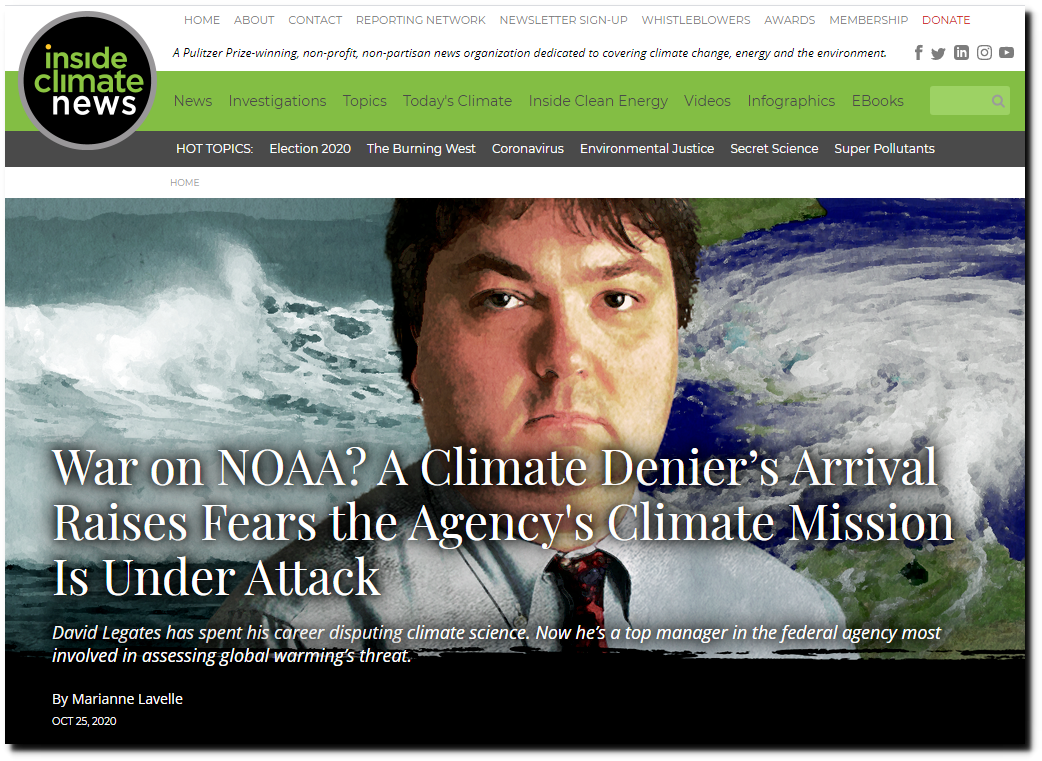
War On Science
The left is hysterical about the appointment of David LeGates to NOAA. They say the “agency’s mission is under attack.” This reminds me of six years ago when Judith Curry and Anthony Watts contronted NOAA about some of my claims of temperature manipulation, and they didn’t deny they were doing it – they simply said their “algorithm is working as designed.” So the question becomes, what is the agency’s mission?
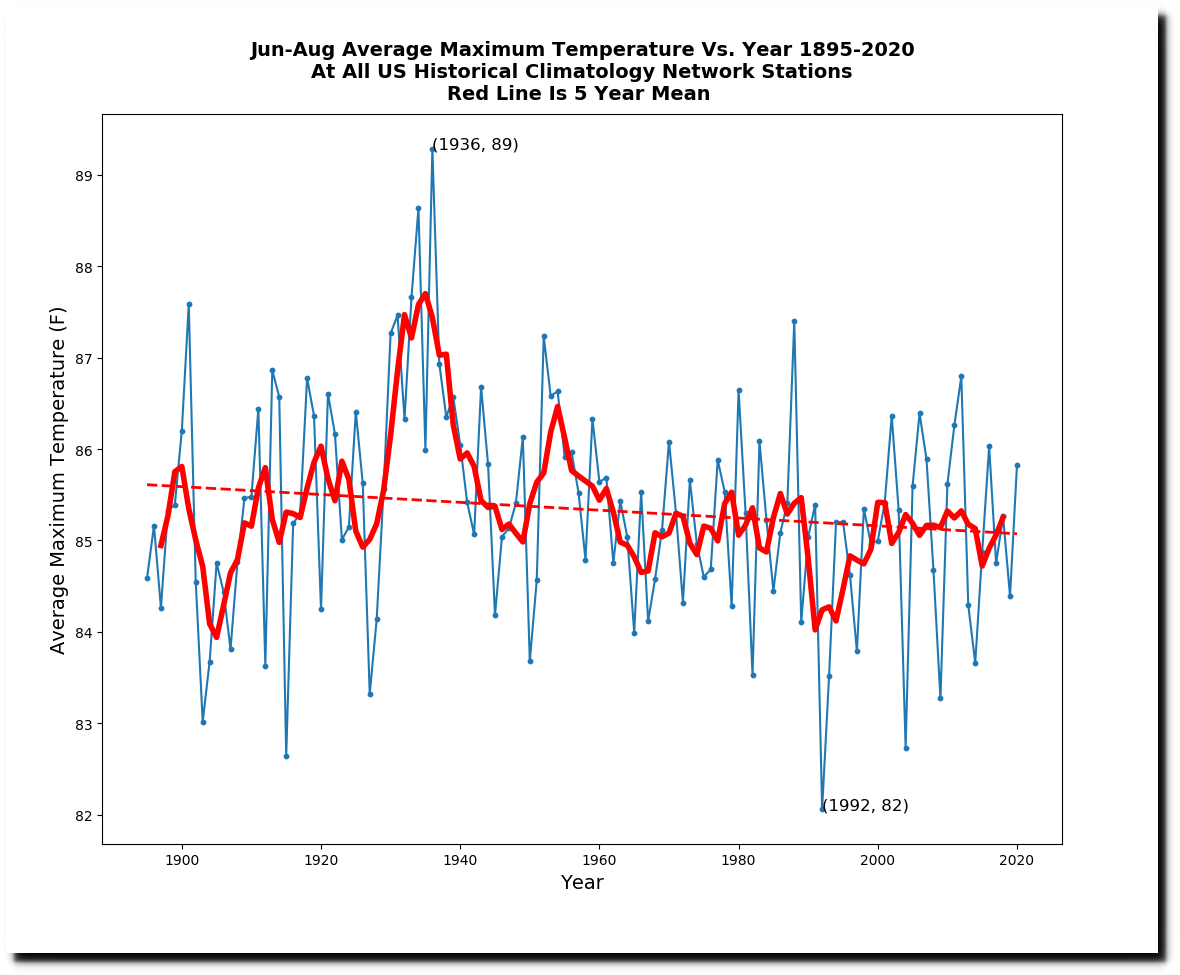
Climate alarmism depends largely on the accuracy of NOAA temperature graphs, and alarmists are afraid David LeGates will expose the fact that the graphs are not accurate portrayals of reality.
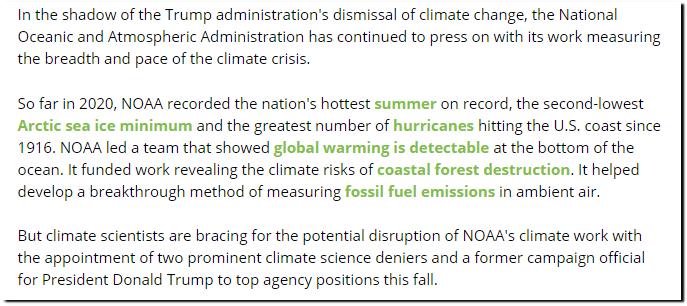
The article claims that summer 2020 was the hottest on record in the US, when in fact the measured NOAA data shows it was just about average, and three degrees cooler than 1936. Summers have been getting cooler in the US for more than 90 years.
The number of hot days was among the lowest on record.
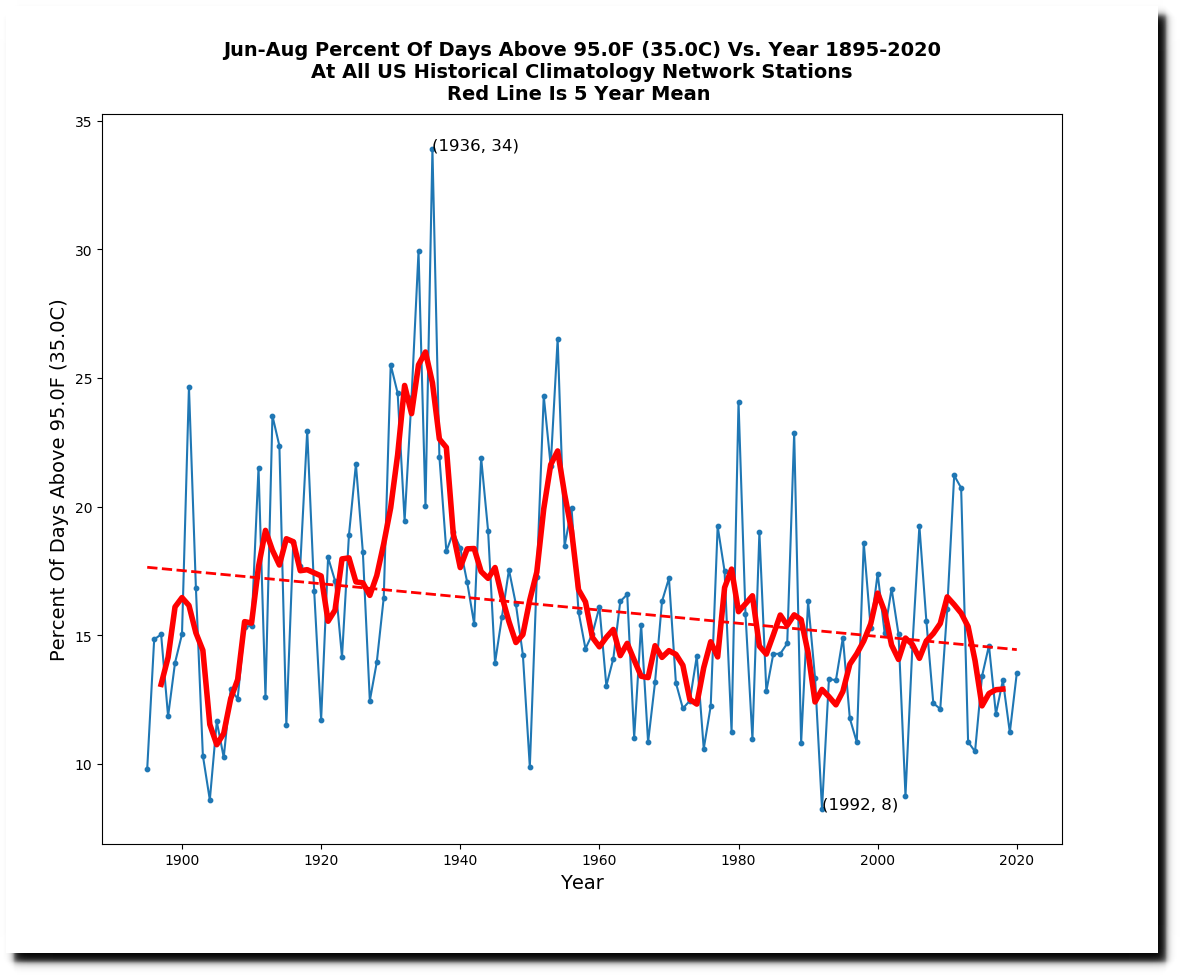
The number of warm days for the first nine months of the year has been well below average and on a declining trend.

Here In Cheyenne, Wyoming we had our coldest October afternoon on record yesterday at 9F. This was almost 50 degrees below normal, and beat the previous record by two degrees. Denver is likely to set a number of records for cold as well.
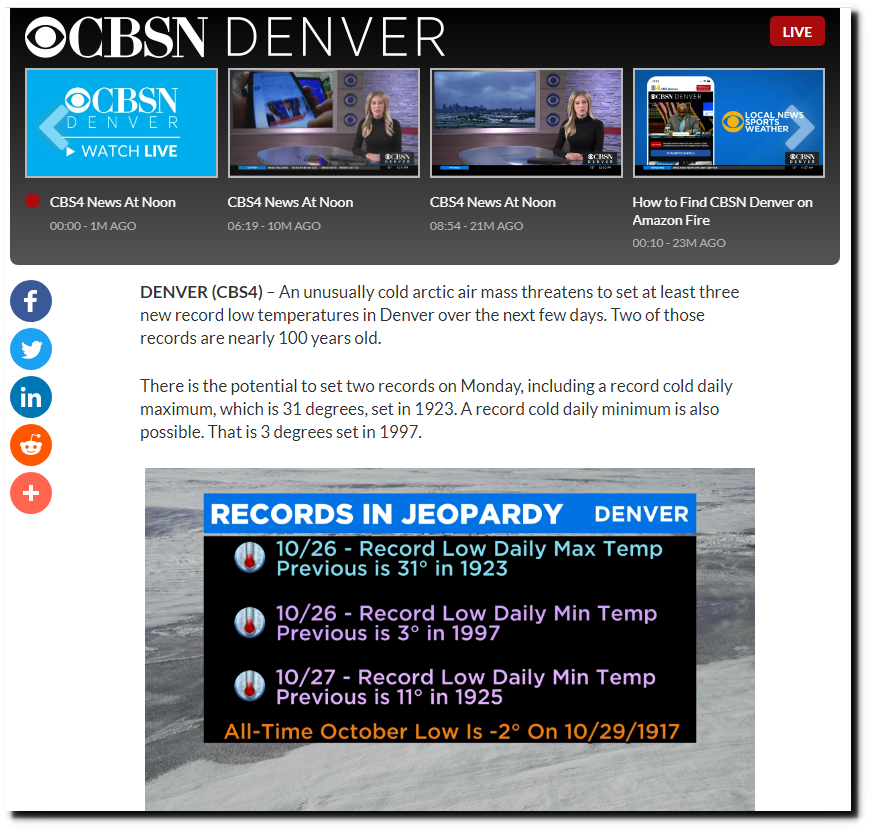
Denver Weather: Record Lows Nearly 100 Years Old May Fall By Tuesday – CBS Denver
Autumn snow cover has been increasing across the Northern Hemisphere for 50 years, as Arctic air penetrates further south and the freeze line moves closer to the equator.
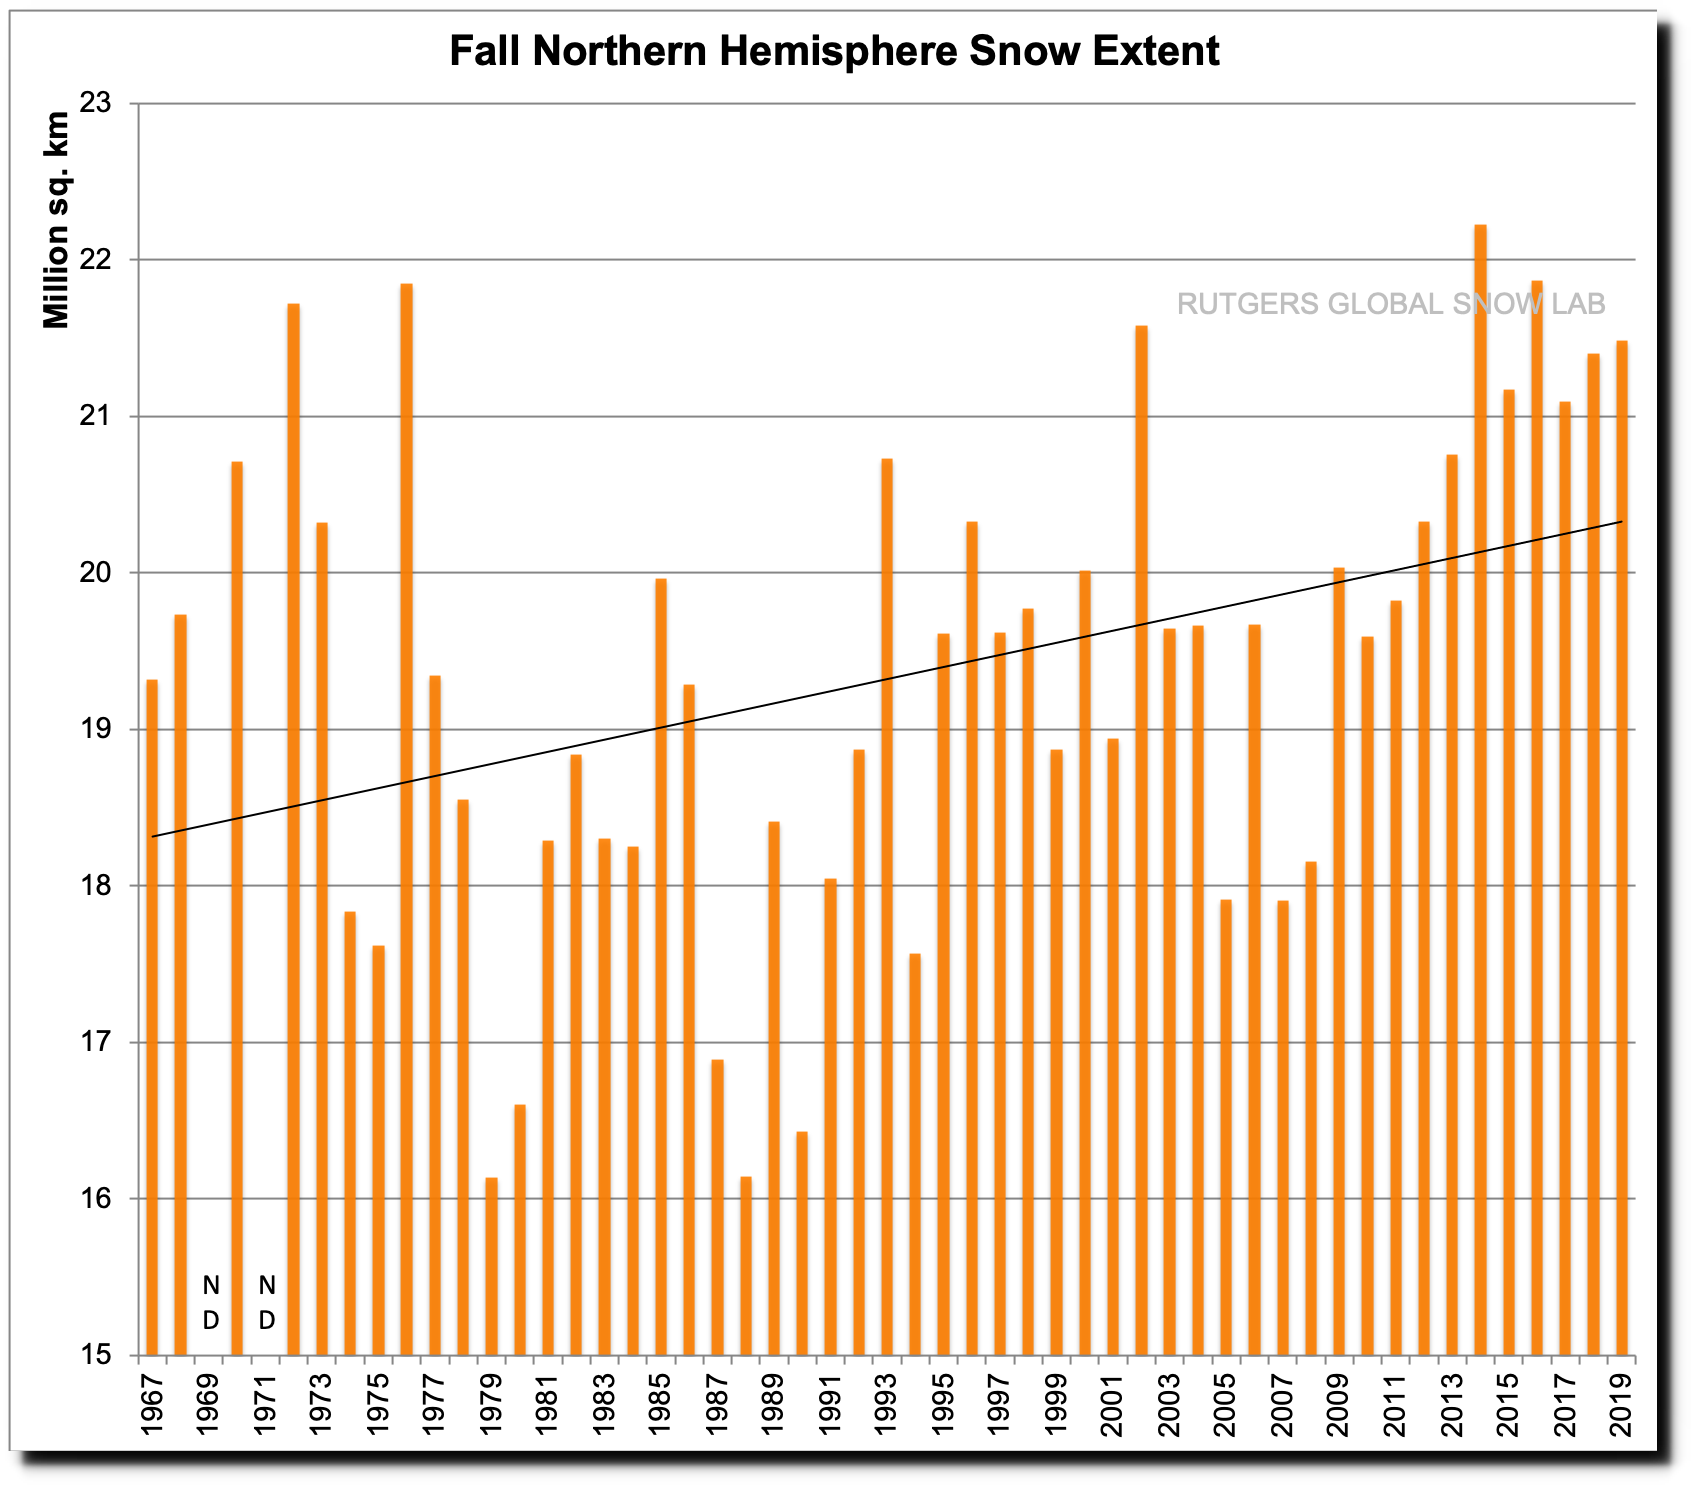
Rutgers University Climate Lab :: Global Snow Lab
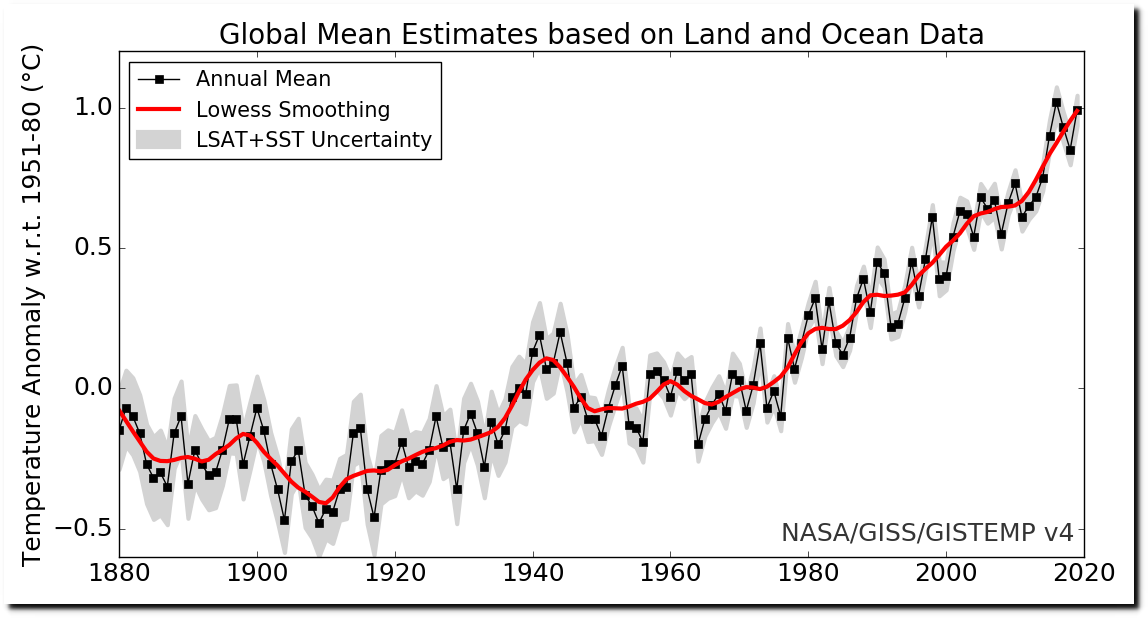
The article claimed that the US has seen the most hurricane landfalls since 1916. This isn’t true, and why would the same weather as 1916 be considered a sign of climate change? According to NASA, 1916 was one of the coldest years on record.
Hurricanes in the US peaked in 1886, and have been generally declining ever since.
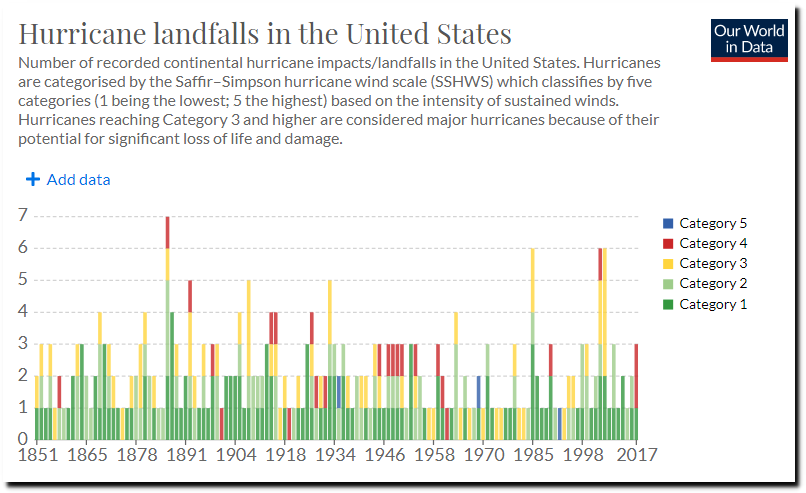
Hurricane landfalls in the United States
Four years ago there was a record lack of hurricanes.
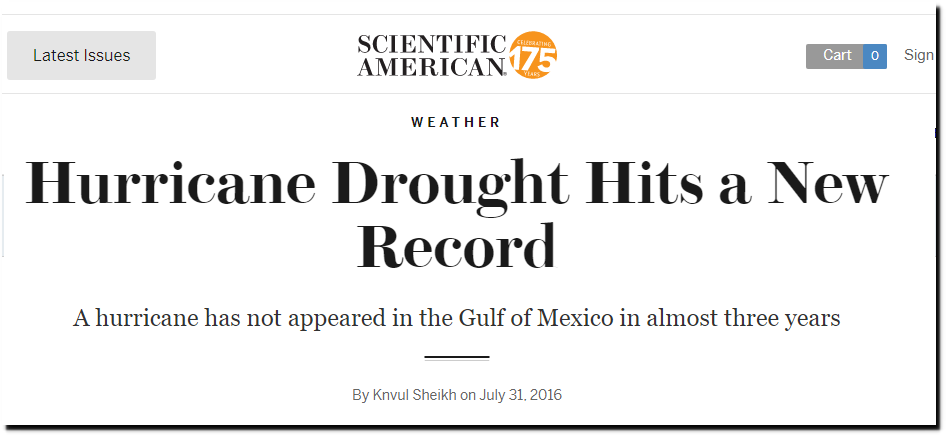
Hurricane Drought Hits a New Record – Scientific American
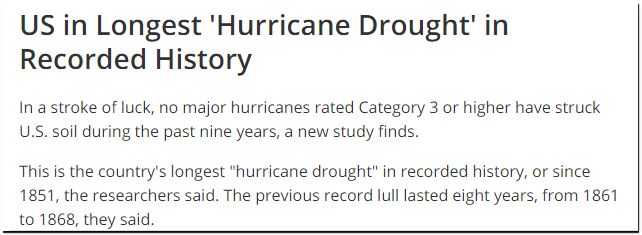
US in Longest ‘Hurricane Drought’ in Recorded History | Live Science
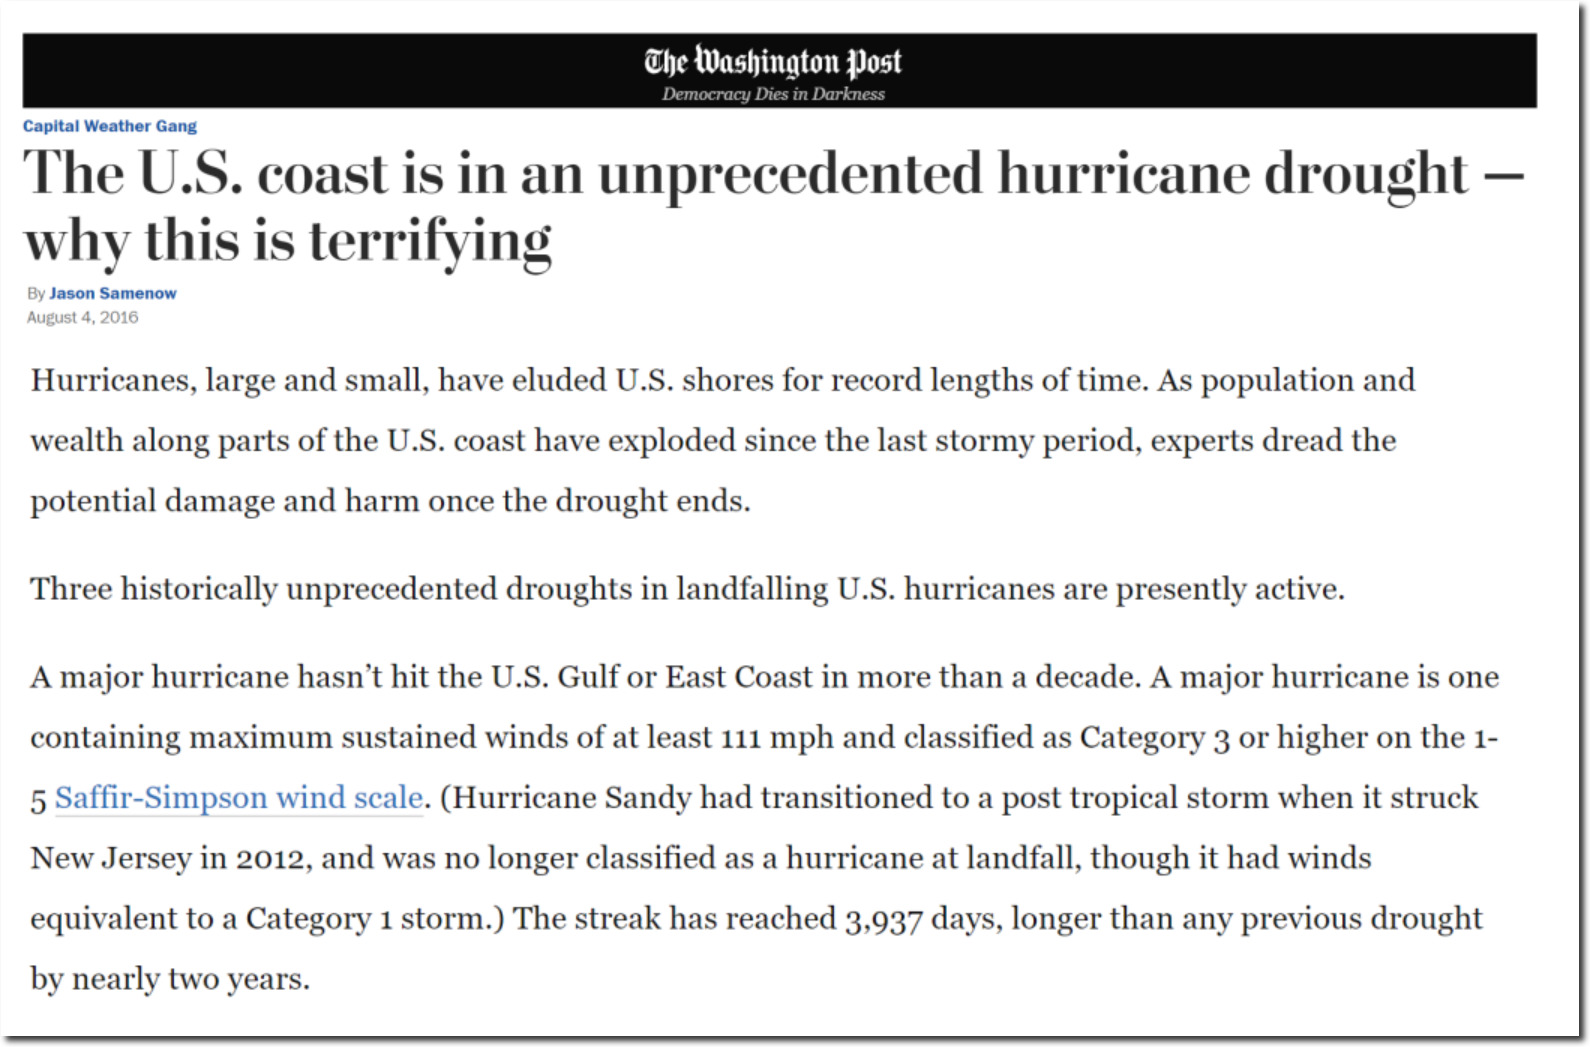
The Washington Post was terrified by the lack of hurricanes.
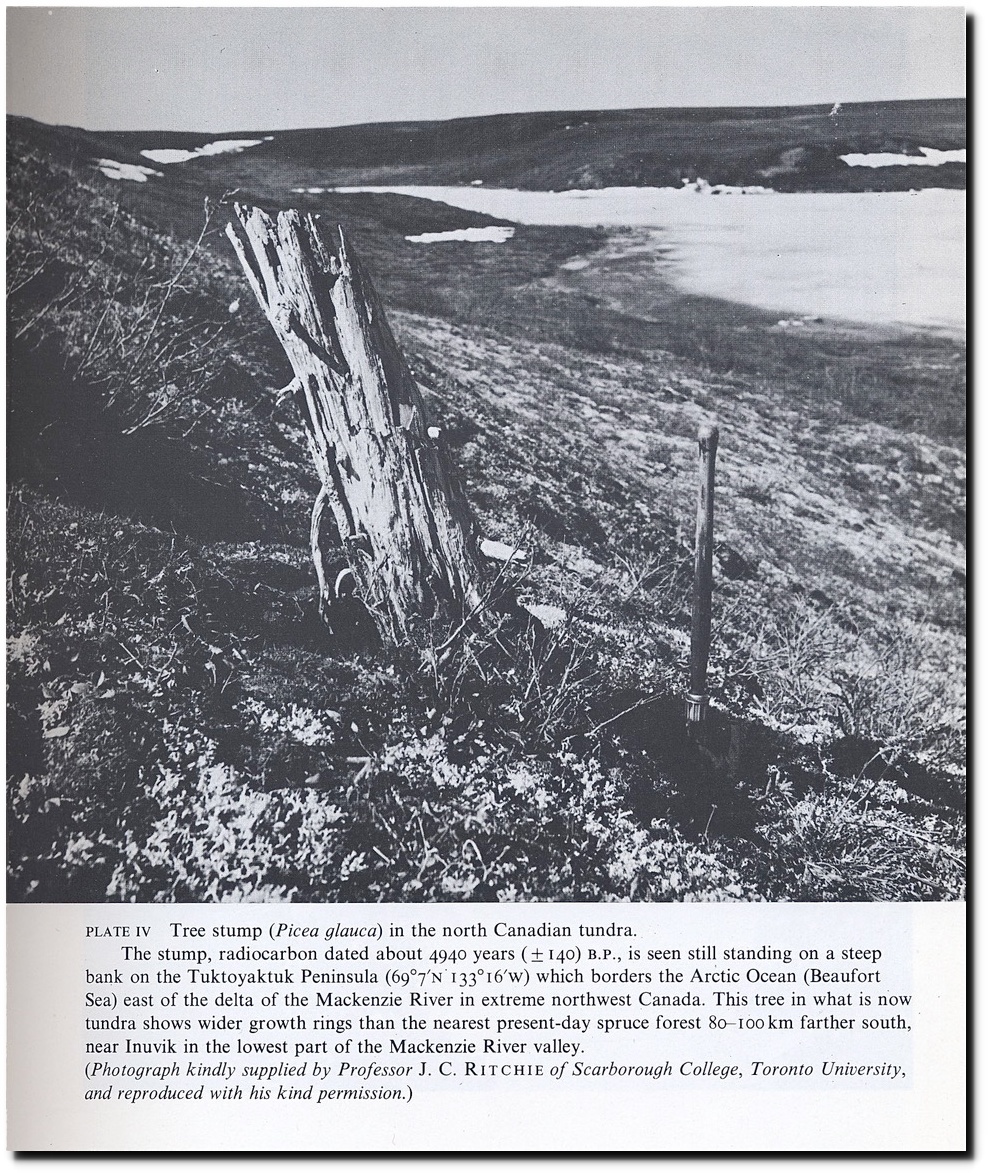
The Arctic fear mongering goers on endlessly. Six thousand years ago, the Arctic was likely ice-free, with CO2 at much lower levels
Less Ice In Arctic Ocean 6000-7000 Years Ago — ScienceDaily
Trees grew all the way to the edge of the Arctic Ocean, yet Polar Bears survived just fine.
Climate: Present, Past and Future (Routledge Revivals) – Google Books
Millions of years ago, redwood trees grew near the North Pole.
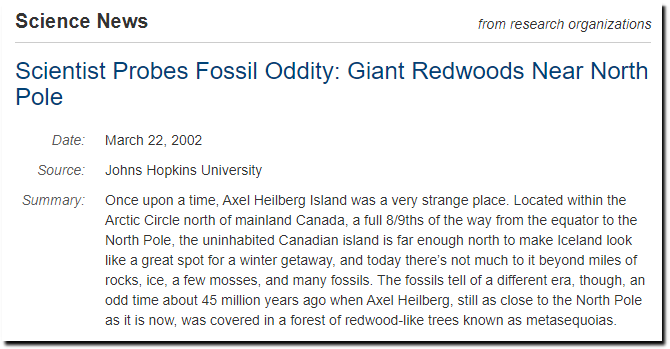
Scientist Probes Fossil Oddity: Giant Redwoods Near North Pole — ScienceDaily
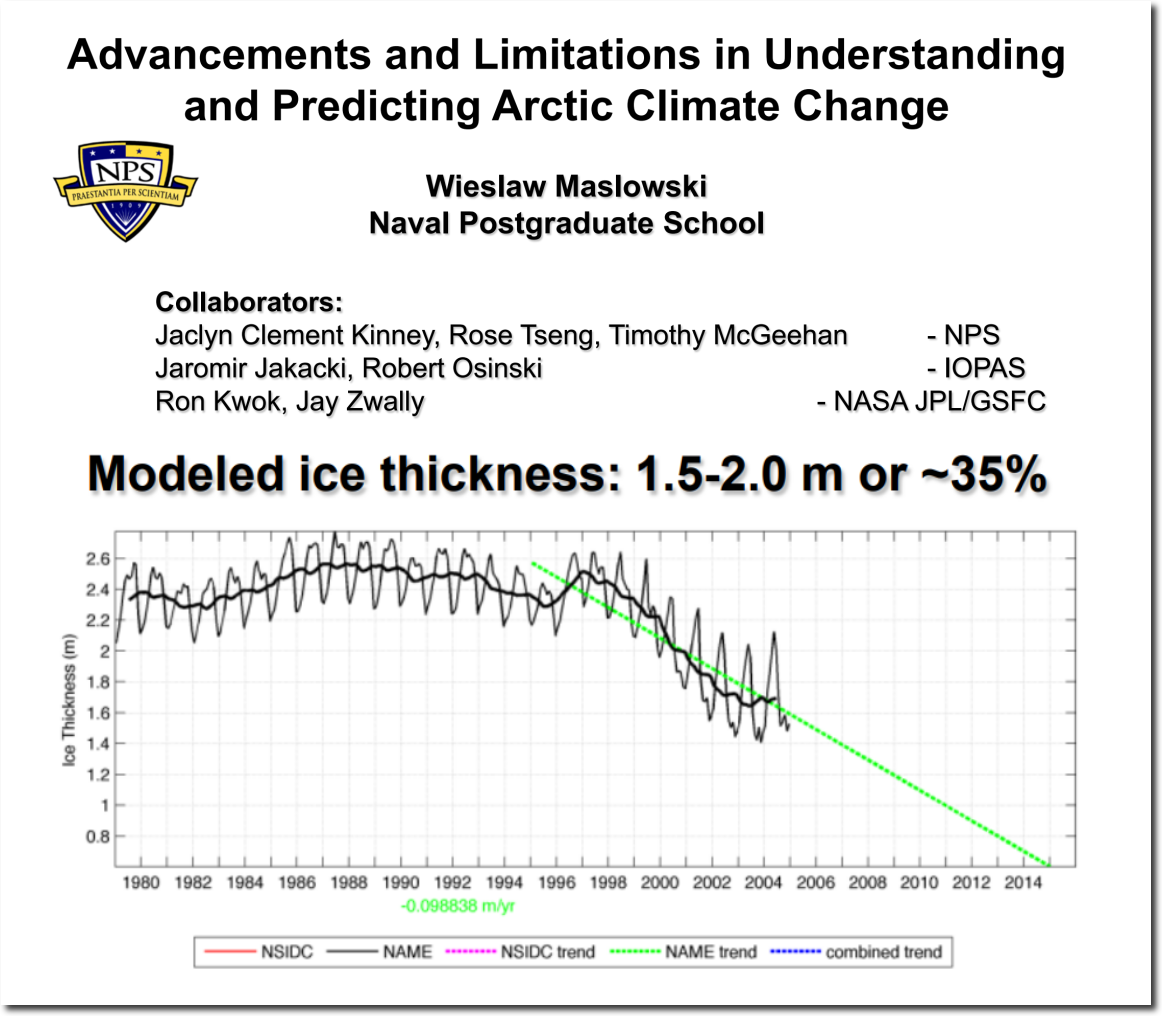
Despite all of the fear mongering, there has been little change in Arctic sea ice extent over the past 14 years.
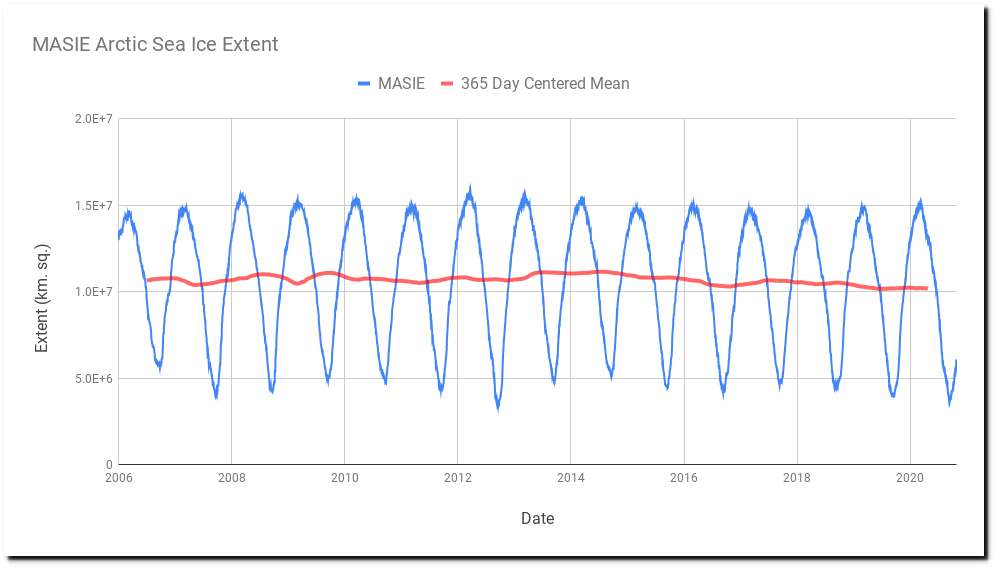
masie_4km_allyears_extent_sqkm.csv
Our top experts said the Arctic would be ice-free by 2008.
Expert: Arctic polar cap may disappear this summer_English_Xinhua
North Pole May Be Ice-Free for First Time This Summer
BBC NEWS | UK | Swimmer aims to kayak to N Pole
Star-News – Google News Archive Search
Arctic Sea Ice Gone in Summer Within Five Years?
BBC NEWS | Science/Nature | Arctic summers ice-free ‘by 2013’
Gore: Polar ice cap may disappear by summer 2014
The Argus-Press – Google News Archive Search
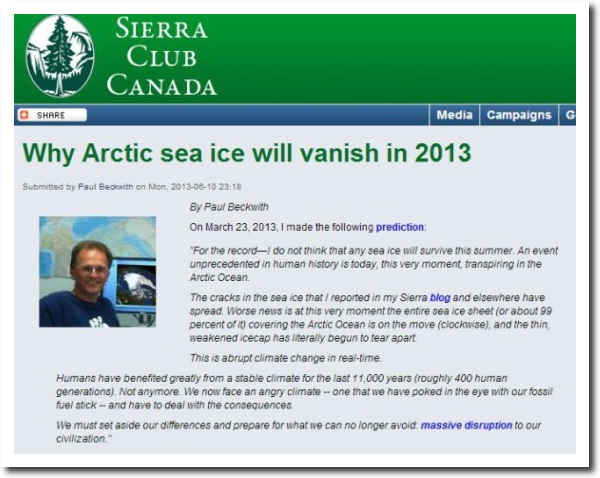
Why Arctic sea ice will vanish in 2013 | Sierra Club Canada
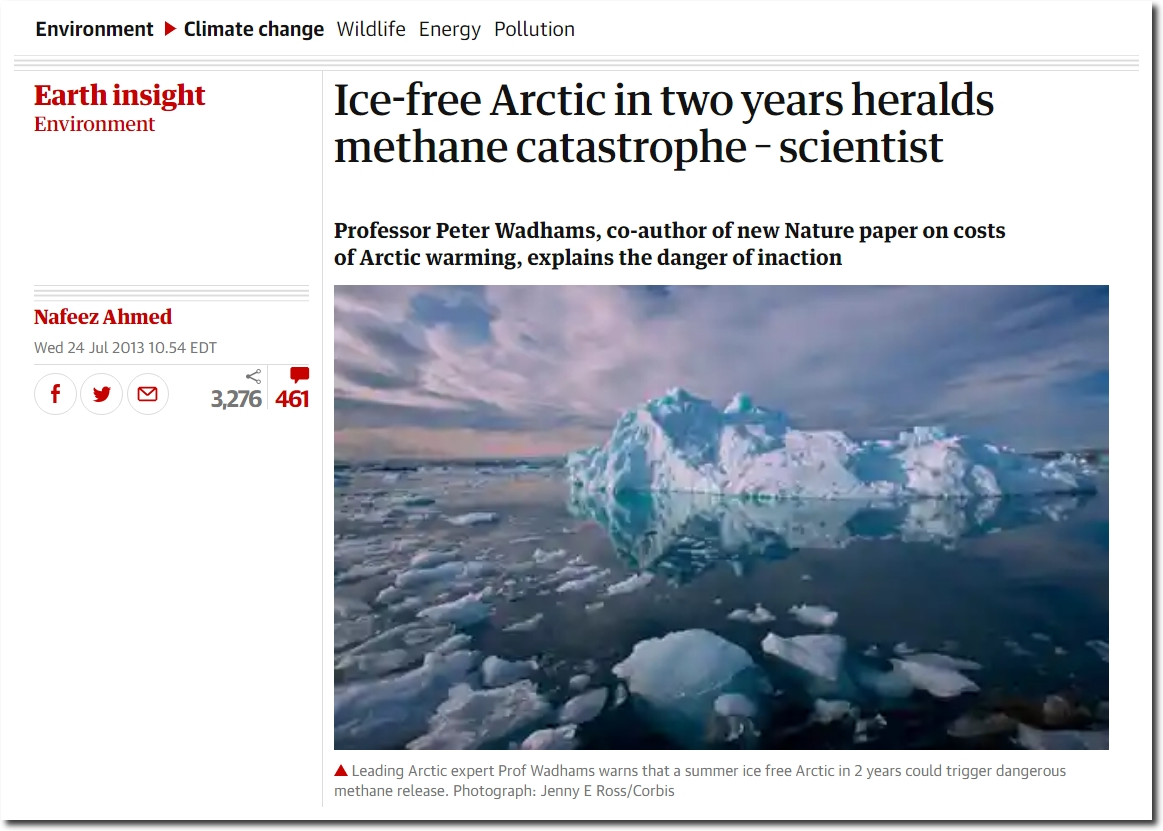
Ice-free Arctic in two years heralds methane catastrophe – scientist | Environment | The Guardian
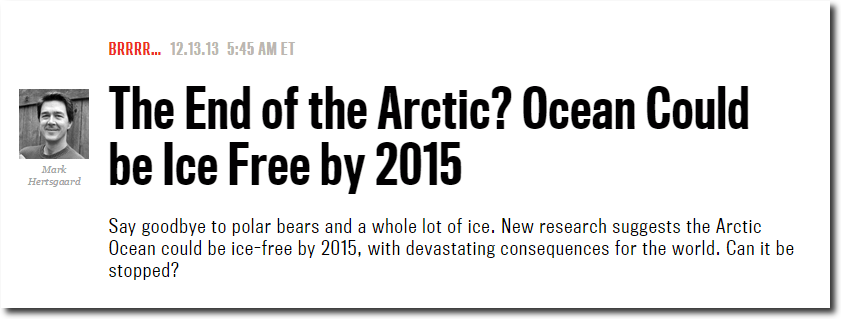
The End of the Arctic? Ocean Could be Ice Free by 2015 – The Daily Beast
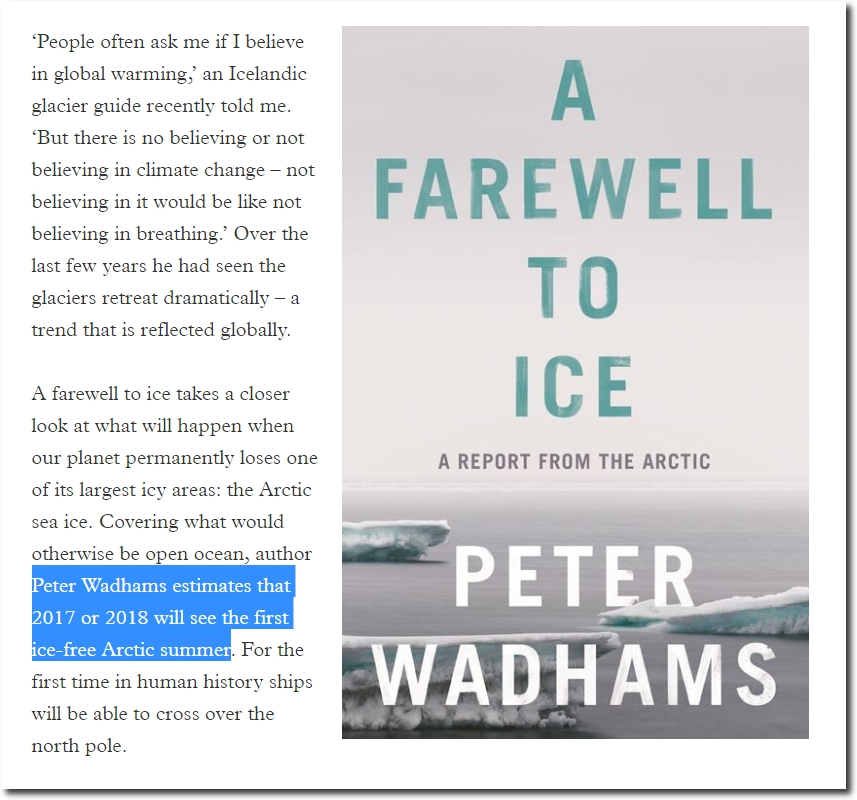
A farewell to ice | Review | Chemistry World
And President Obama’s science adviser predicted ice-free winters.
…if you lose the summer sea ice, there are phenomena that could lead you not so very long thereafter to lose the winter sea ice as well. And if you lose that sea ice year round, it’s going to mean drastic climatic change all over the hemisphere.
Alarmists are terrified that David LeGates will expose their scam.
Posted in Uncategorized
Leave a comment