The Superbowl Of Data Tampering

NOAA shows that US afternoons have warmed sharply over the past century.

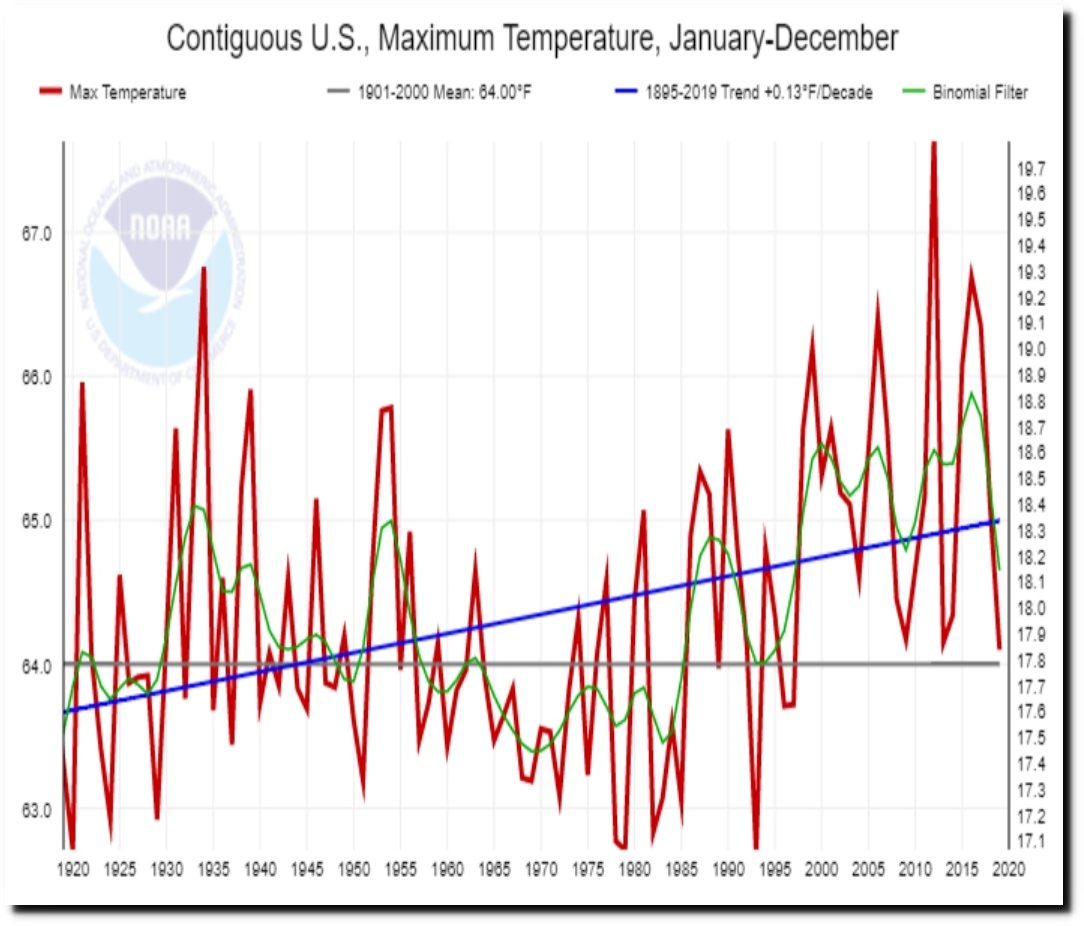
Climate at a Glance | National Centers for Environmental Information (NCEI)

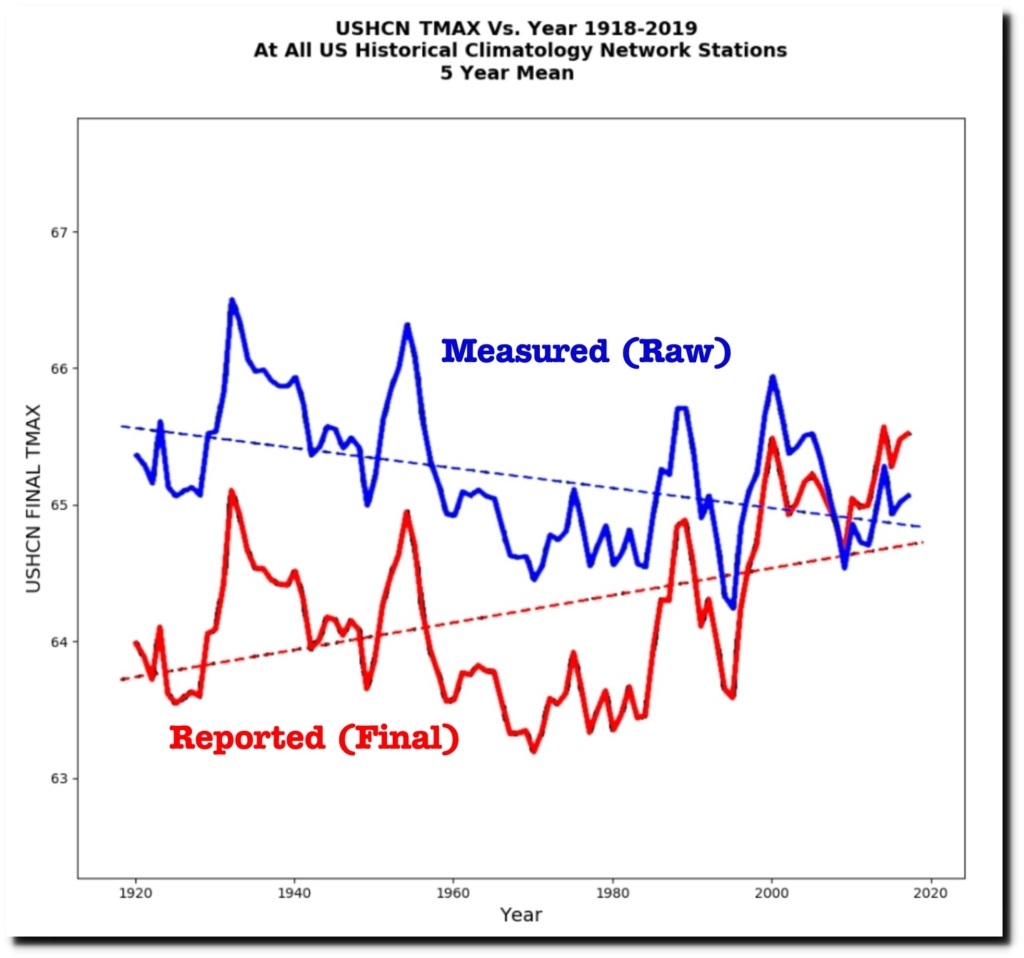
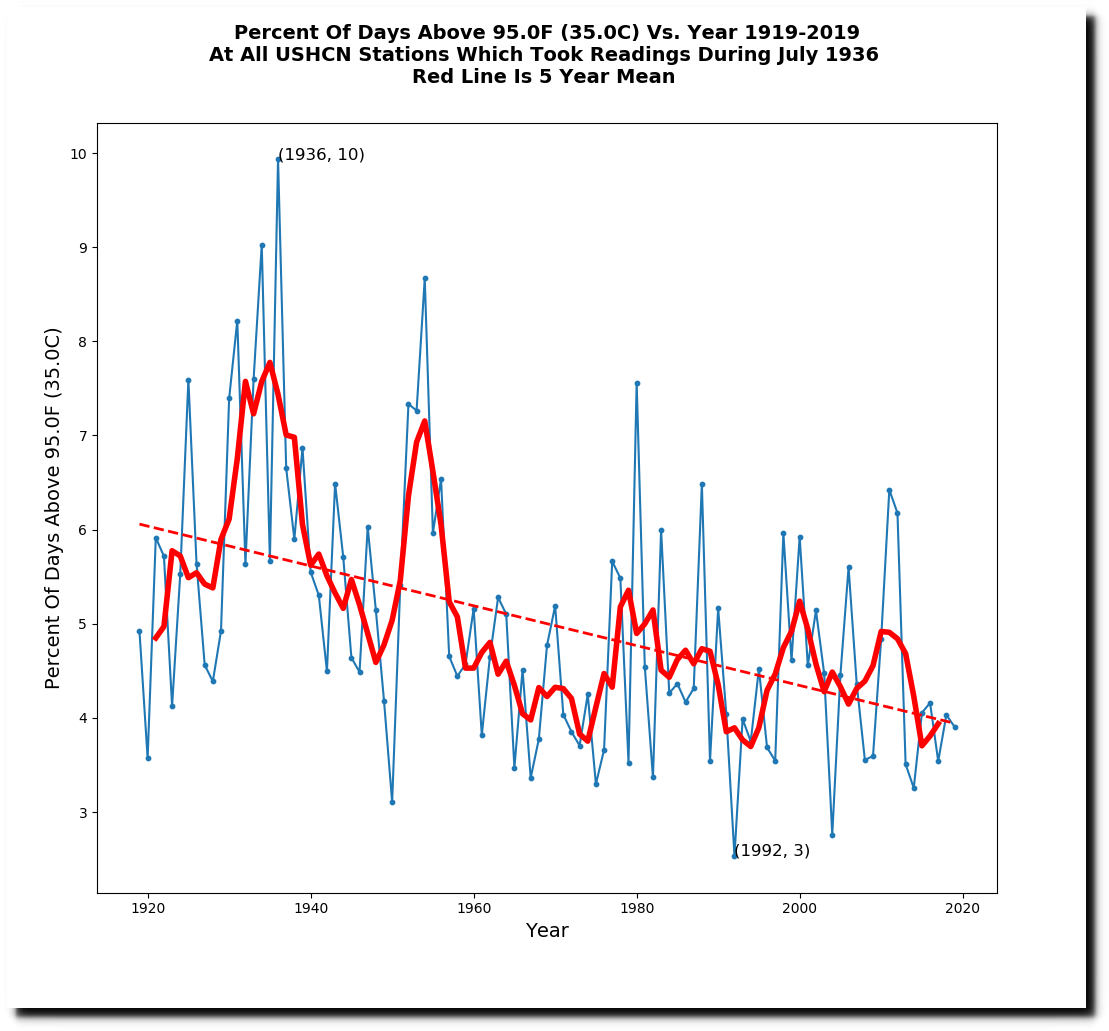
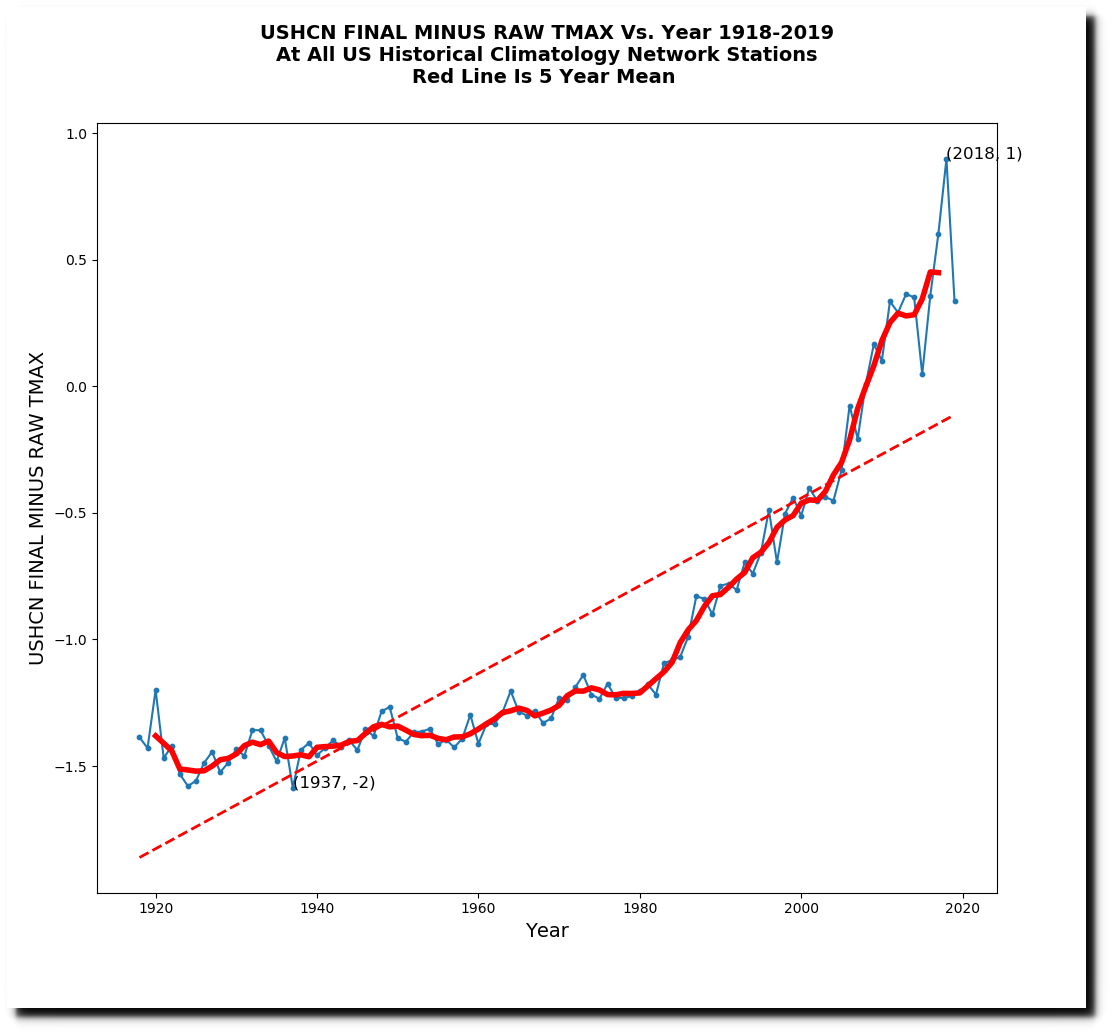
NOAA thermometer data shows cooling. The warming only appears after the data is altered.


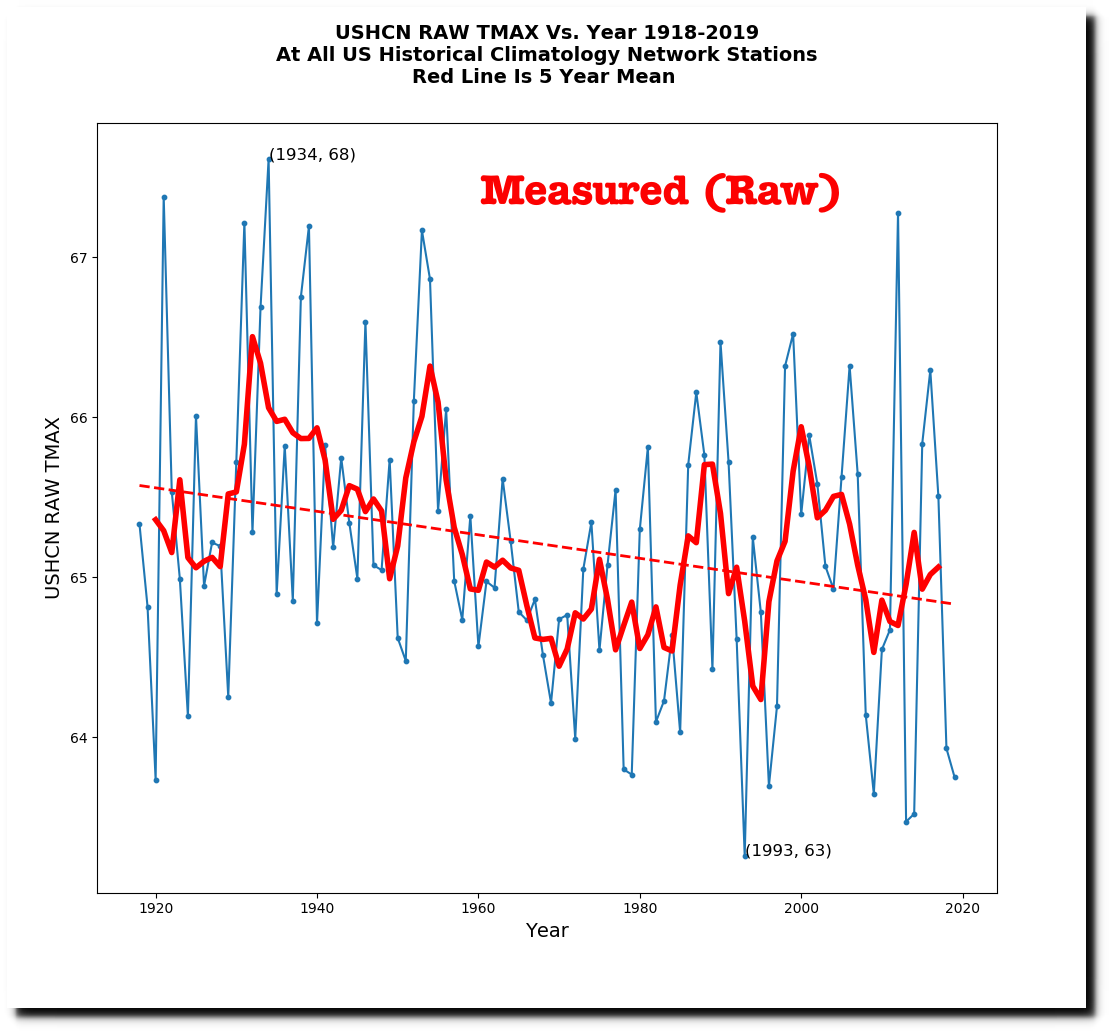
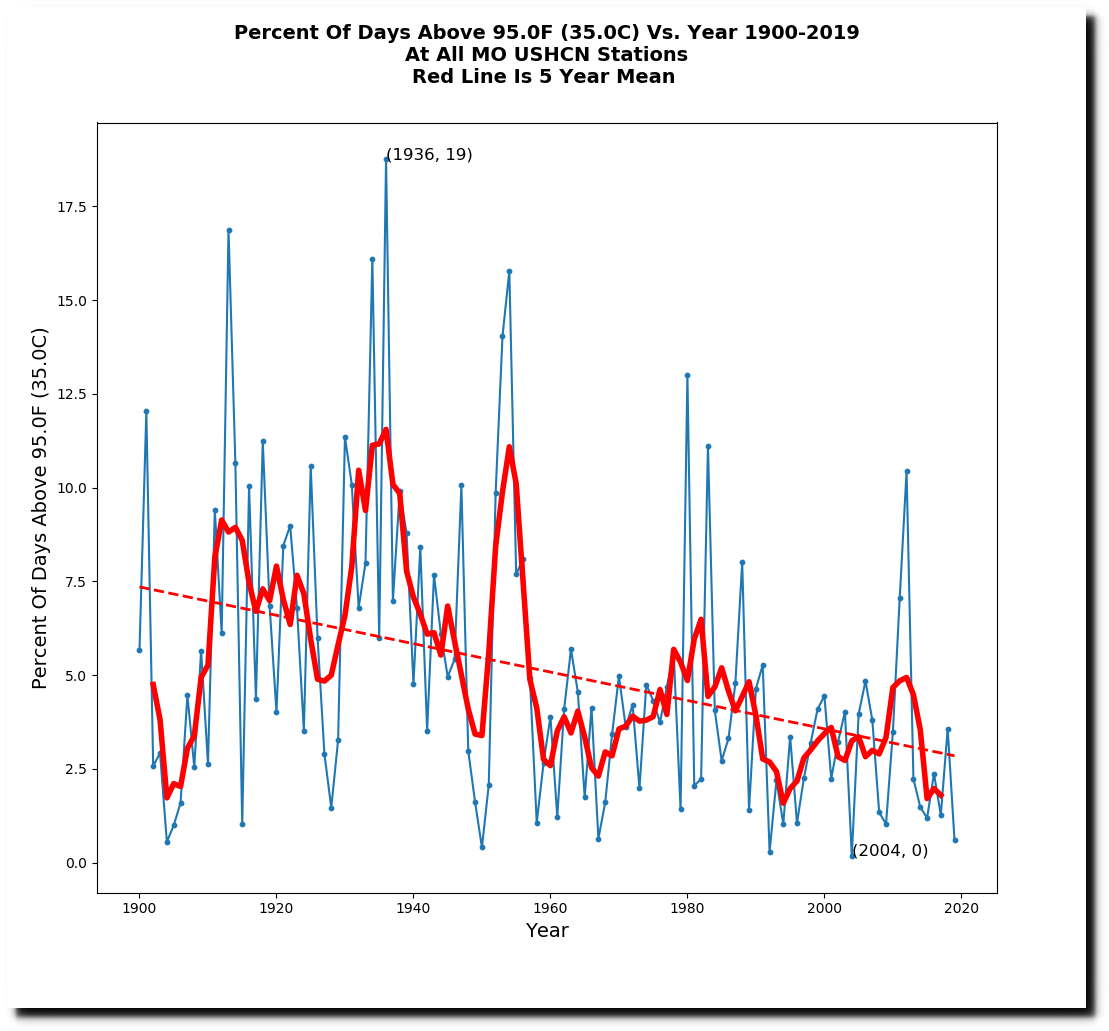
These adjustments are made despite the fact that hot days used to be much more common in the US.

The National Climate Assessment agrees with the graphs I create.


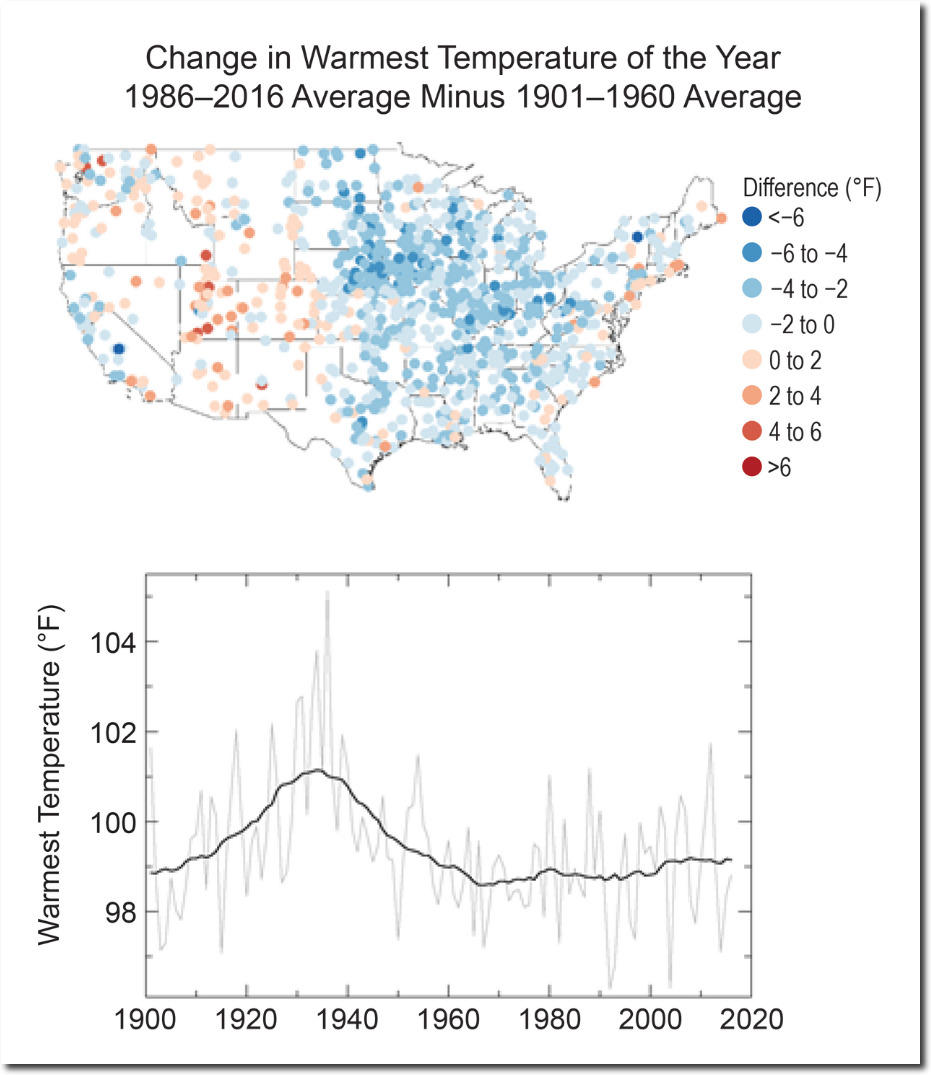
Temperature Changes in the United States – Climate Science Special Report

The primary excuse for the data tampering is Time of Observation Bias (TOB) – which based on the belief that if your twenty four hour measuring period begins too close to the daily maximum, average maximum temperatures will be too high. The opposite occurs if the 24 hour period begins too close to the daily minimum, average minimum temperatures will be too low.

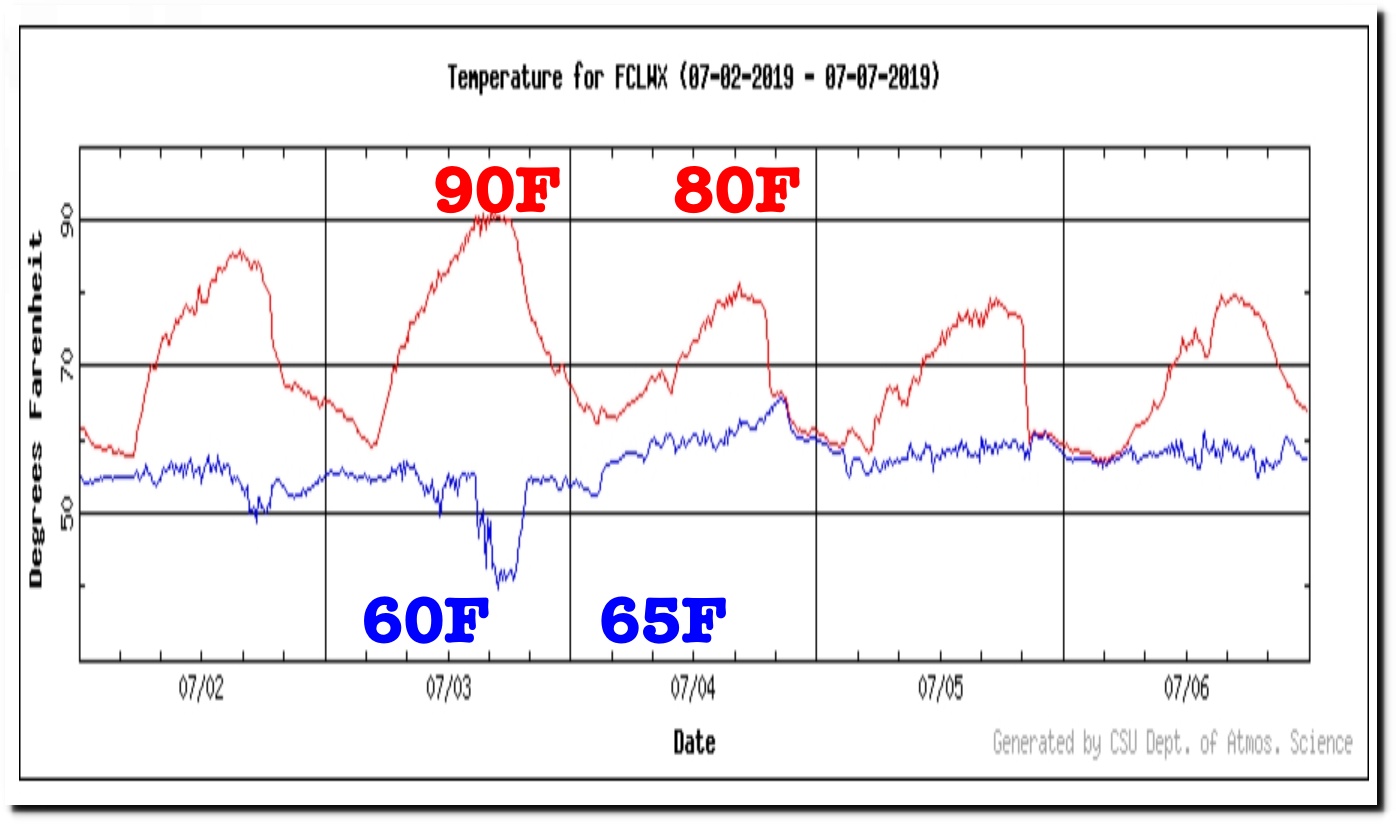
In this case, the 24 hour period begins at 4PM, and average maximum temperatures are too high.

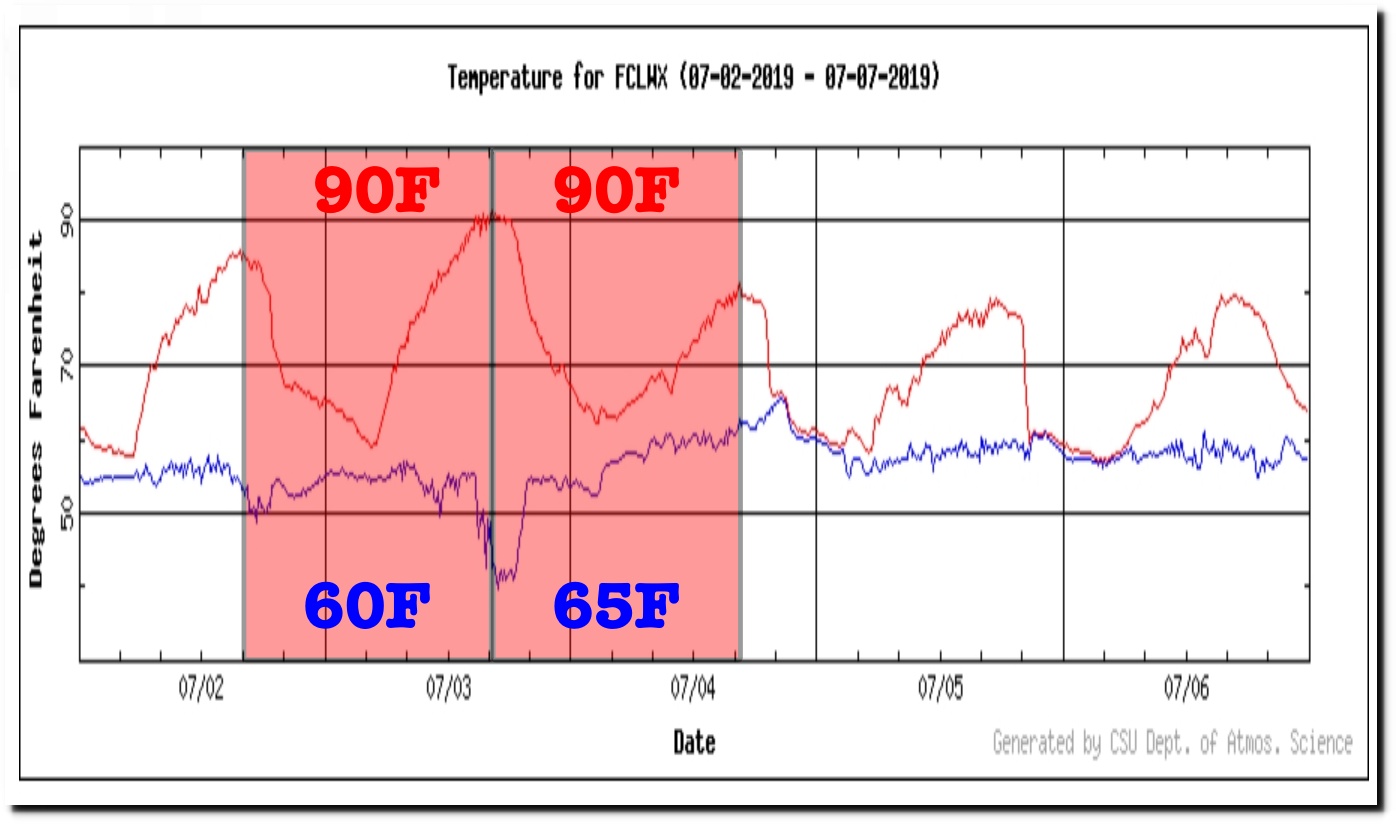
In this case, the 24 hour period begins at 4AM, and average minimum temperatures are too low.

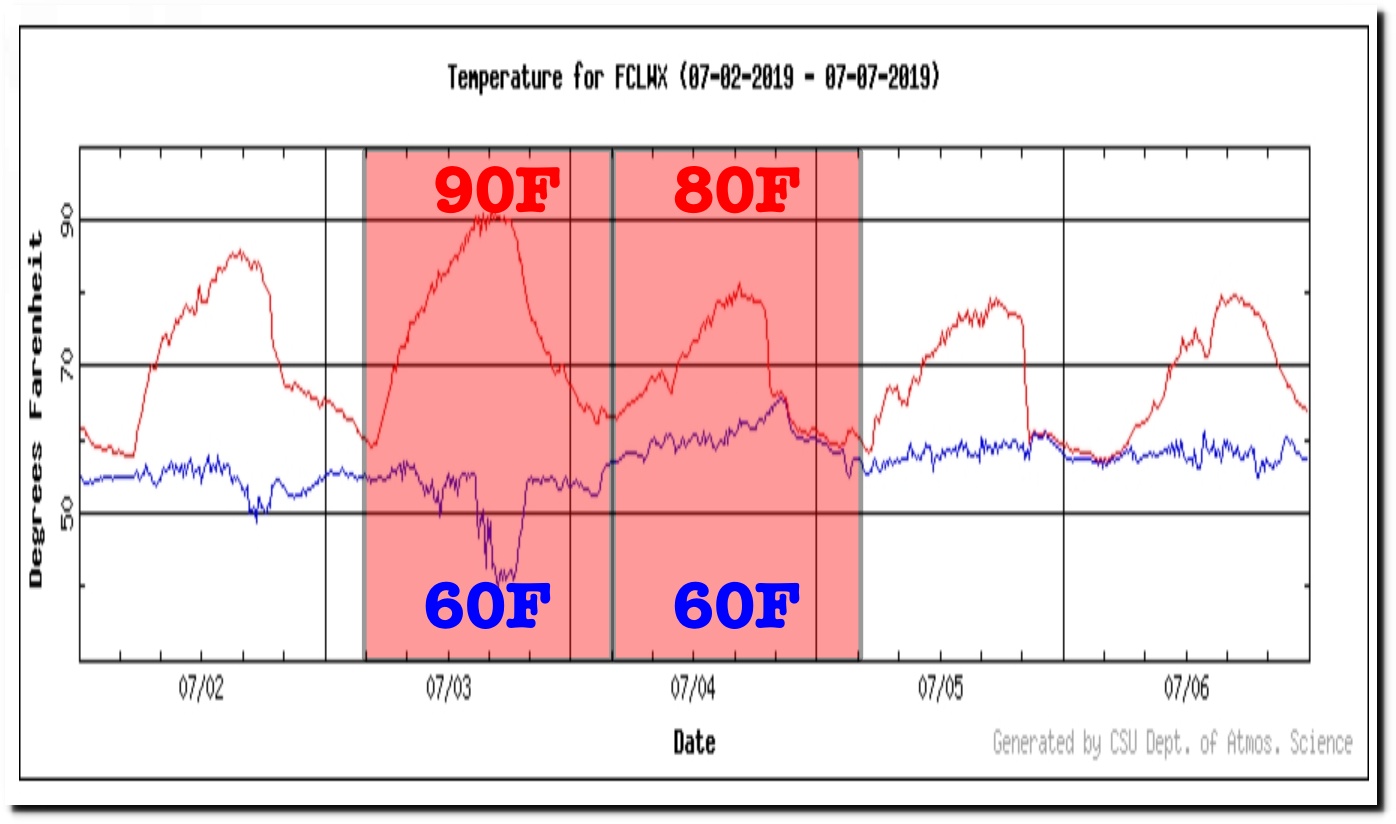
Fort Collins Weather Station Custom Data Plots

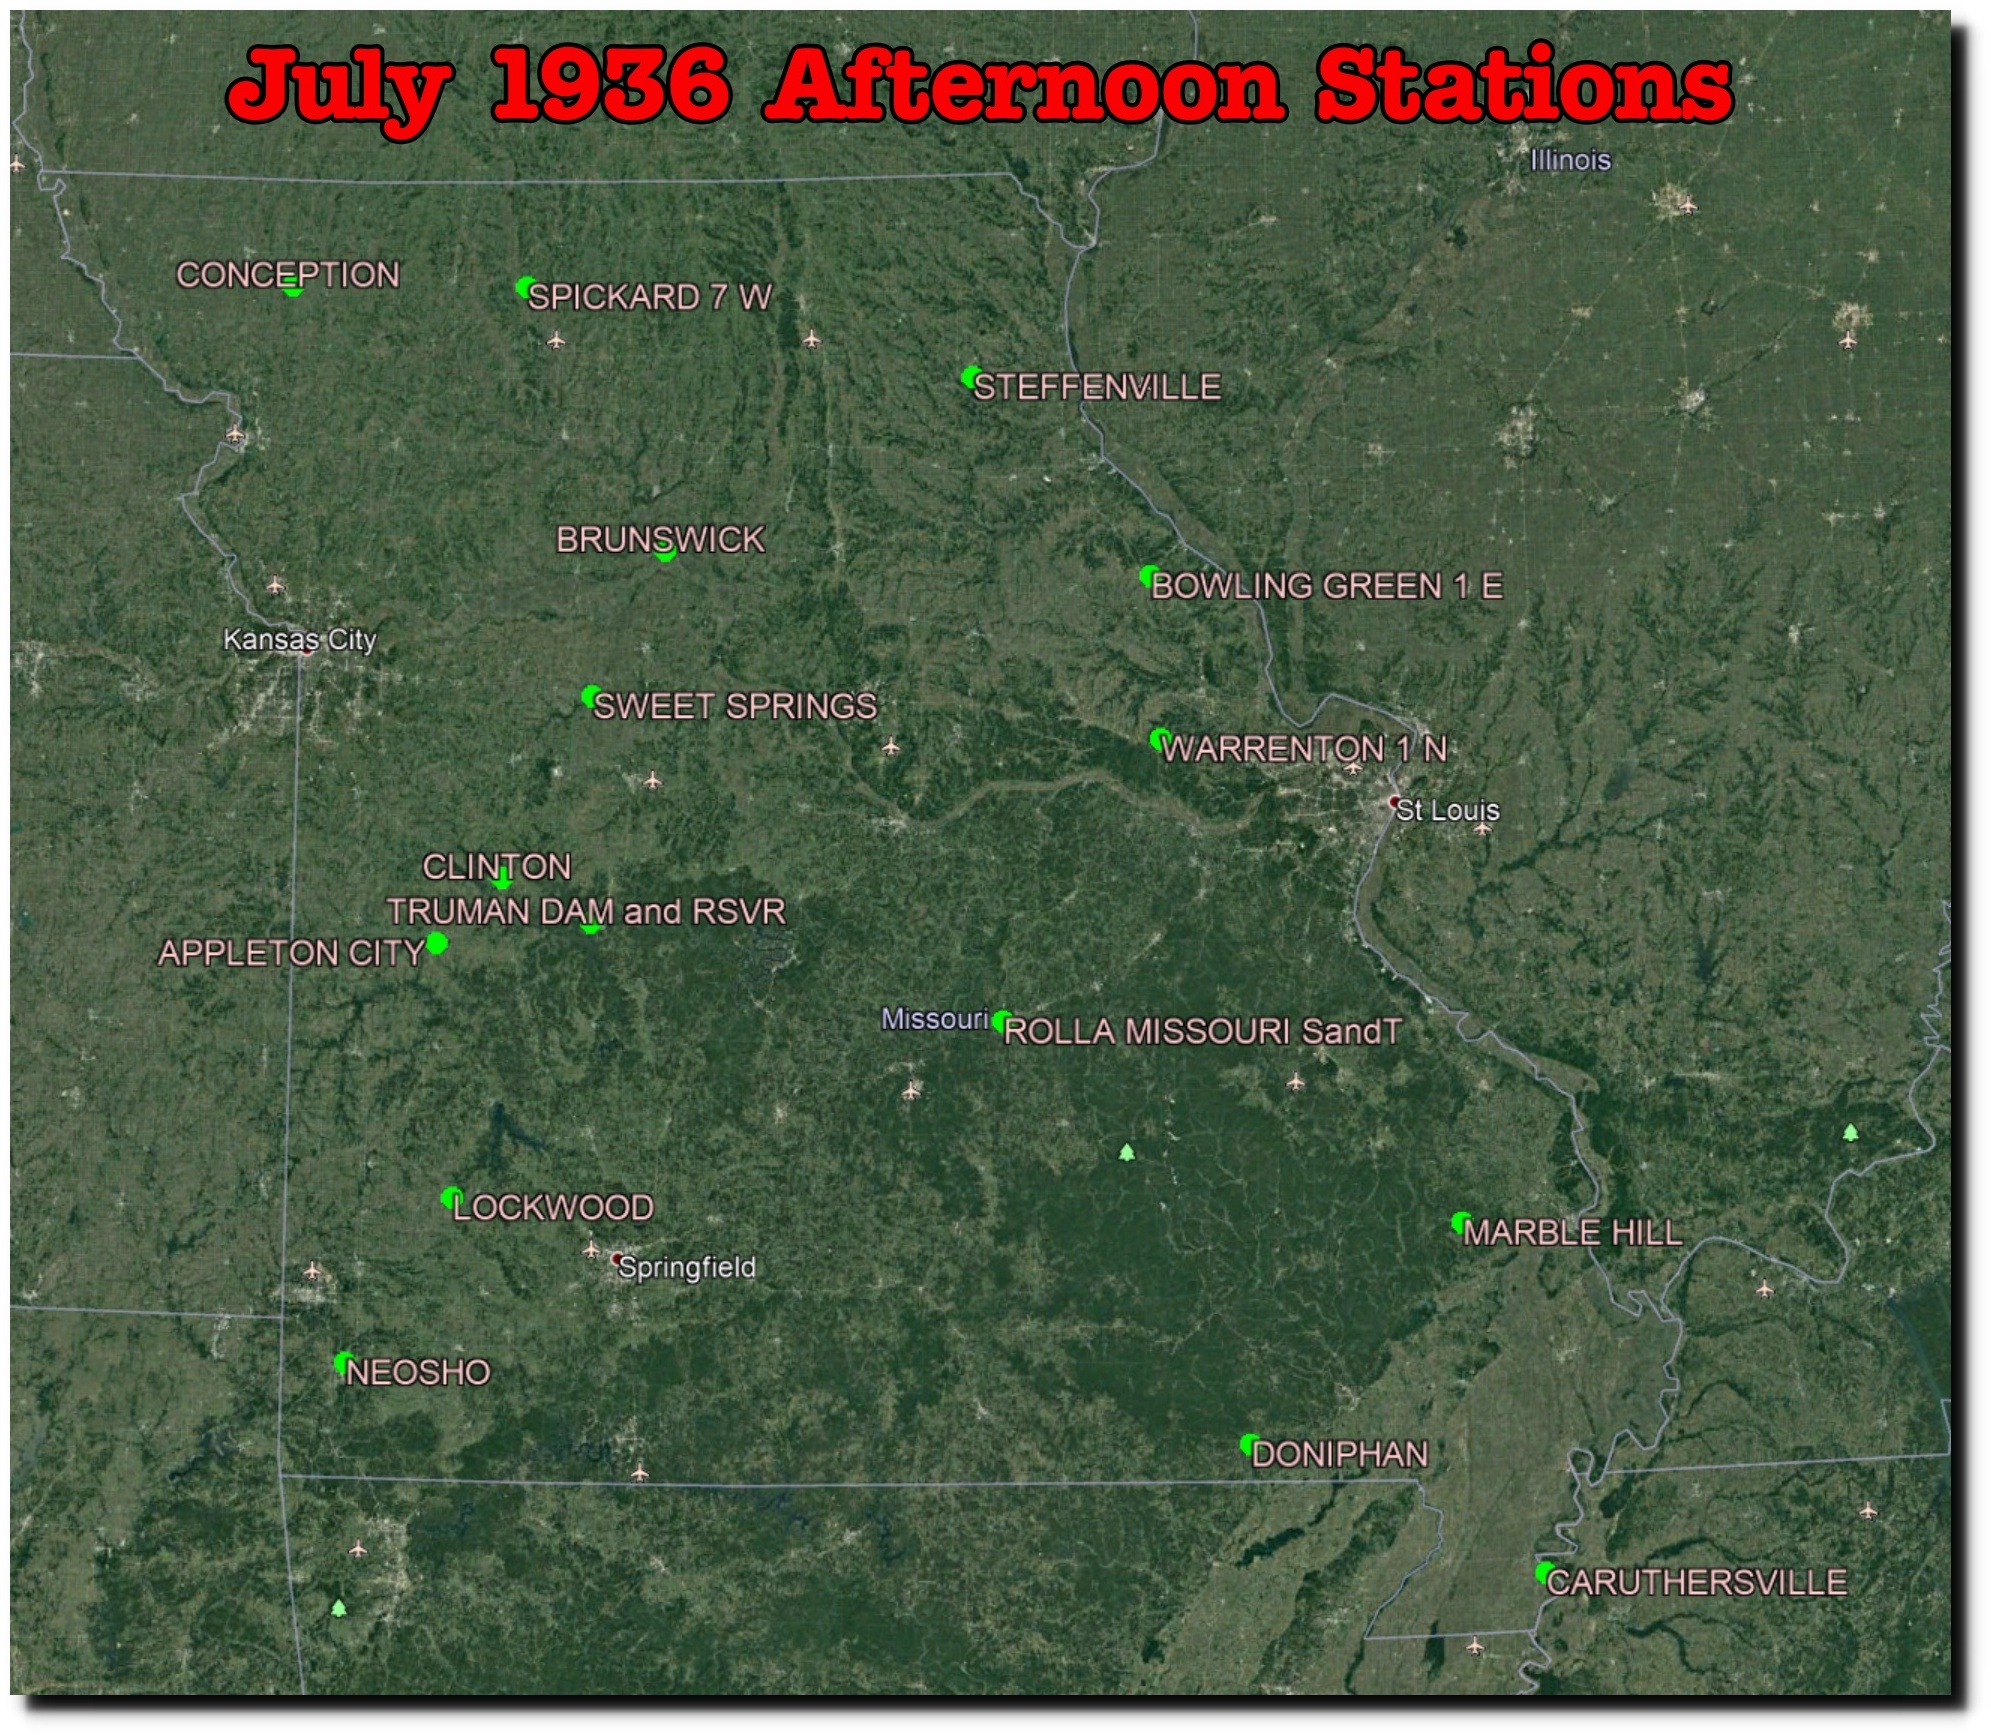
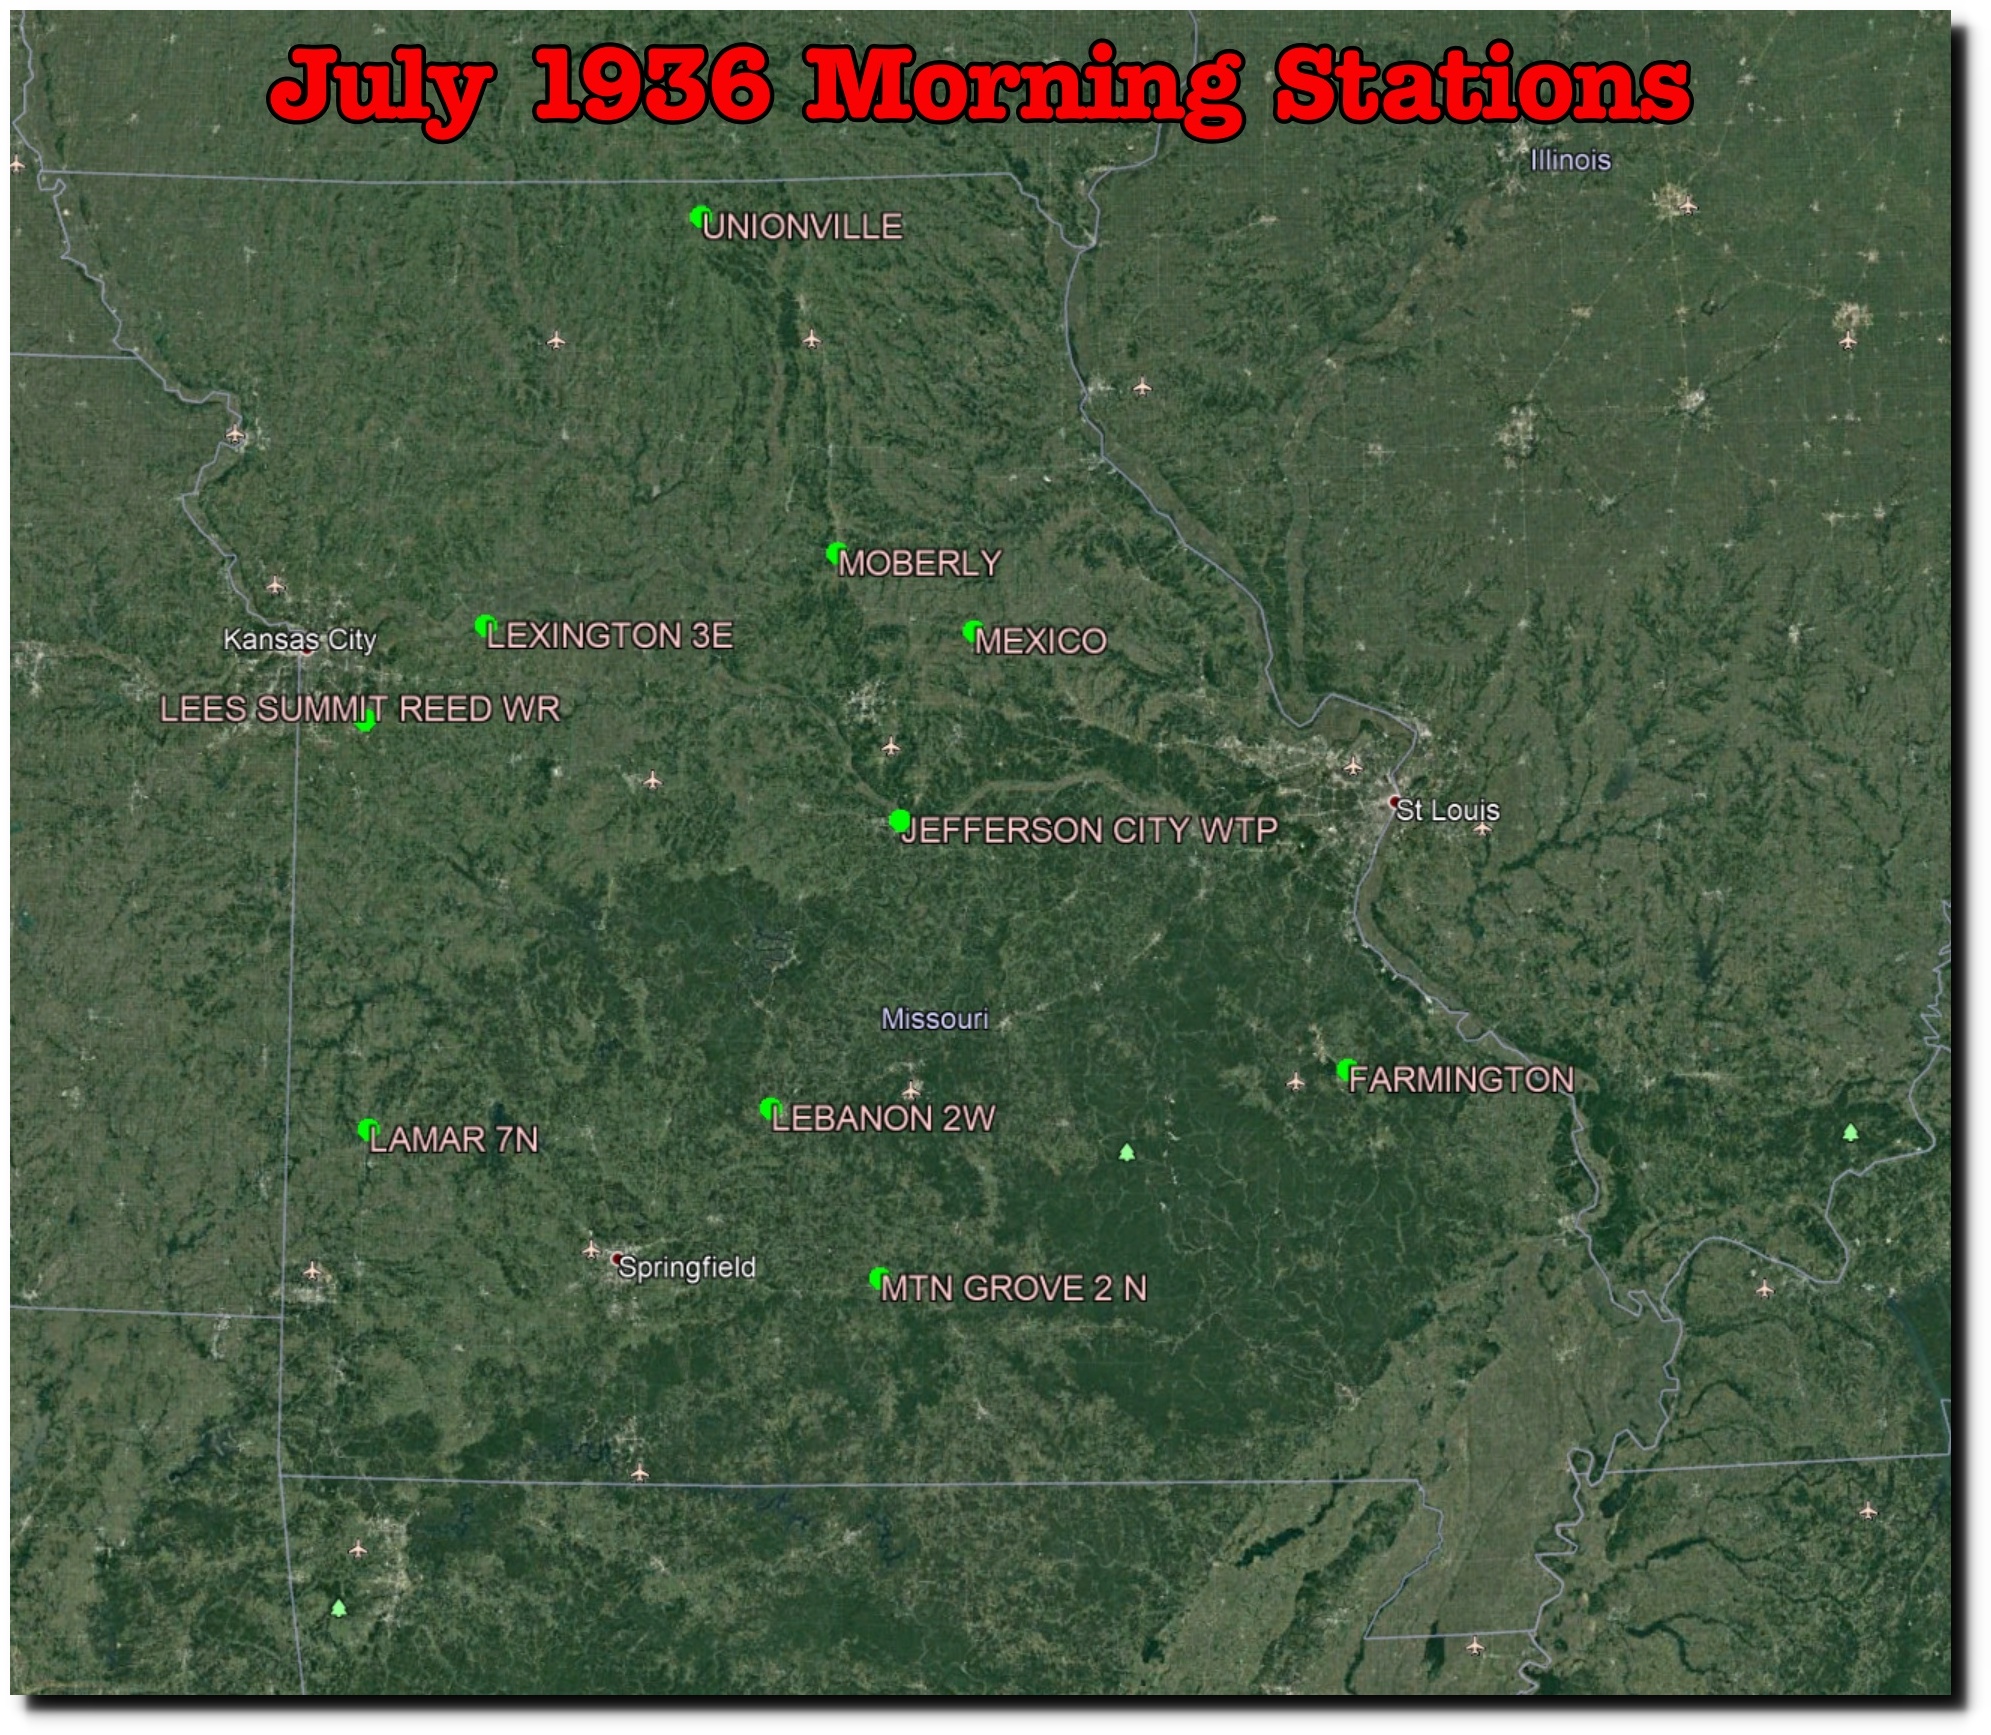
NOAA believes that most stations during the 1930s used a 24 hour period which began in the afternoon, causing average 1930s afternoon temperatures to be too high. This is easy enough to test out by splitting the stations up into afternoon groups and morning groups.

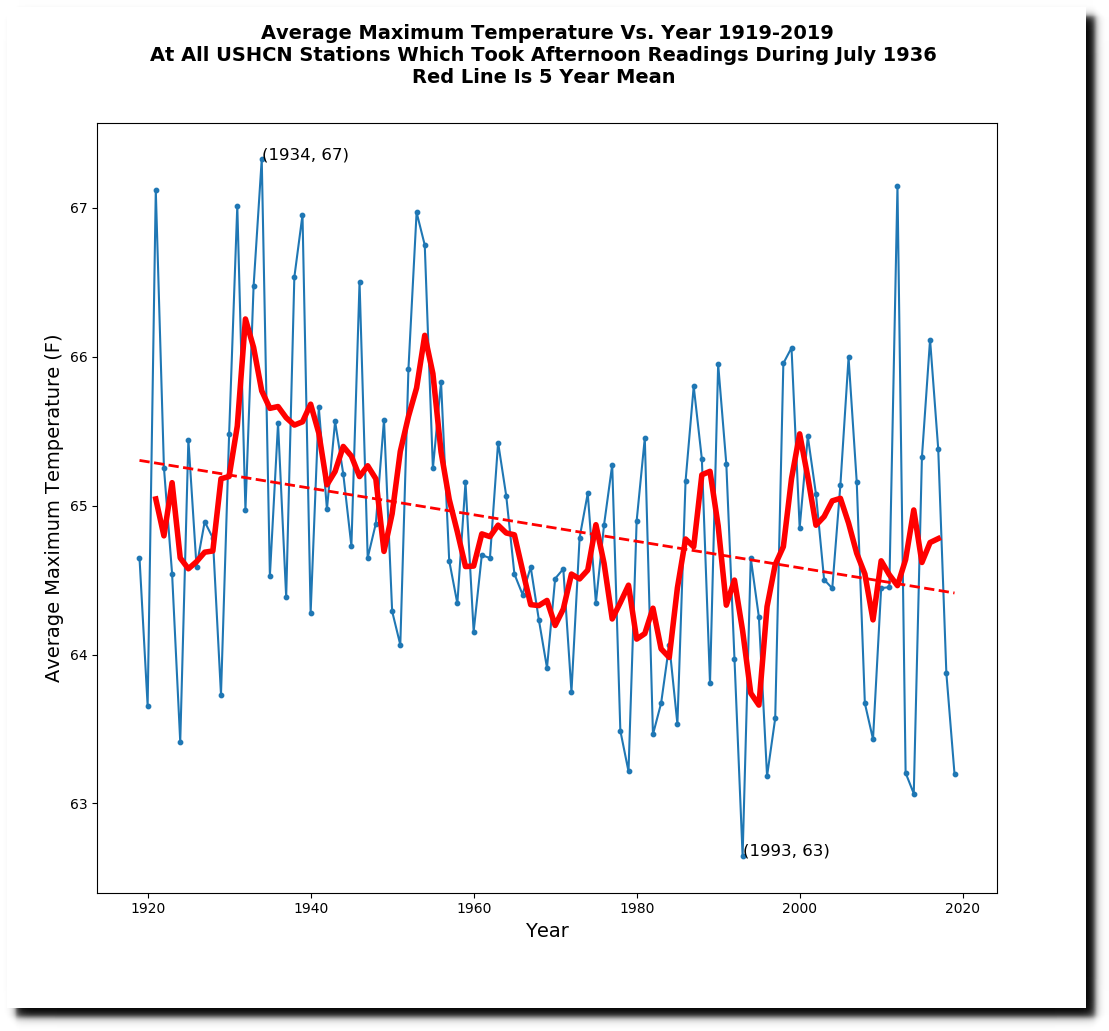
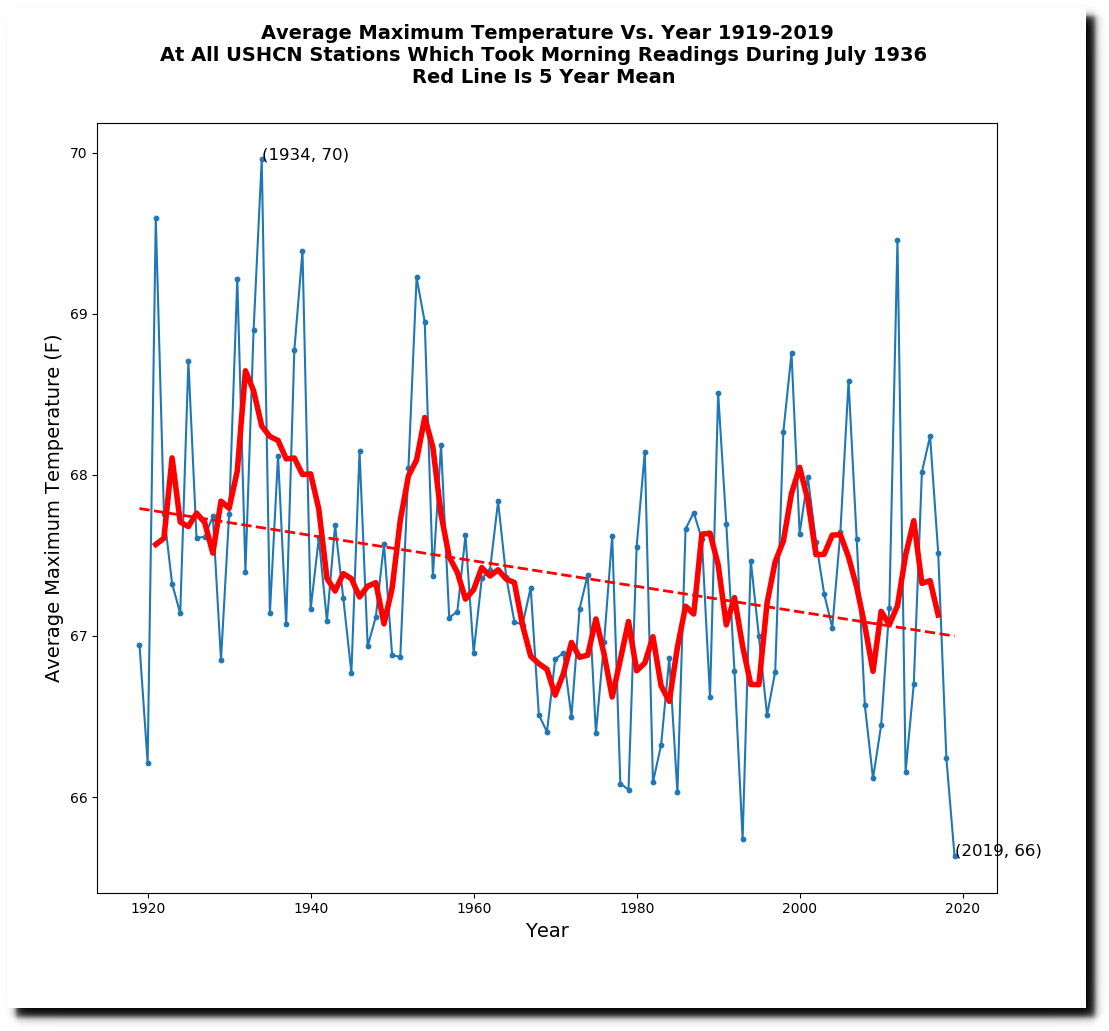
The morning stations average about three degrees warmer, because people at warmer locations are more likely to read thermometers in the morning.

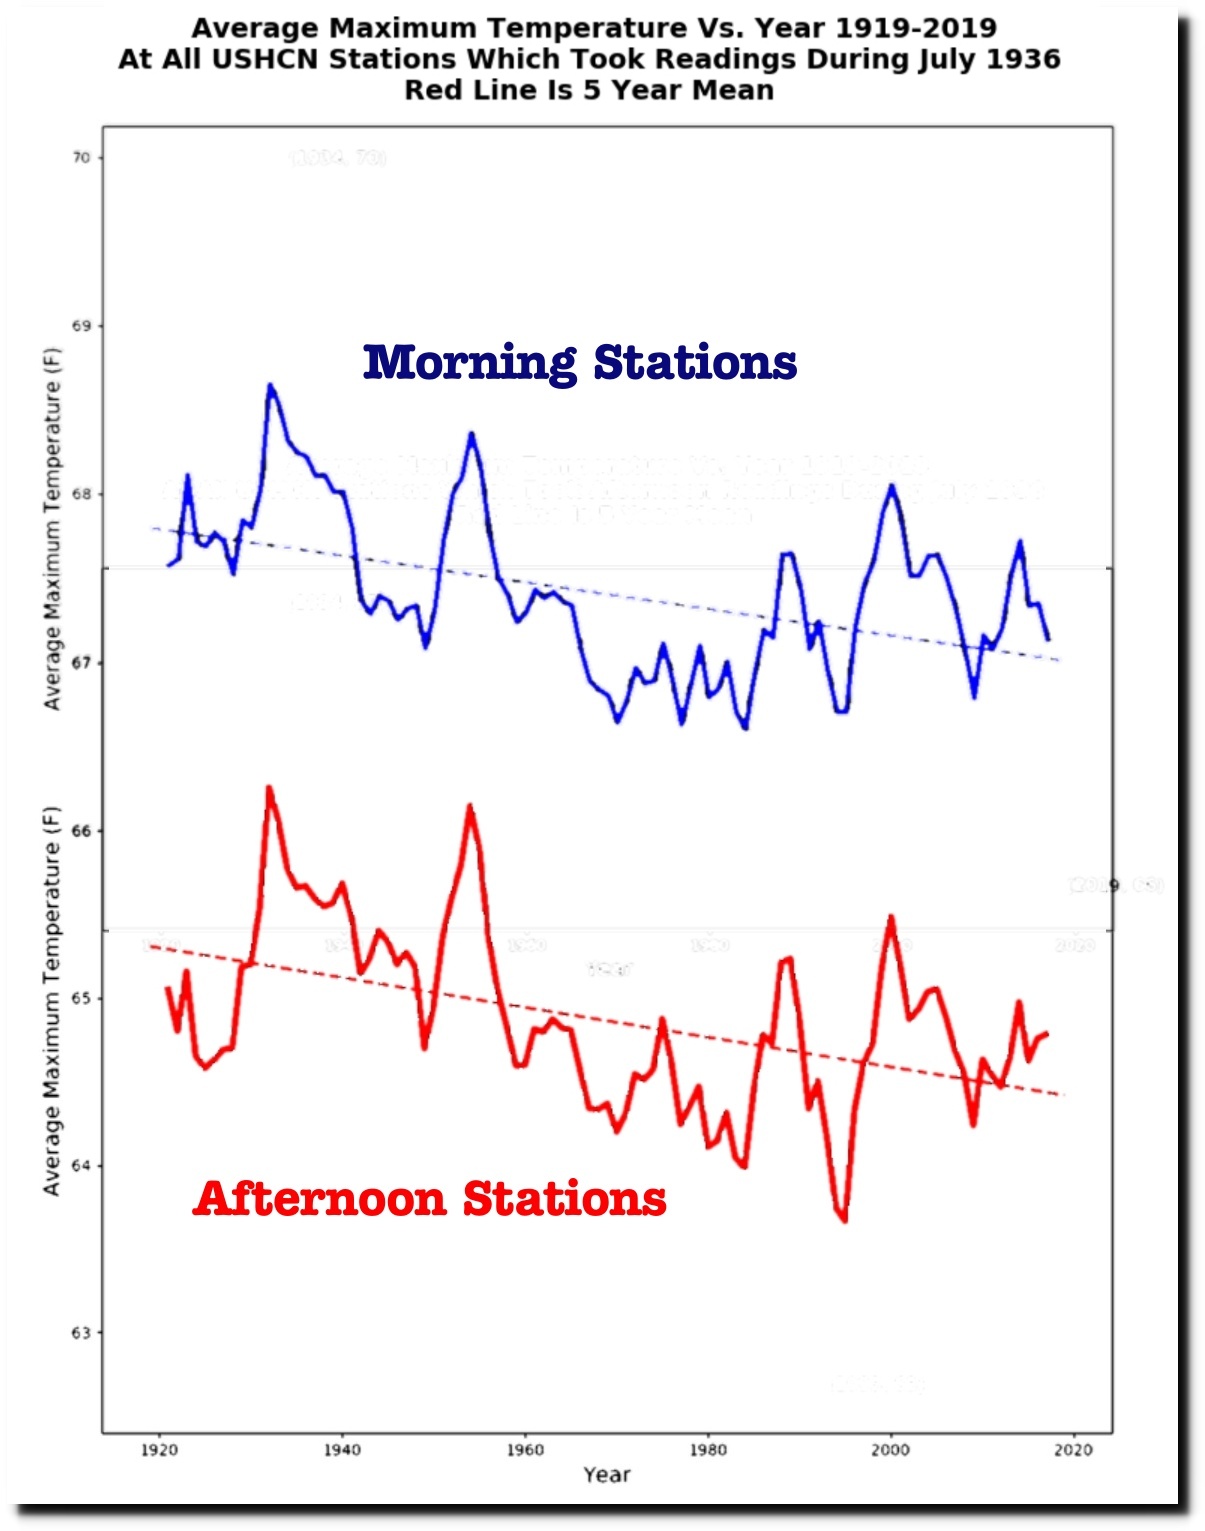
If these two graphs are normalized, it becomes clear that there is almost no difference between the trends of the two groups of stations. TOB has very little effect.

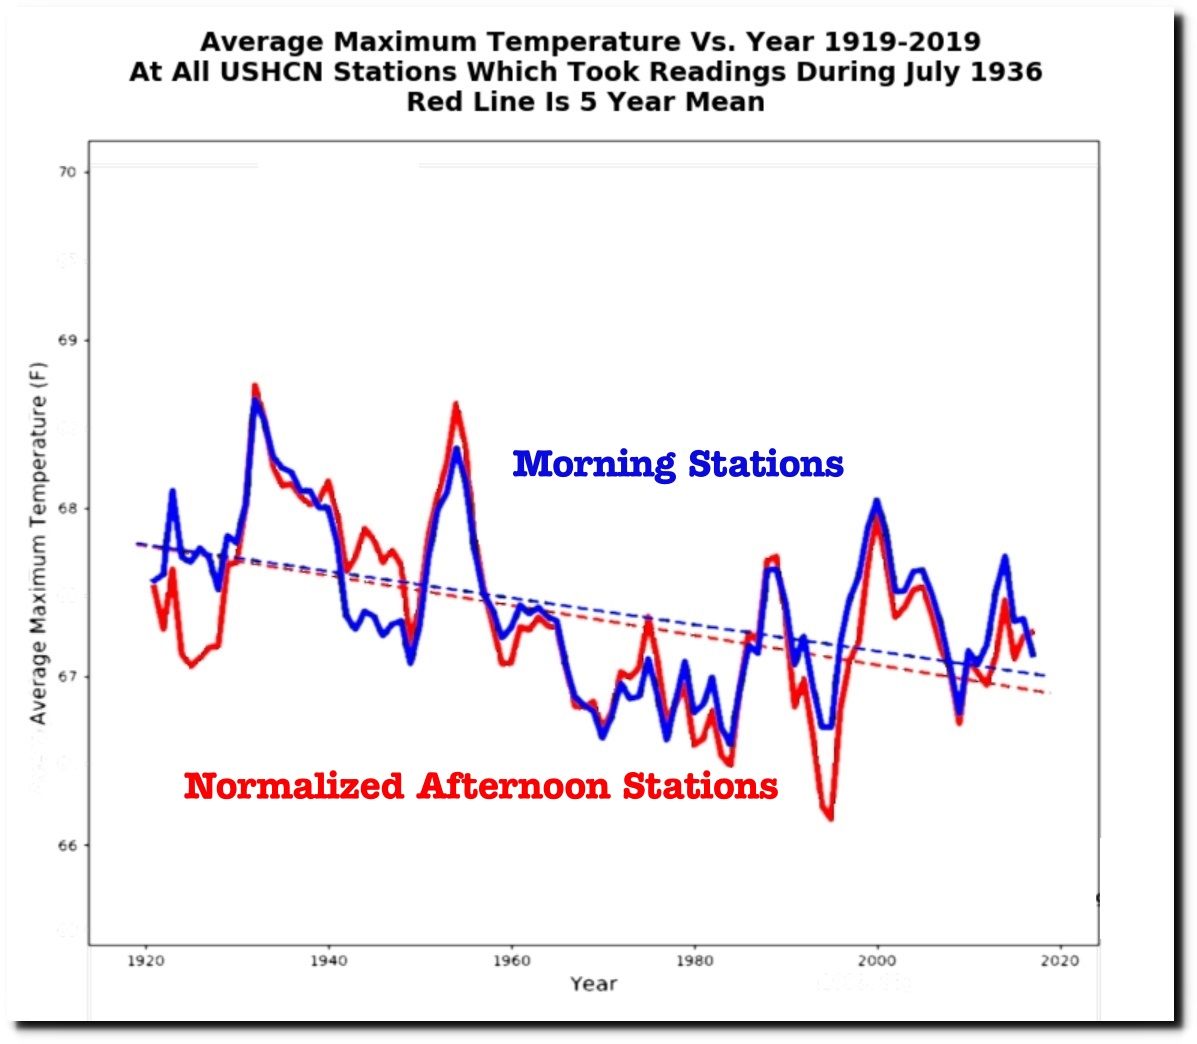
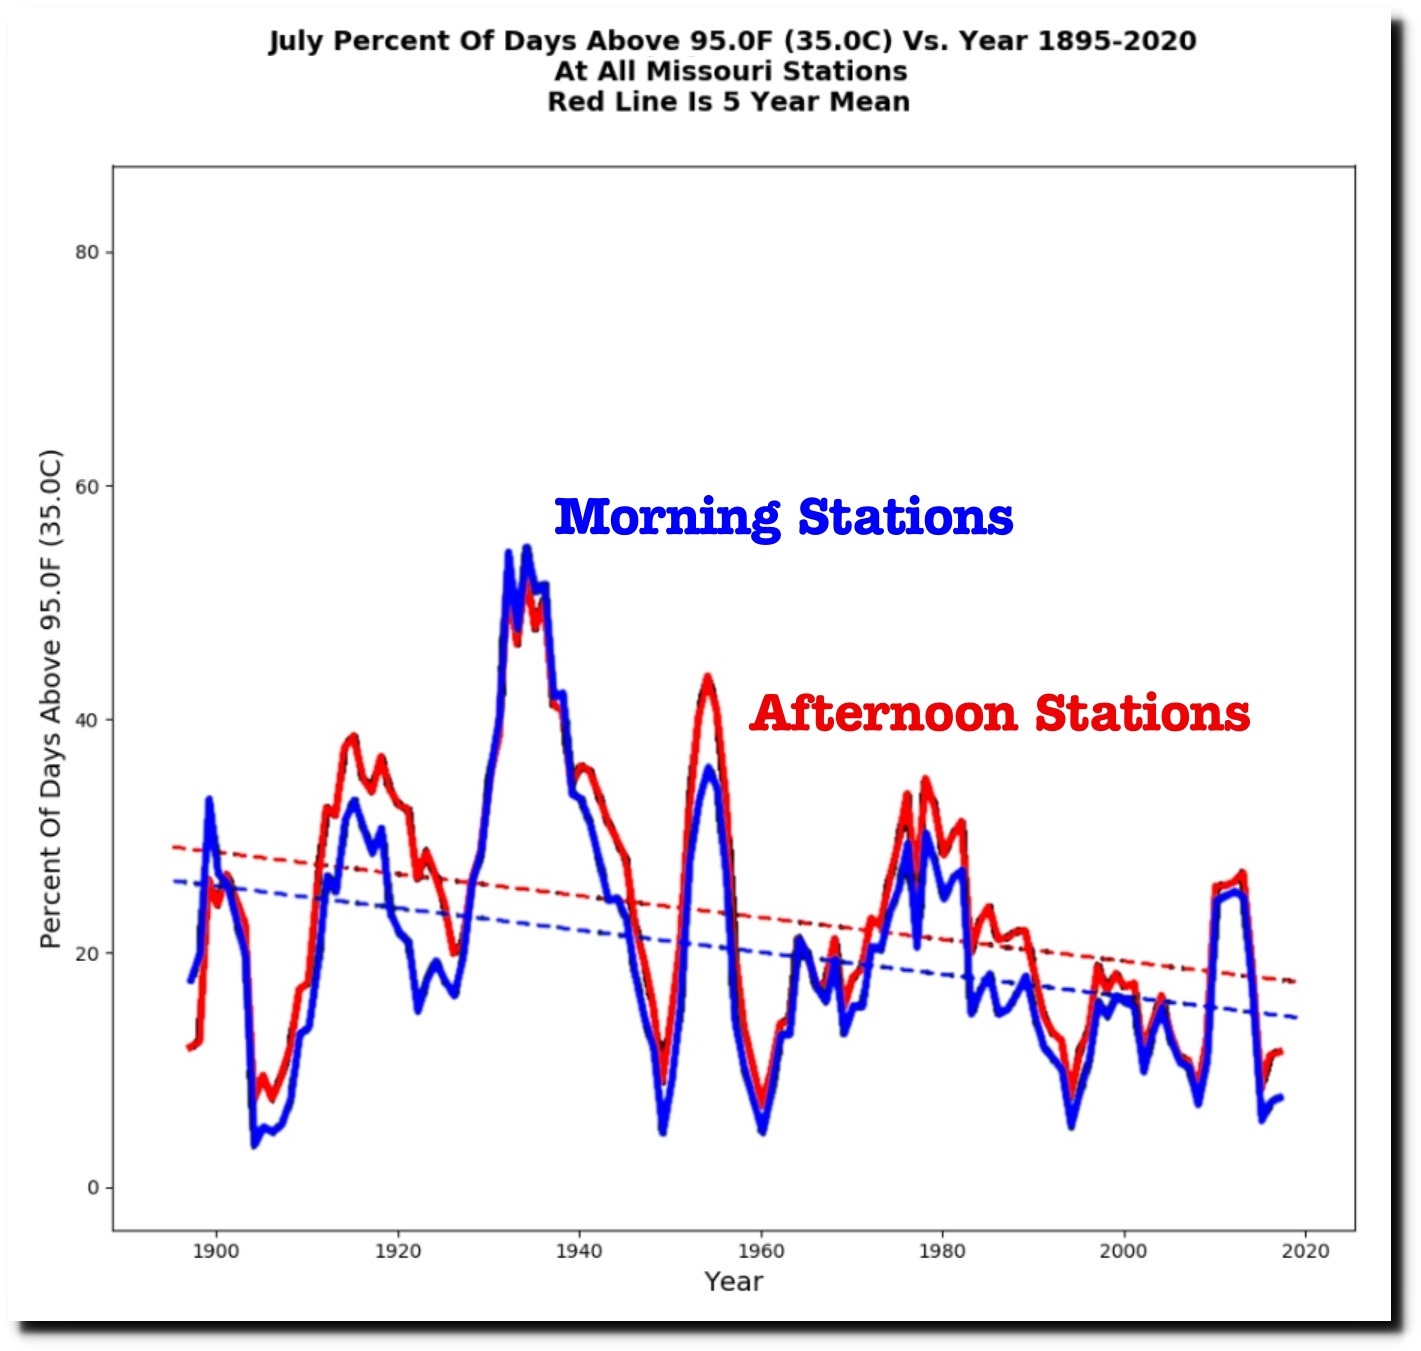
Missouri is the best state to look at in more detail, because they had nearly an equal number of morning and afternoon stations in 1936.

NOAA massively adjusts Missouri temperatures to cool the past.

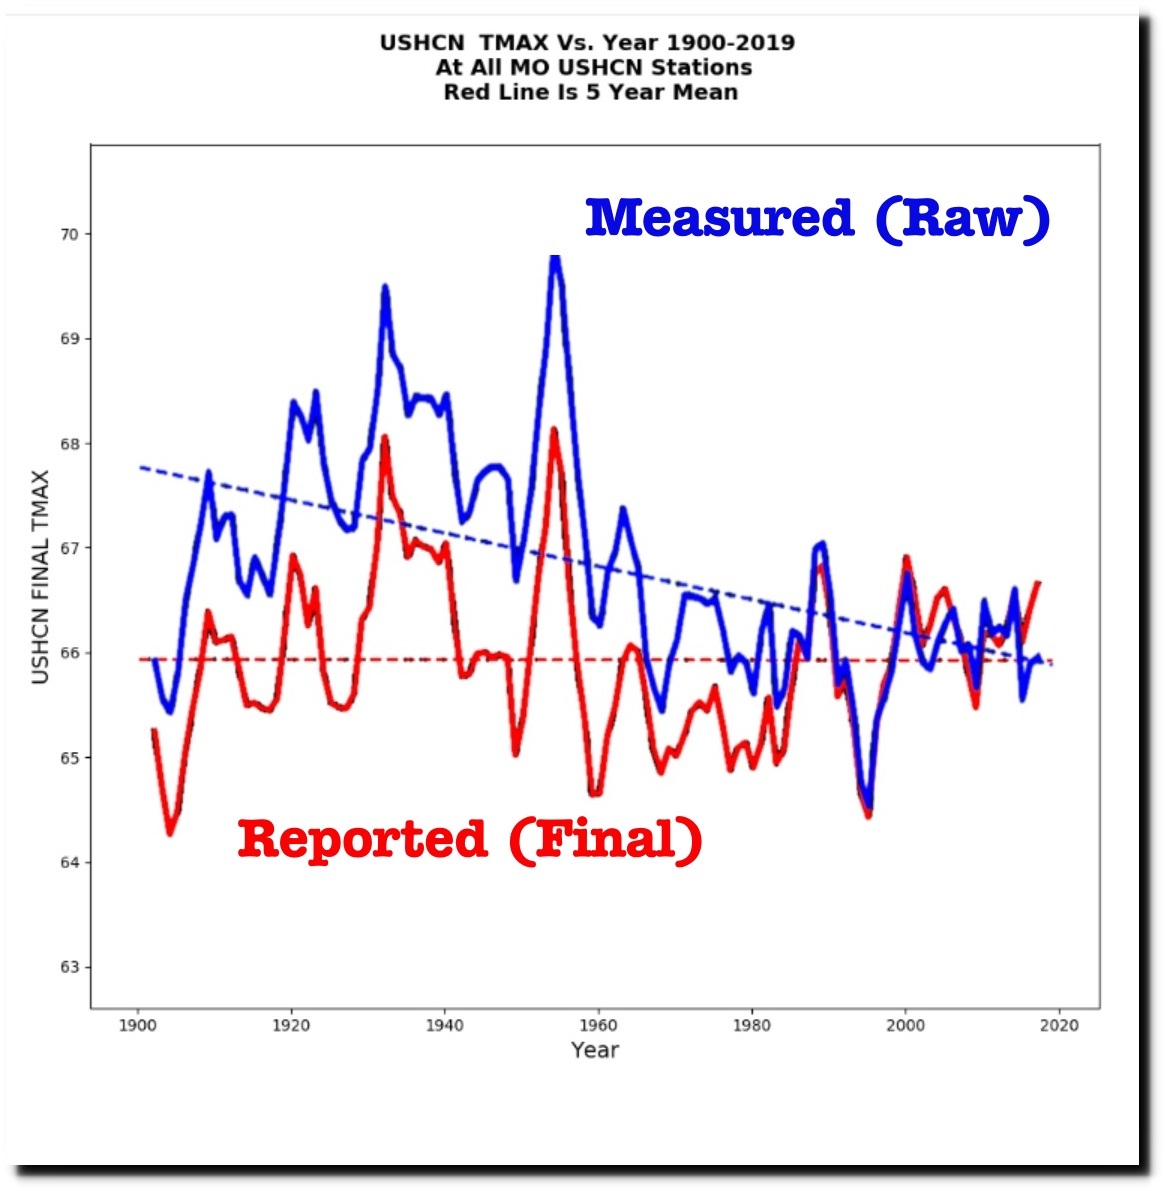
But the two groups (morning and afternoon) are nearly identical, particularly during the 1930s. The NOAA adjustments are fraudulent.

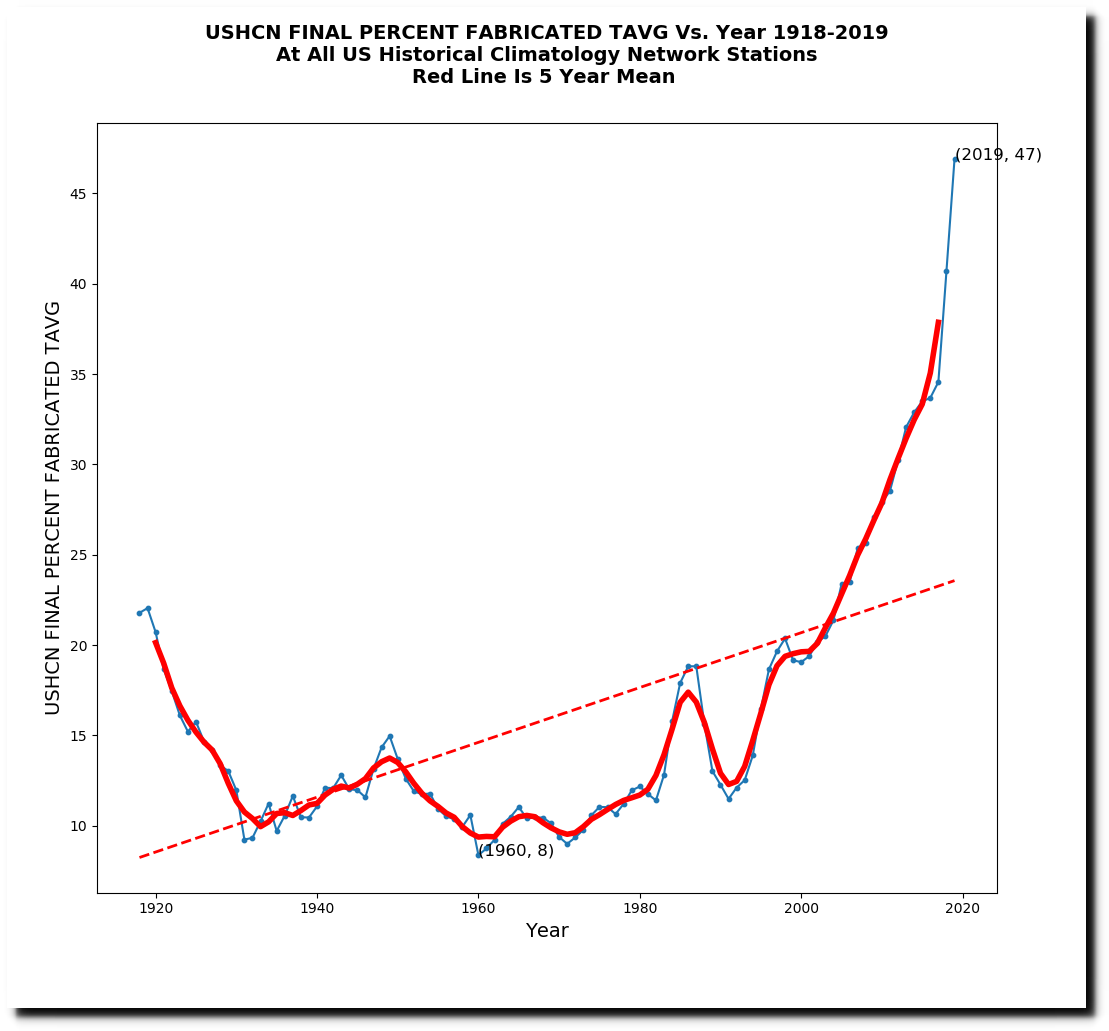
The real story is that NOAA is simply making data up. Almost half of it is now fake.

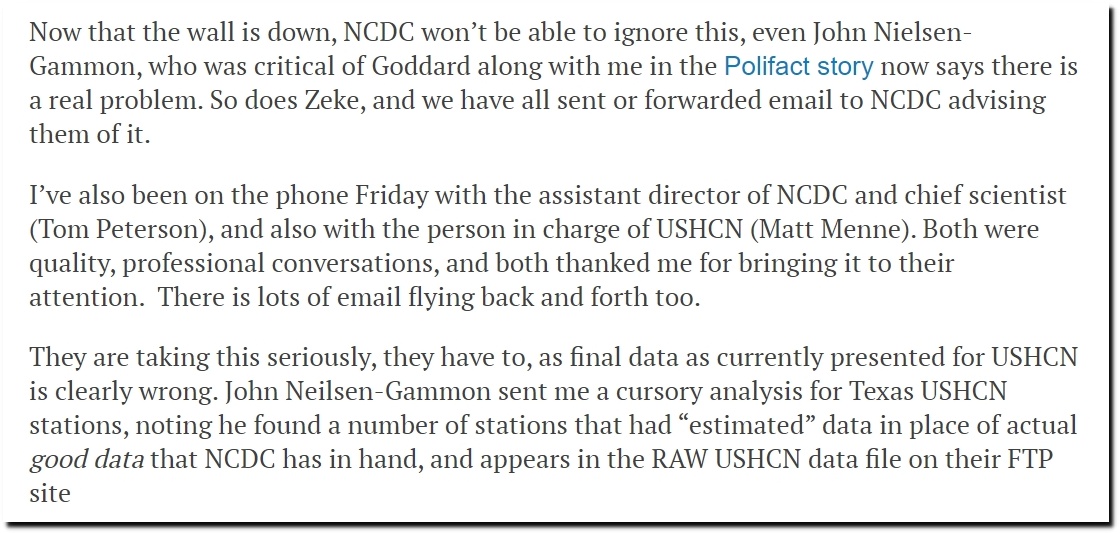
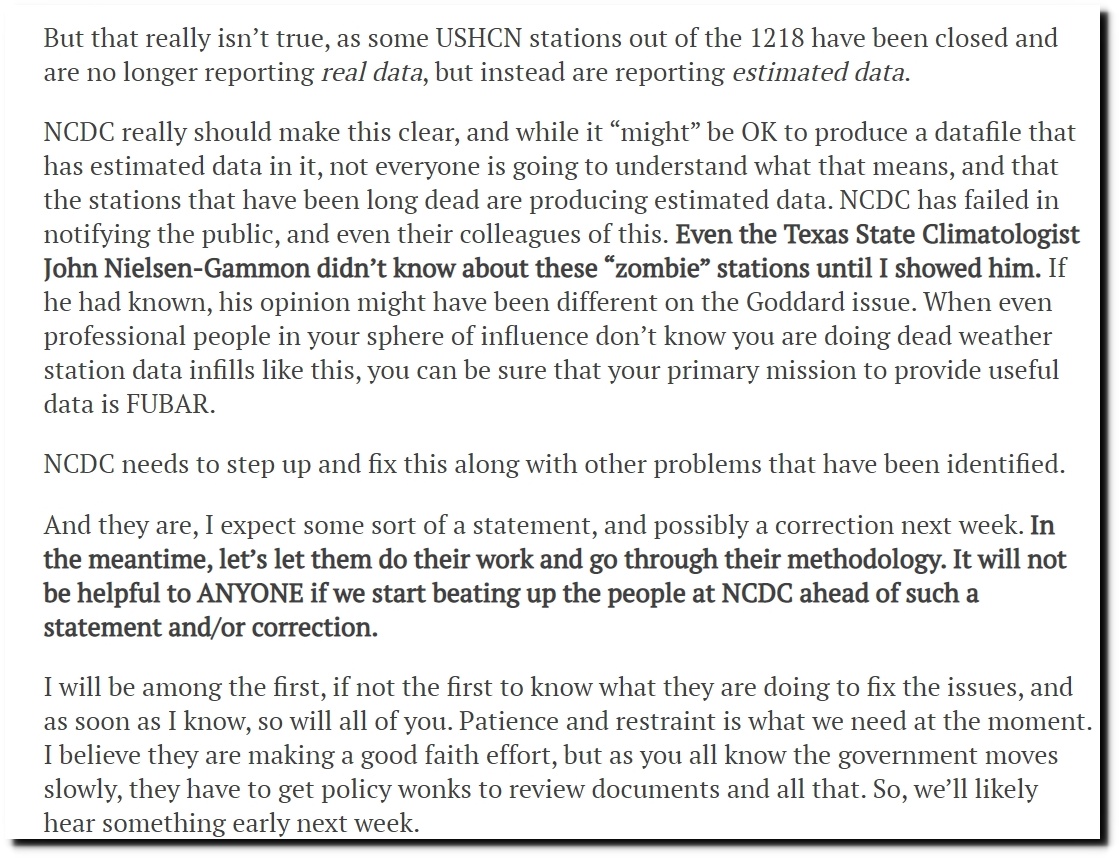
I pointed this out in 2014, and Anthony Watts originally disagreed with me – but later he came around and realized I was correct. He talked to Zeke and NOAA, and they acted shocked and surprised. Anthony thought they would fix it in a week.  But six years later the problem has only gotten worse.

Reality is that the data is being tampered with precisely to match the increase in atmospheric CO2.
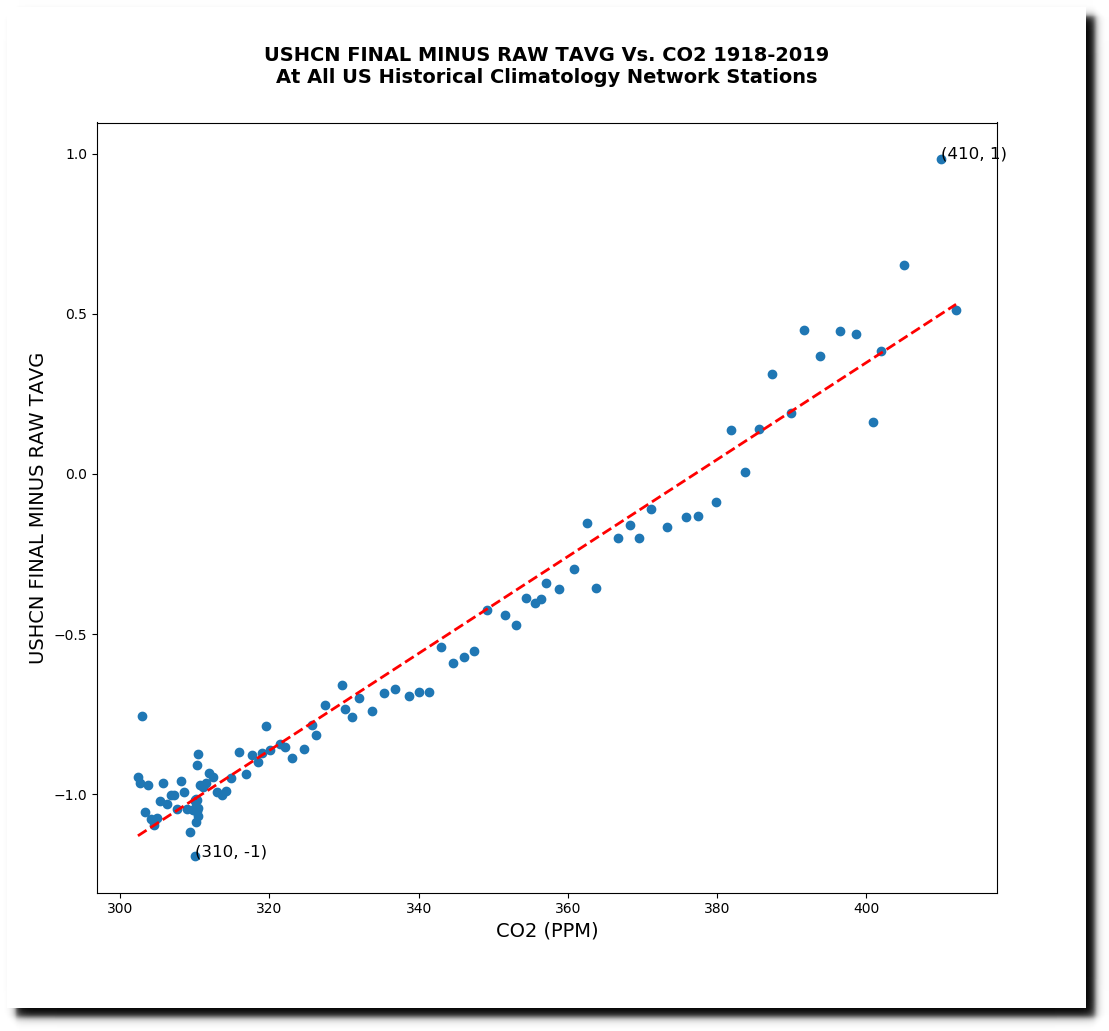
Posted in Uncategorized | Leave a comment

Third In Line For The Presidency

Posted in Uncategorized | Leave a comment

New Mexico Climate Crisis

Posted in Uncategorized | Leave a comment

Is There A Connection Between Journalists And Junk Science?

Infectious diseases and climate change: Is there a connection? | CBC News

Infectious disease death rates

Posted in Uncategorized | Leave a comment

Arctic Sea Ice Refuses To Melt As Ordered

Posted in Uncategorized | Leave a comment

Sea Ice Same Thickness As 60 Years Ago

Three years ago, climate alarmists announced that Arctic sea ice extent had dropped (at -30C)  to record low winter levels. Mark Serreze said “We’re heading for summers with no sea ice coverage at all.”

Arctic’s Winter Sea Ice Drops to Its Lowest Recorded Level – The New York Times

In 2008, Serreze predicted an ice-free North Pole that summer, and announced that the Arctic is screaming.

North Pole could be ice free in 2008 | New Scientist

Scientists: ‘Arctic Is Screaming,’ Global Warming May Have Passed Tipping Point | Fox News

Star-News – Google News Archive Search

Four years ago, he suggested that some sailors try to sail to the North Pole.

After unusual Arctic storms, sea ice coverage in region is plummeting

There has been no trend in Arctic sea ice extent since the start of MASIE records in 2006.

DATASETS/NOAA/G02186/masie_4km_allyears_extent_sqkm.csv

Ice extent is now “normal” – so climate alarmists have quite predictably determined that winter extent is no longer a relevant metric.

N_daily_extent.png (420×500)

Charctic Interactive Sea Ice Graph | Arctic Sea Ice News and Analysis

Now they want to focus on ice thickness, which is about two meters.

DMI Modelled ice thickness

Which is the same as 1958, when sea ice extent was low.

The Changing Face of the Arctic; The Changing Face of the Arctic – The New York Times

Projecting the climatic effects of increasing carbon dioxide 

In 1922, the region between the North Pole and Alaska was “new, thin, rotten ice.”

29 Jan 1922, Page 35 – The St. Louis Star and Times at Newspapers.com

Nothing is happening in the Arctic. I’ve been calling out this scam for twelve years.

Arctic ice refuses to melt as ordered • The Register

And Congressional Democrats want me silenced so that they can continue lying to the public about the Arctic climate, as well as the rest of the world.

Congress urges Google to act against climate misinformation on YouTube

Posted in Uncategorized | Leave a comment

4012 Days Left For The Planet

Posted in Uncategorized | Leave a comment

Sustainable Green Ponzi Schemes

About | DC Solar Solutions

Solar Incentives | DC Solar Solutions

How DC Solar Became a Renewable Energy Powerhouse (and a Major Player in Nascar) | Inc.com

Top Executives Plead Guilty to Participating in a Billion Dollar Ponzi Scheme—the Biggest Criminal Fraud Scheme in the History of the Eastern District of California | USAO-EDCA | Department of Justice

Posted in Uncategorized | Leave a comment

Democrats Demand An End To Free Speech

Posted in Uncategorized | Leave a comment

100% Reliable Green Energy

Posted in Uncategorized | Leave a comment