Python3 Script For Getting USHCN Monthly Temperatures

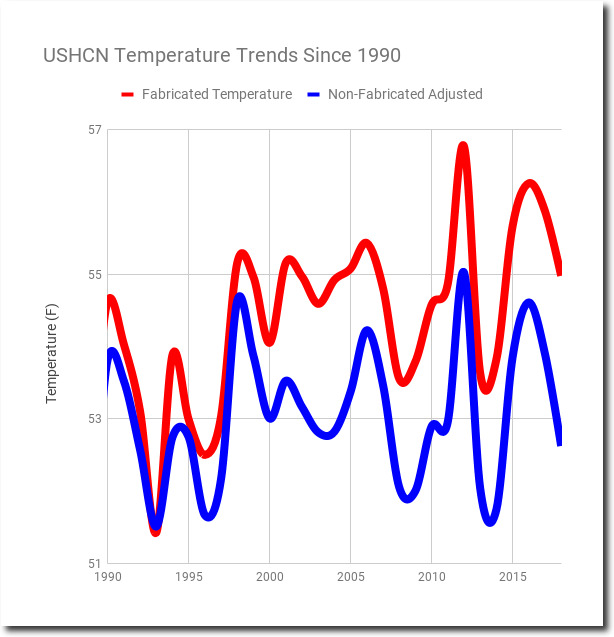
This script gives easy access to USHCN monthly raw, TOBS and Final adjusted temperatures.

Getting the data:
wget ftp://ftp.ncdc.noaa.gov/pub/data/ushcn/v2.5/ushcn.tavg.latest.FLs.52j.tar.gz
wget ftp://ftp.ncdc.noaa.gov/pub/data/ushcn/v2.5/ushcn.tavg.latest.tob.tar.gz
wget ftp://ftp.ncdc.noaa.gov/pub/data/ushcn/v2.5/ushcn.tavg.latest.raw.tar.gz
tar xzvf ushcn.tavg.latest.FLs.52j.tar.gz
tar xzvf ushcn.tavg.latest.tob.tar.gz
tar xzvf ushcn.tavg.latest.raw.tar.gz

wget ftp://ftp.ncdc.noaa.gov/pub/data/ushcn/v2.5/ushcn.tmax.latest.FLs.52j.tar.gz
wget ftp://ftp.ncdc.noaa.gov/pub/data/ushcn/v2.5/ushcn.tmax.latest.tob.tar.gz
wget ftp://ftp.ncdc.noaa.gov/pub/data/ushcn/v2.5/ushcn.tmax.latest.raw.tar.gz
wget http://cdiac.ornl.gov/ftp/ushcn_daily/ushcn-stations.txt
tar xzvf ushcn.tmax.latest.FLs.52j.tar.gz
tar xzvf ushcn.tmax.latest.tob.tar.gz
tar xzvf ushcn.tmax.latest.raw.tar.gz

wget ftp://ftp.ncdc.noaa.gov/pub/data/ushcn/v2.5/ushcn.tmin.latest.FLs.52j.tar.gz
wget ftp://ftp.ncdc.noaa.gov/pub/data/ushcn/v2.5/ushcn.tmin.latest.tob.tar.gz
wget ftp://ftp.ncdc.noaa.gov/pub/data/ushcn/v2.5/ushcn.tmin.latest.raw.tar.gz
tar xzvf ushcn.tmin.latest.FLs.52j.tar.gz
tar xzvf ushcn.tmin.latest.tob.tar.gz
tar xzvf ushcn.tmin.latest.raw.tar.gz

Then cd into the new directory, which will have a new name every day. It will be something like ushcn.v2.5.5.20191004

Example usage:
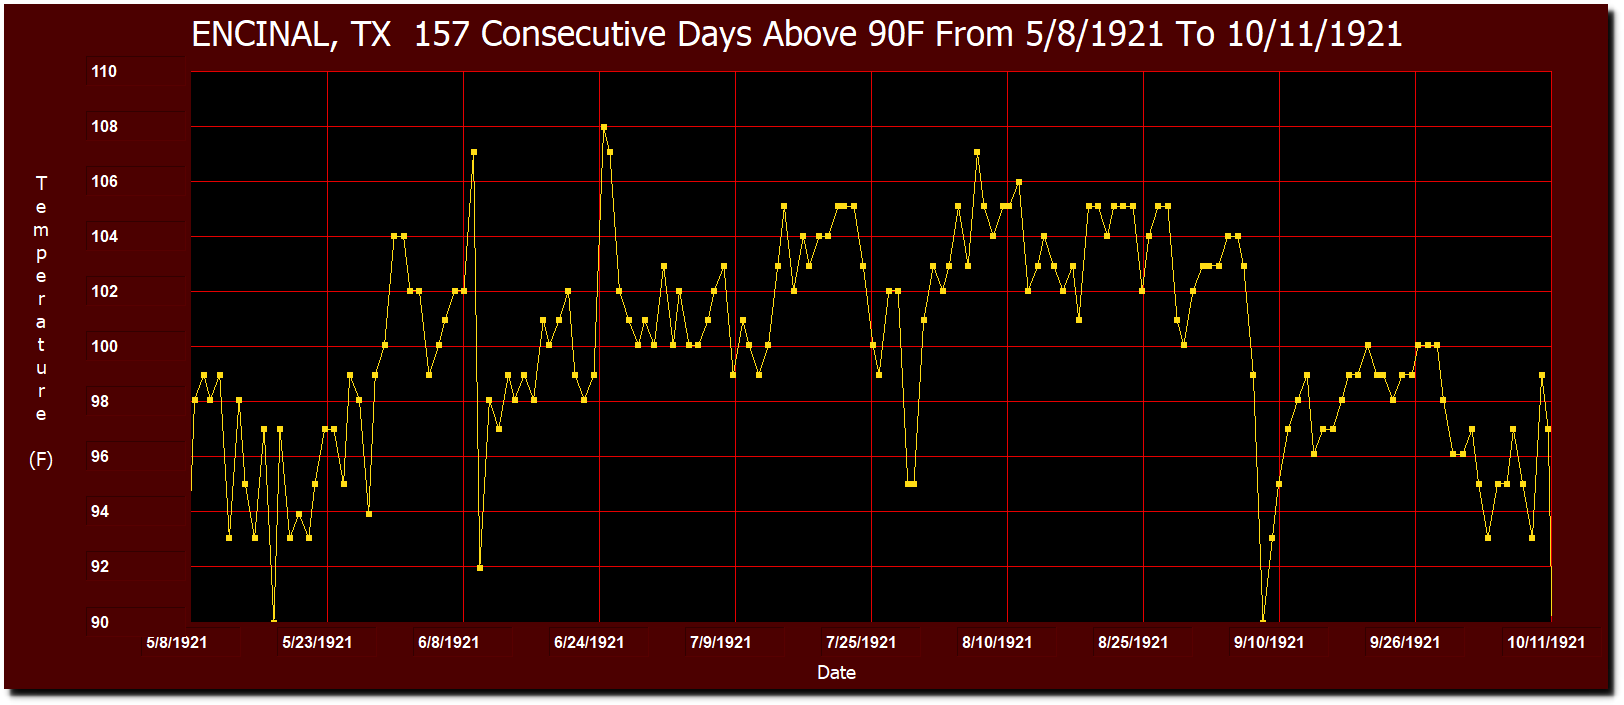
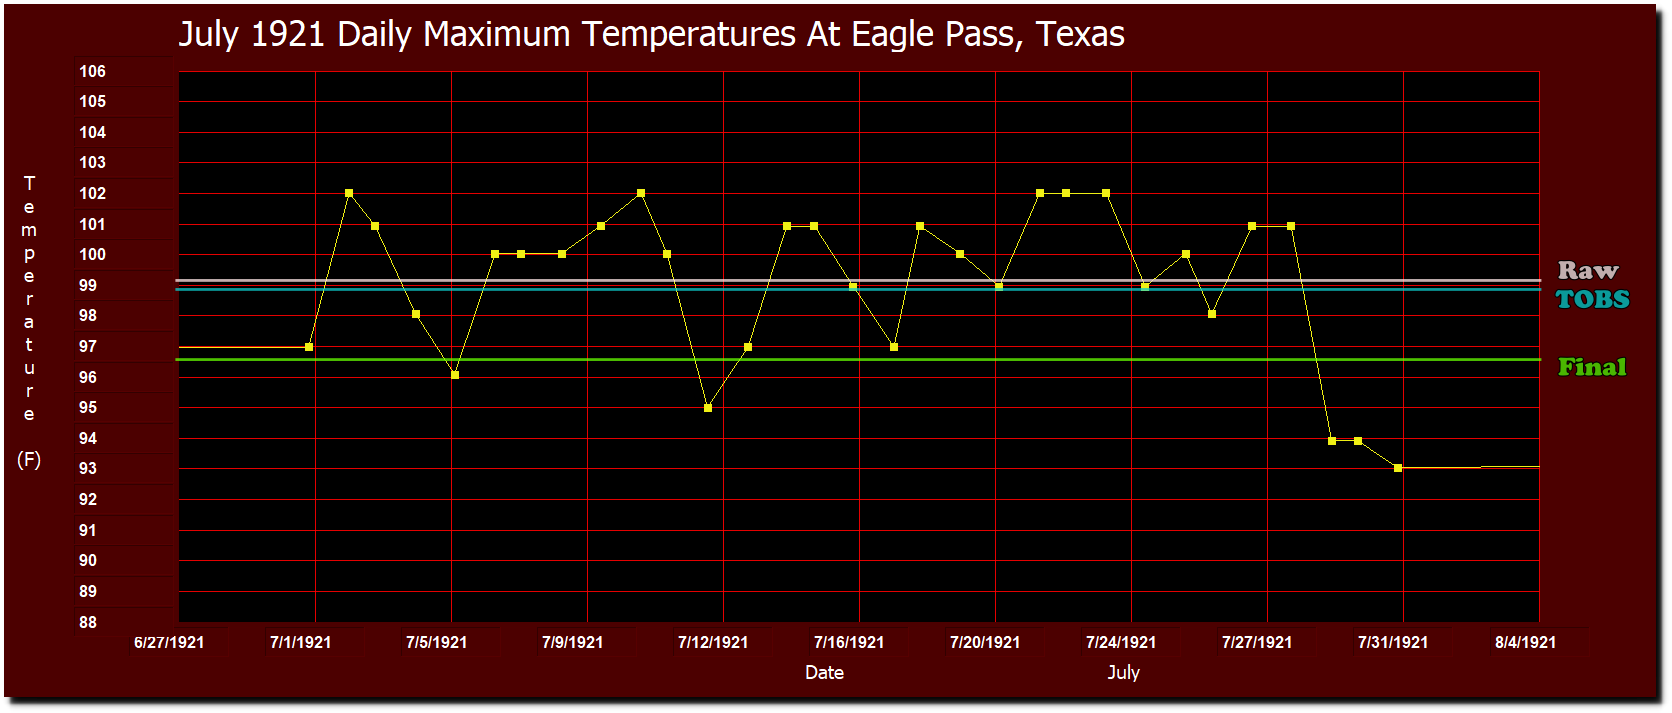
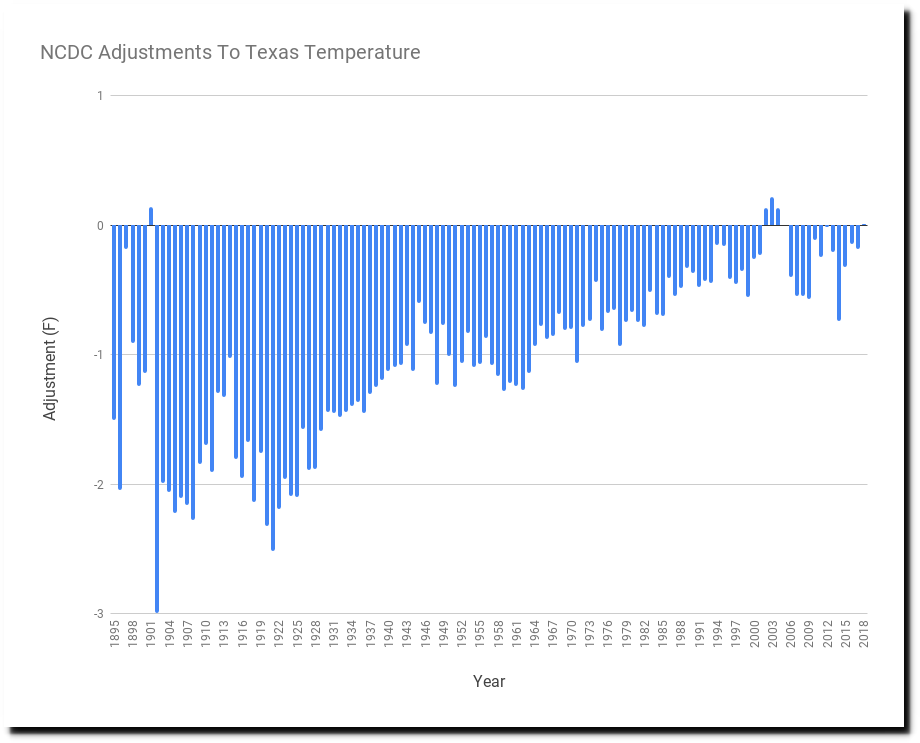
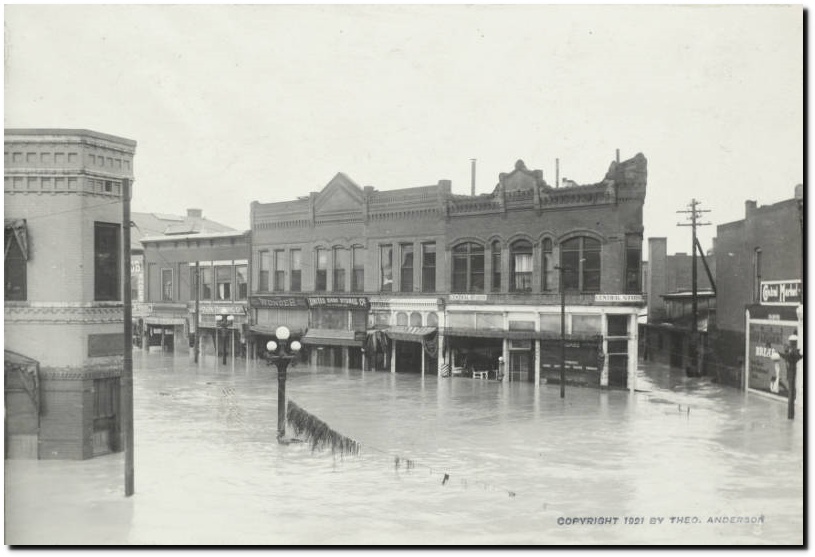
python3 date.py USH00412679 7 1921 “EAGLE PASS”

Data for July, 1921 at Eagle Pass, Texas.

output:
Raw EAGLE PASS USH00412679 7 1921 37.29 99.12
TOBS EAGLE PASS USH00412679 7 1921 37.16 98.89
Final EAGLE PASS USH00412679 7 1921 35.92 96.66

Last two numbers in each line are Degrees C and Degrees F

You will have to know the station ID of the station you are looking for:
ftp://ftp.ncdc.noaa.gov/pub/data/ushcn/v2.5/ushcn-v2.5-stations.txt

Script :
——————————————————————-

import sys

filename = sys.argv[1]
#print(filename)
#filename = filename.replace("USC", "USH")
#print(filename)
month = int(sys.argv[2])
year = sys.argv[3]
comment = sys.argv[4]

fd = open(filename + ".raw.tmax")

for line in fd :
    #print(line[12:16])
    if (line[12:16] == year) :
        #print(line)
        offset = 18 + (9 * (month - 1))
        #print(line[offset:offset+4])
        temperature_c = float(line[offset:offset+4]) / 100.0
        temperature_f = (temperature_c * 1.8) + 32.0
        print("Raw", comment, filename, month, year, "%.2f" % temperature_c, "%.2f" % temperature_f)

fd = open(filename + ".tob.tmax")

for line in fd :
#print(line[12:16])
    if (line[12:16] == year) :
        #print(line)
        offset = 18 + (9 * (month - 1))
        #print(line[offset:offset+4])
        temperature_c = float(line[offset:offset+4]) / 100.0
        temperature_f = (temperature_c * 1.8) + 32.0
        print("TOBS", comment, filename, month, year, "%.2f" % temperature_c, "%.2f" % temperature_f)

fd = open(filename + ".FLs.52j.tmax")

for line in fd :
    #print(line[12:16])
    if (line[12:16] == year) :
        #print(line)
        offset = 18 + (9 * (month - 1))
        #print(line[offset:offset+4])
        temperature_c = float(line[offset:offset+4]) / 100.0
        temperature_f = (temperature_c * 1.8) + 32.0
        print("Final", comment, filename, month, year, "%.2f" % temperature_c, "%.2f" % temperature_f)

Posted in Uncategorized | Leave a comment

Another Fast Start To Winter

Winter is coming early again this year.  We are expecting five inches of snow here in Boulder on Thursday. Montana had record snow last week. This is the eighth year in a row with above average October snow cover in the Northern Hemisphere.

Rutgers University Climate Lab :: Global Snow Lab

Posted in Uncategorized | Leave a comment

Smoking Gun Of Fraud In USHCN Adjustments

Texas had their longest heatwave at Encinal in 1921, with 157 consecutive days above 90F from May 8 to October 11, 1921.

The NOAA USHCN thermometer data for Texas shows 1921 as the hottest year, with Texas cooling since 1895.

Yet the NOAA NCEI graph for Texas shows Texas warming, and 1921 as not being a particularly hot year.

Climate at a Glance | National Centers for Environmental Information (NCEI)

This is very different from their 2012 version of the same graph, which showed 1921 as the hottest year, and no warming.

Climate scientists who have been claiming Texas is warming are totally wrong. | Watts Up With That?

This got me wondering – how did NOAA recently erase the record heat of 1921 in Texas? So I looked at the Raw, TOBS (Time of Observation Bias Adjusted) and Final Adjusted monthly maximum temperatures for Encinal, Texas in July, 1921.

During that month, temperatures at Encinal were recorded at 7am, and the TOBS adjusted data has the highest monthly average at 101.6F.  The Raw temperature average is 101.5F, but the Final Adjusted average is 4.6F cooler at 96.9 degrees. Note that nothing in the graph below is calculated – all of the data being plotted is taken directly from the NOAA USHCN daily and monthly data sets.

The Final adjusted monthly maximum average of 96.9F is cooler than 29 out of 31 daily maximum temperatures at Encinal.

Encinal’s neighboring USHCN stations which reported for the full month of July, 1921 are Falfurrias, Eagle Pass, and Alice, Texas.

Falfurrias is a similar story. All but two of the days were above the final adjusted temperature, which was 5.8 degrees cooler than the measured temperature and 5.5 degrees cooler than the TOBS adjusted temperature.

At Eagle Pass, all but five of the days were above the final adjusted temperature, which was 2.4 degrees cooler than the measured temperature and 2.2 degrees cooler than the TOBS adjusted temperature.

At Alice, all but eight of the days were above the final adjusted temperature, which was 2.3 degrees cooler than the measured temperature and 2.4 degrees cooler than the TOBS adjusted temperature.

So you can’t explain the adjustments by Time of Observation bias adjustments, and you can’t explain them by homogenization either – because all of the neighbors show the same pathological symptoms.

This is science and mathematics at its absolute worst. NOAA is making a farce out of climate science with this sort of mathematical nonsense.

The only legitimate explanation for this is that the Final adjusted data is fraudulent.  And it is clear from the changes to NOAA Texas graphs that this is occurring all over Texas. Across the entire state of Texas, 1921 temperatures are adjusted downwards by an average of 2.5 degrees. There is no plausible explanation for why this is being done.

Posted in Uncategorized | Leave a comment

Only Global Communism Can Prevent 1-4 Meters Of Sea Level Rise By 2030

In 1988, the Guardian , UK Commonwealth and Canberra Times said we needed global communism to prevent 1-4 meters of sea level rise by the year 2030.  Because this is all about the best science by our top scientists.

26 Jan 1989 – Call for anti-greenhouse action – Trove

Posted in Uncategorized | Leave a comment

Politifiction

Micheal Mann and Snopes both did hit pieces on me this week. I must be making them nervous. Here is the Snopes article.

Since 2014, climate-change deniers have squeezed millions of views, Facebook shares, and Twitter retweets by retelling a story alleging the discovery of “faked” NASA data designed to “fit a climate change narrative.” Though copied almost wholesale from a blog post

The blog post was one I made in 2o12. But instead of pointing to my web site, they linked to an archived version – most likely to keep people from visiting my blog. It included this animation, showing NASA data tampering.

They go on :

The “smoking gun” concerns a climate record known as the NASA Goddard Institute for Space Studies Surface Temperature Analysis (GISTEMP). These records are based on a massive global dataset of temperature stations from around the world, combining several collections of data originally collected by individual weather stations. The record provides “a measure of the changing global surface temperature with monthly resolution for the period since 1880, when a reasonably global distribution of meteorological stations was established.”

This is what Snopes describes as a “reasonably global distribution of meteorological stations”  The map shows where GHCN has daily temperature data from 1890.

ftp://ftp.ncdc.noaa.gov/pub/data/ghcn/daily/figures/station-counts-1861-1890-temp.png

Then they went to their go-to man, Zeke Hausfather, who told them :

All told, the most significant effect of all these changes came from the time-of-day adjustments. Collectively, the adjustments served to produce a slightly increased warming trend in the United States record compared to the earlier records.

This is complete nonsense. TOBS (time of day) is about one third of the total adjustment, and goes the opposite direction of the massive upwards adjustments since the year 2005.

Snopes made no attempt to contact me.  Had they done that they would have known that essentially all of the adjustments since 1990 are due to fake data.

In the 1999 paper where I got the NASA temperature graph, Hansen complained that the US is cooling.

Yet in the U.S. there has been little temperature change in the past 50 years, the time of rapidly increasing greenhouse gases — in fact, there was a slight cooling throughout much of the country.

Snopes described this switch from cooling to rapid warming as :

Collectively, the adjustments served to produce a slightly increased warming trend in the United States record compared to the earlier records.

This is what they call a “slightly increased warming trend.”

Climate journalism is a complete shambles, and has nothing to do with actual journalism.

Posted in Uncategorized | Leave a comment

New Video : Erasing 1921

Posted in Uncategorized | Leave a comment

New Video : Setting The Record Straight

Posted in Uncategorized | Leave a comment

Messing With Texas

NCDC adjusted data shows a strong warming trend in Texas.

Climate at a Glance | National Centers for Environmental Information (NCEI)

The underlying measured data shows a strong cooling trend, with 1921 as the hottest year.

This graph shows both adjusted and measured.

Spreadsheet    Data

This graph shows the adjustments, older temperatures have been massively cooled.

In 2012, the San Antonio Express News said Texas is not warming, based on NCDC data.

Mims: Research shows Texas is not warming – San Antonio Express-News

And Anthony Watts captured this graph from NCDC in that same year.   They hadn’t erased the heat of 1921 yet.

Climate scientists who have been claiming Texas is warming are totally wrong. | Watts Up With That?

We can see that the tampering with Texas data has gotten much worse over the past seven years. The biggest fraud in science history.

Posted in Uncategorized | Leave a comment

Bernie : Kill Babies To Stop Climate Change

(15) Tony Heller on Twitter: “Bernie wants to kill babies to “fight climate change” 

Nothing new about that idea. Politicians have been doing that for centuries.

Posted in Uncategorized | Leave a comment

1921 : Earth Had A Fever

On this date in 1921, the New York Times reported that Earth had a fever.

TimesMachine: October 3, 1921 – NYTimes.com

04 Sep 1921, 61 – New York Herald at Newspapers.com

11 Oct 1921 – Heat Wave – Trove

11 Oct 1921 – PHENOMENAL WEATHER. – Trove

11 Feb 1921, Page 2 – The Washington Post at Newspapers.com

21 Sep 1921, 3 – News-Journal at Newspapers.com

There was a large solar storm on May 15 of that year.

(PDF) The 1859 space weather event revisited: Limits of extreme activity

15 May 1921, 7 – Austin American-Statesman at Newspapers.com

15 May 1921, 1 – Chattanooga Daily Times at Newspapers.com

15 May 1921, 55 – The San Francisco Examiner at Newspapers.com

Pueblo, Colorado was largely wiped out by a flood during June, 1921.  Much of Kansas suffered damage, and there was flooding on the Pecos River in New Mexico and Texas.

06 Jun 1921, 1 – The Arkansas City Daily News at Newspapers.com

It is estimated that 1,500 people in Pueblo, Colorado died during that flood.

Microsoft Word – Document1

The average maximum temperature in the US during 1921 was second highest on record after 1934.

It wasn’t due so much to extreme heat like the 1930’s, but more to persistent heat.

It was the hottest year on record in Texas.

Reality doesn’t suit the political agenda of NOAA, so they have completely erased the past heat in Texas and turned sharp cooling into sharp warming.

Climate at a Glance | National Centers for Environmental Information (NCEI)

Texas also had their longest heatwave at Encinal in 1921, 157 consecutive days above 90F from May 8 to October 11, 1921.

Beaufort, South Carolina was over 90 degrees every day during September, 1921 – the South Carolina record.

Glennville, Georgia had 29 days over 90 degrees during September, 1921 – the Georgia record for September.

Lumberton, North Carolina’s had 27 days over 90 degrees during September 1921, the North Carolina record for September

Posted in Uncategorized | Leave a comment