Smoking Gun Of Fraud In USHCN Adjustments

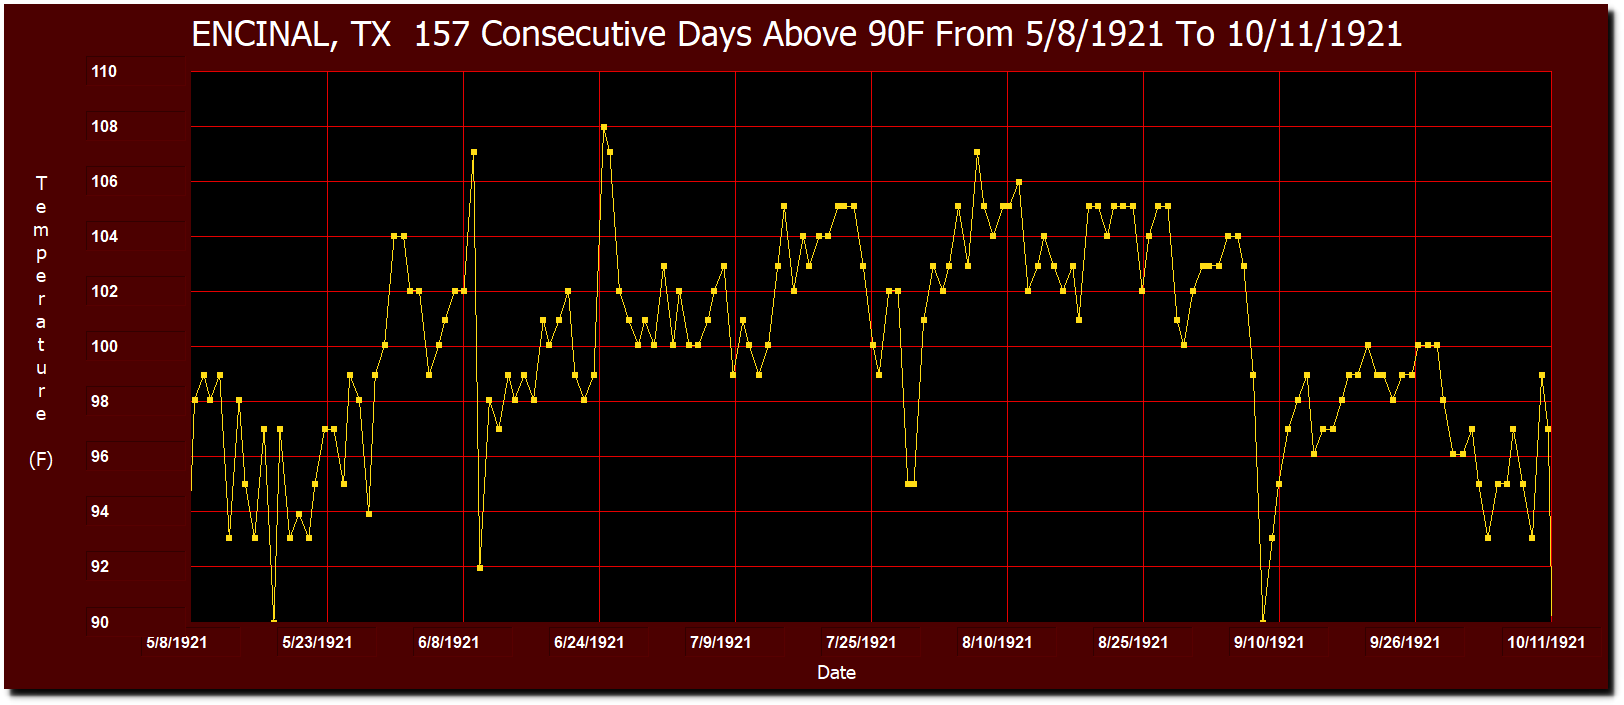
Texas had their longest heatwave at Encinal in 1921, with 157 consecutive days above 90F from May 8 to October 11, 1921.

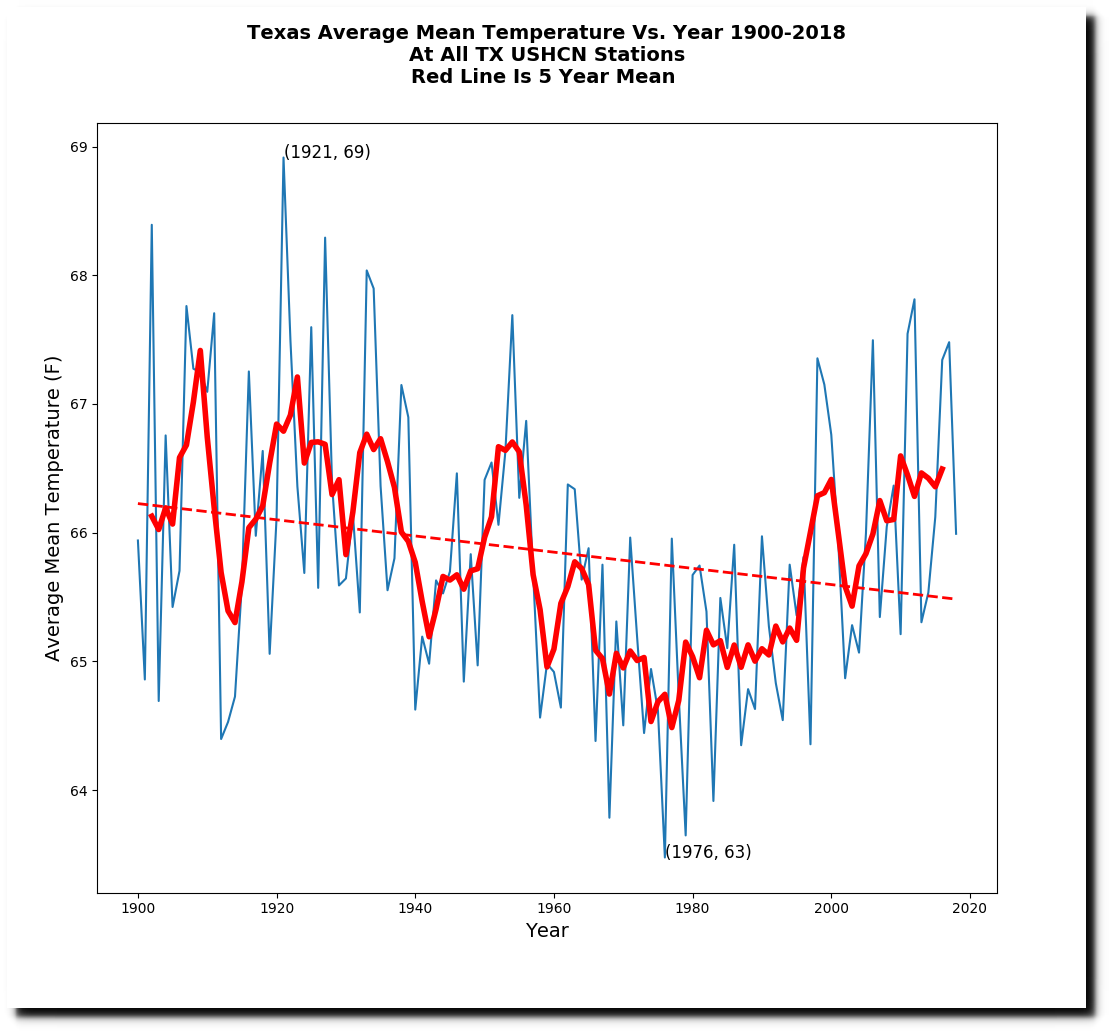
The NOAA USHCN thermometer data for Texas shows 1921 as the hottest year, with Texas cooling since 1895.

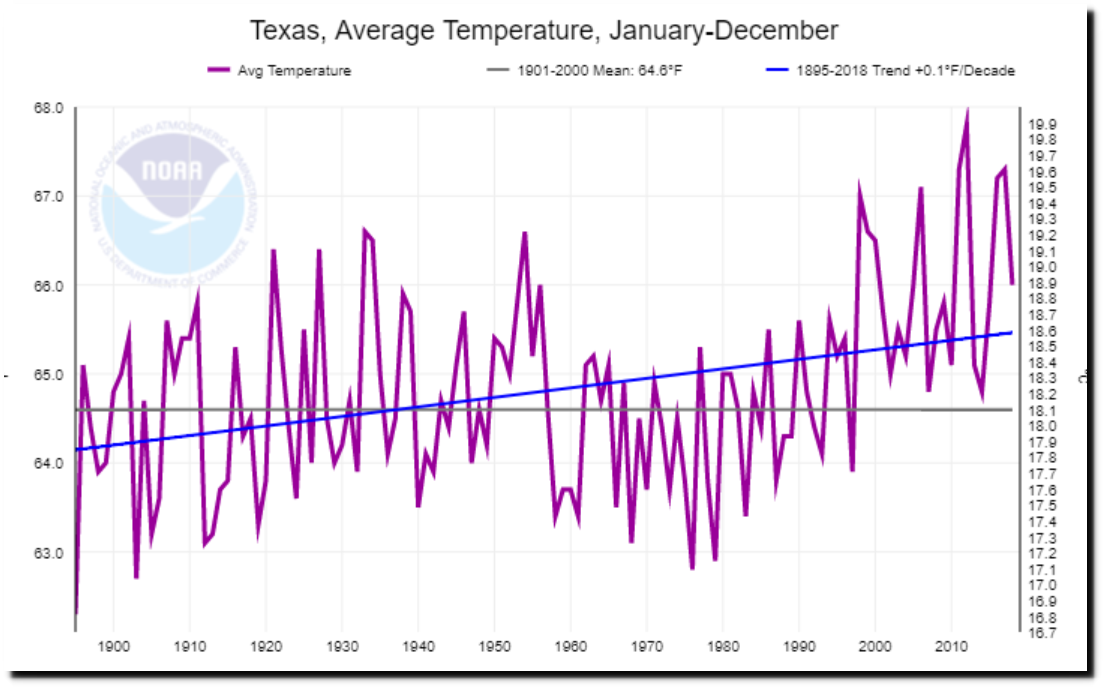
Yet the NOAA NCEI graph for Texas shows Texas warming, and 1921 as not being a particularly hot year.

Climate at a Glance | National Centers for Environmental Information (NCEI)

This is very different from their 2012 version of the same graph, which showed 1921 as the hottest year, and no warming.

Climate scientists who have been claiming Texas is warming are totally wrong. | Watts Up With That?

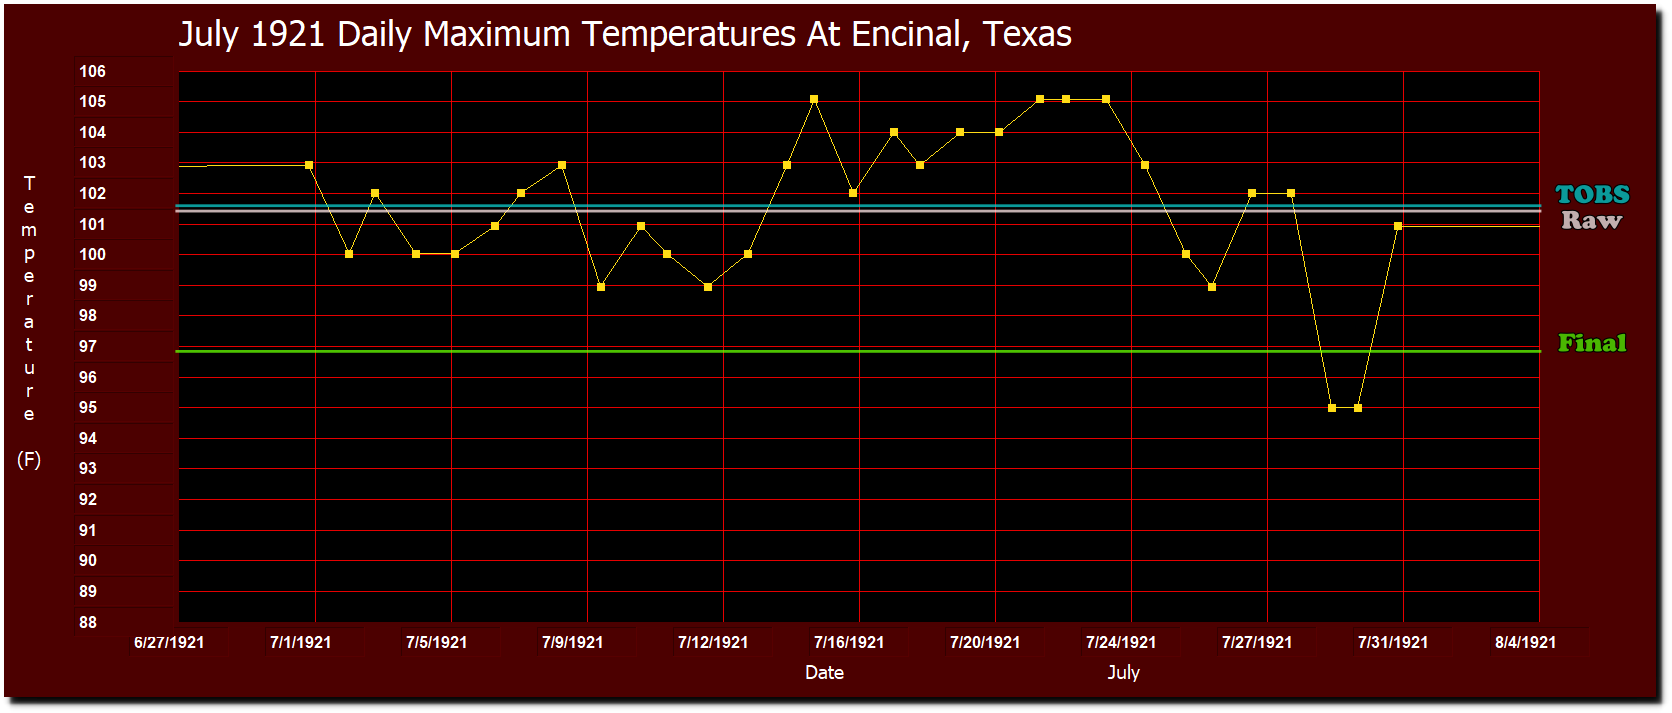
This got me wondering – how did NOAA recently erase the record heat of 1921 in Texas? So I looked at the Raw, TOBS (Time of Observation Bias Adjusted) and Final Adjusted monthly maximum temperatures for Encinal, Texas in July, 1921.

During that month, temperatures at Encinal were recorded at 7am, and the TOBS adjusted data has the highest monthly average at 101.6F.  The Raw temperature average is 101.5F, but the Final Adjusted average is 4.6F cooler at 96.9 degrees. Note that nothing in the graph below is calculated – all of the data being plotted is taken directly from the NOAA USHCN daily and monthly data sets.

The Final adjusted monthly maximum average of 96.9F is cooler than 29 out of 31 daily maximum temperatures at Encinal.

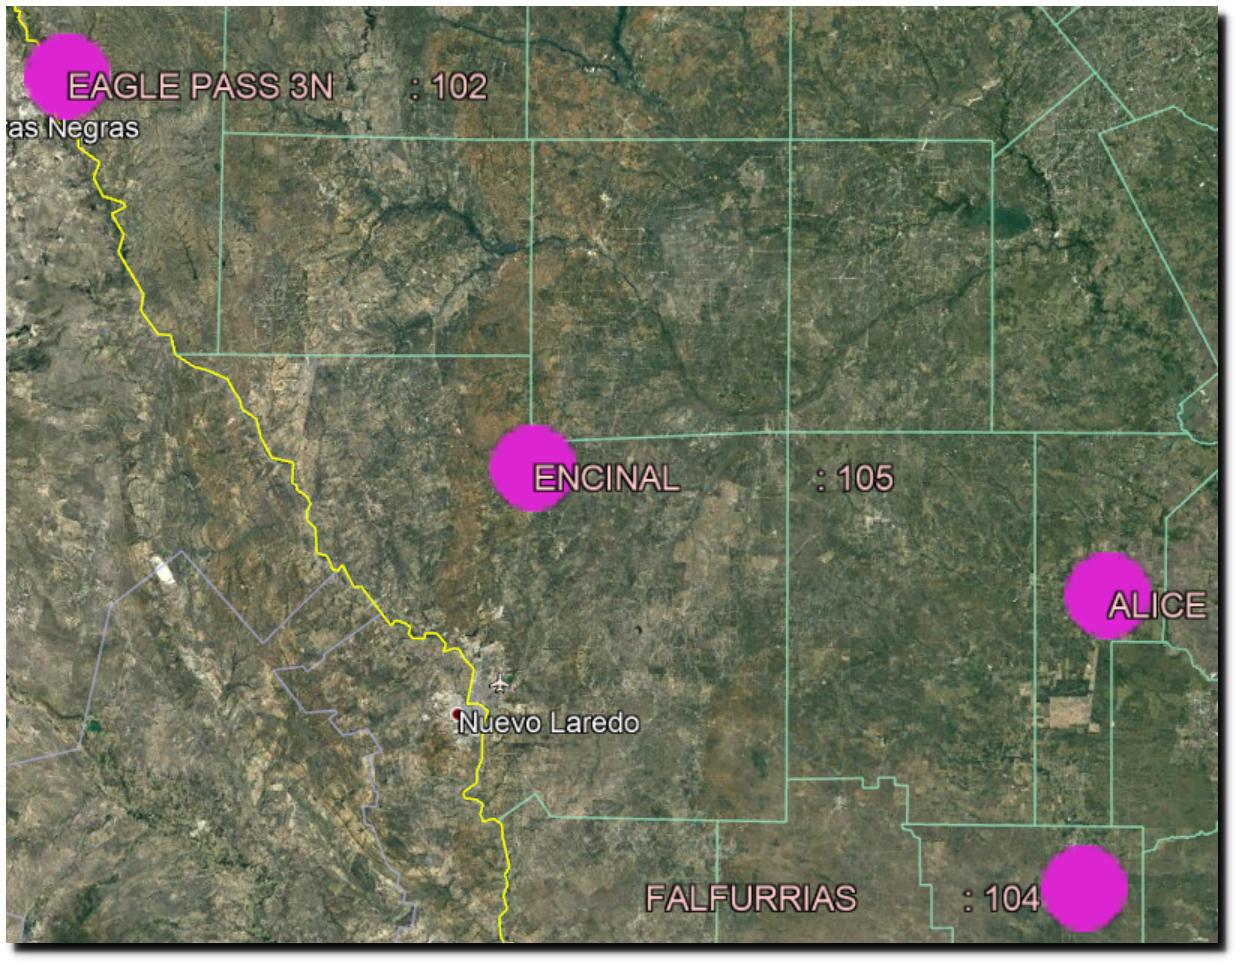
Encinal’s neighboring USHCN stations which reported for the full month of July, 1921 are Falfurrias, Eagle Pass, and Alice, Texas.

Falfurrias is a similar story. All but two of the days were above the final adjusted temperature, which was 5.8 degrees cooler than the measured temperature and 5.5 degrees cooler than the TOBS adjusted temperature.

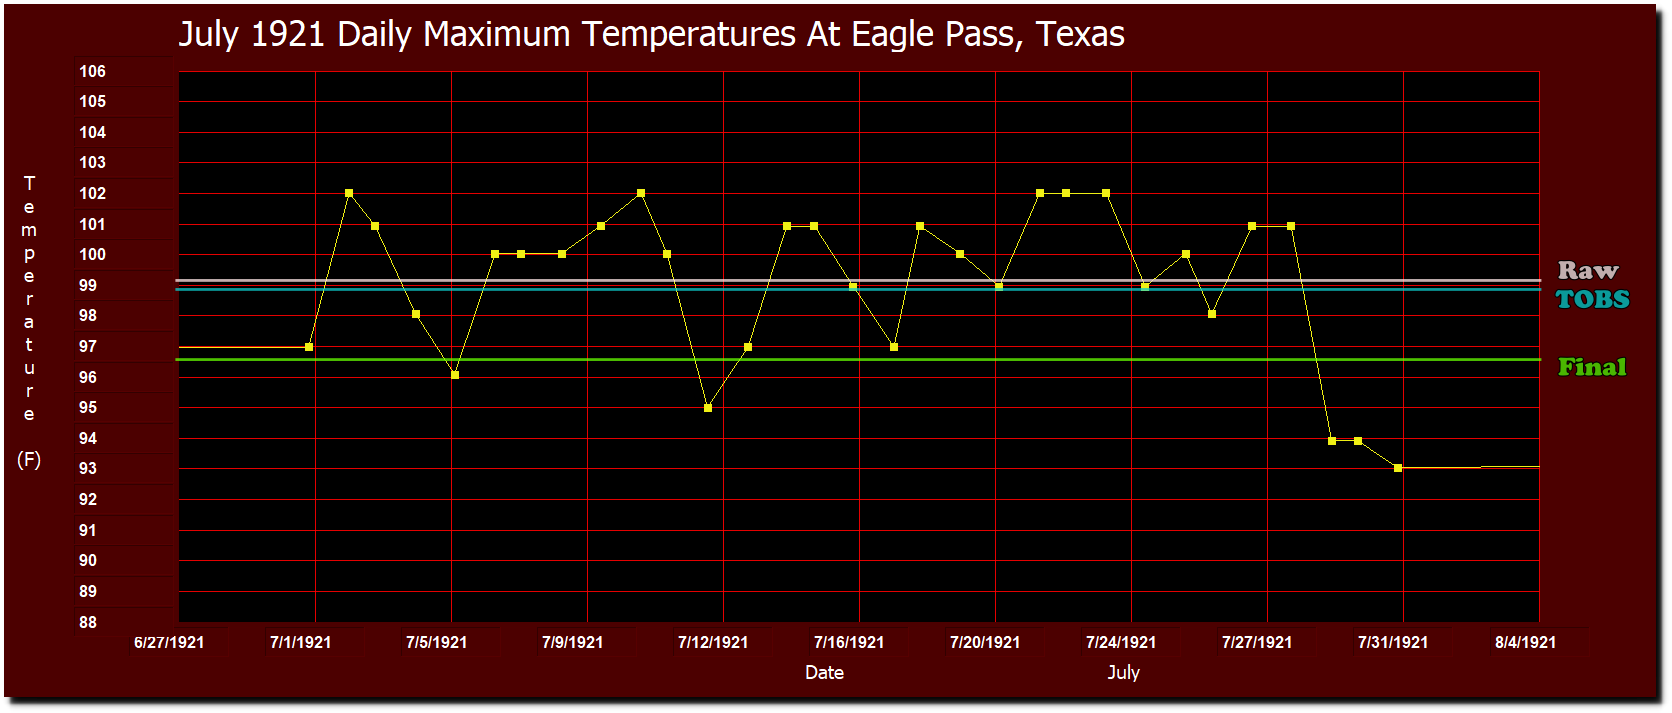
At Eagle Pass, all but five of the days were above the final adjusted temperature, which was 2.4 degrees cooler than the measured temperature and 2.2 degrees cooler than the TOBS adjusted temperature.

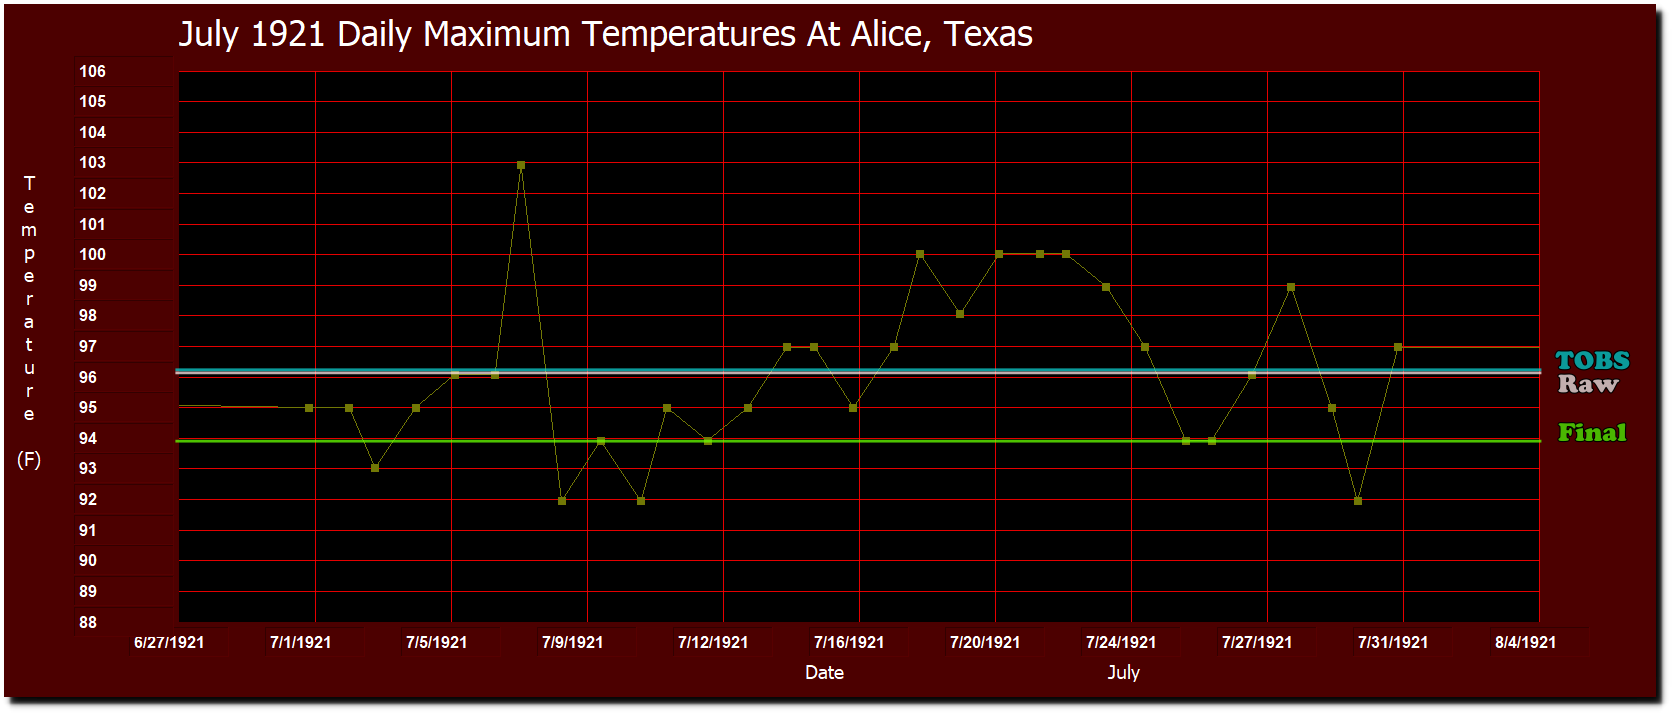
At Alice, all but eight of the days were above the final adjusted temperature, which was 2.3 degrees cooler than the measured temperature and 2.4 degrees cooler than the TOBS adjusted temperature.

So you can’t explain the adjustments by Time of Observation bias adjustments, and you can’t explain them by homogenization either – because all of the neighbors show the same pathological symptoms.

This is science and mathematics at its absolute worst. NOAA is making a farce out of climate science with this sort of mathematical nonsense.

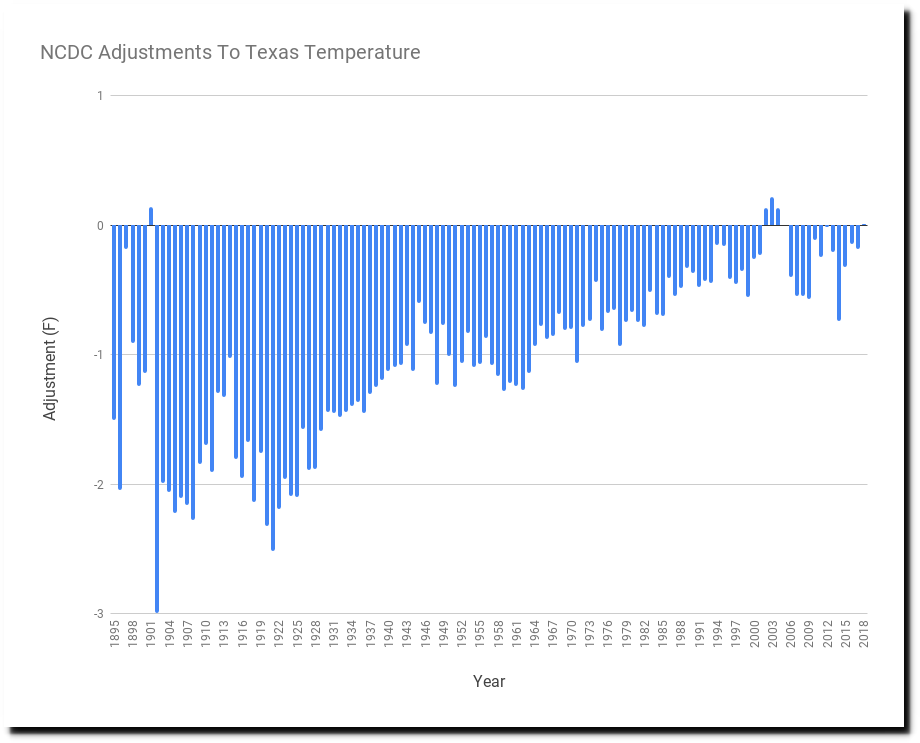
The only legitimate explanation for this is that the Final adjusted data is fraudulent.  And it is clear from the changes to NOAA Texas graphs that this is occurring all over Texas. Across the entire state of Texas, 1921 temperatures are adjusted downwards by an average of 2.5 degrees. There is no plausible explanation for why this is being done.
This entry was posted in Uncategorized. Bookmark the permalink.

16 Responses to Smoking Gun Of Fraud In USHCN Adjustments

  1. Gator says:

    But Phail says that homogenization fixes everything that they do not, and cannot measure. We’ve always been at war with Eastasia.

  2. Fairthorpe says:

    Average height parallax, that’s the latest NOAA/NASA explanation. They prove conclusively that it wasn’t hot at all back then.

    Since human beings were shorter on average back then, their line of sight was upward from their shorter stature below the thermometer to the top of the mercury column. Their straight line of sight continued upwards to the temperature scale, falling then on a much higher number. NASA/NOAA have determined the parallax error to be 4 to 7 degrees F.

    People just think it was hot them because there was no air conditioning. It’s much hotter today.

    • Taphonomic says:

      Especially if your thermometer is now right outside the exhaust of your new air conditioner.

      • Fairthorpe says:

        And today, the average thermometer readers average height is much taller. The reader has to look downward to the thermometer, his gaze I’d from above the top of the mercury column downward to the scale behind, giving a parallax reading much cooler than actual. NASA/NOAA has again scientifically determined in peer reviewed studies that this is now 3 to 5 degrees F.

        That’s why all current temperatures are adjusted upwards. The reader’s offices are air conditioned. They think it’s cooler than it actually is. 2019 is a record hot year by 0.0073°F.

        This is known as Compensating for Readers Average height Parallax (C. R. A. P.)

      • wtforg says:

        This is science now. Compensating for perceived people lack of thermometer reading ability.

        OMG. I have an elixir that fully removes the co2 from your breath. It’ll only cost you 5 cents per breath.

    • Lyndon B Mansell says:

      I hope you are being sarcastic. To say that scientists were not competent enough to adjust either their viewpoint or Thr height of the device is a terrible insult. Why would they put Thr thermometer too high to start with, or are humans getting talker and shorter with the temperature ?

      • Chuck says:

        His last entry reads ends with “This is known as Compensating for Readers Average height Parallax (C. R. A. P.) Snark confirmed.

    • ANDREW STOUT says:

      That gets us half way there, but do you realize that human eyes also had a greater average curvature, resulting in a lensing effect distorting how one actually sees the instruments: this can be offset by .5 to 2 degrees F correction

  3. rah says:

    Been through all those places mentioned more than once. Slept at Encinal and Eagle Pass multiple times. One of the great things about driving Texas is the 65 or even 70 mph speed limits on so many US and state highways and even secondary (FM) roads, many of which have generous paved shoulders. Thus one can avoid traffic backups in along I-35 in Austin, San Antonio, and Dallas without losing much time and see new scenery along the way.
    I await the excuses from the Alarmists.

  4. Adonis says:

    Hi Tony,
    I just posted the a request on youtube but in case you don’t see it here it is again: can you please send me the link to your code?

    Thank you

  5. Emslander says:

    Tony, I hope that you have some official inside these agencies to whom you can report your analyses. In light of current news, there has to be a criminal element to this. We’re talking about the alteration of official records for the purpose of personal financial gain. Each agency has an Inspector General. Is anyone keeping track of all this?

  6. Bob says:

    Does NOAA publish their work on temperature adjustments so that it can be peer reviewed?

    Or is everyone supposed to just take their word that their work is divinely inspired and therefore infallible?

    • Disillusioned says:

      I once read a paper from about 16 years ago explaining their first TOBs adjustments. Ever since, there appears to have been many more adjustments, but am unaware of a paper each time explaining them. It just seems to happen. So, in short, I think your latter sentence is correct. Today’s post-modern temperature dataset doesn’t have to fit what was measured. But it must fit the hyped-pothesis they are supporting!

  7. Chuck says:

    After exposing the hackery of the fine woke folks at Snopes, shouldn’t we at least give them the honorary title of “leading climate scientists”.

  8. ajspades19 says:

    Throughout all of this you provide zero links or evidence of temperature adjustment.

    The supposed 2011 analysis is missing from all your links.

    Using “evidence” that can not be verified, tested, or proven incorrect is a classic conspiracy theorist ploy which is common among denialists, luddites, and anti-science apologists.

    Let’s run this all down, ignoring for the moment only one video has been given which itself gives no sources, data, or evidence, instead just linking to one page known for climate denial propaganda.

    Initial link
    Smoking Gun of Climate Fraud
    https://www.youtube.com/watch?v=-JkEEq3k8yM
    Premiered Oct 6, 2019 by Tony Heller
    This video is a response to Snopes hit piece from this week, and uses a new approach to show unequivocally that NOAA adjustments to US temperature are fraudulent.
    Data: Data here : https://realclimatescience.com/2019/1…

    This links to:
    Smoking Gun Of Fraud In USHCN Adjustments
    https://realclimatescience.com/2019/10/smoking-gun-of-fraud-in-ushcn-adjustments/
    Posted on October 6, 2019 by tonyheller

    First claim – image, no link, only one location
    – – “Texas had their longest heatwave at Encinal in 1921, with 157 consecutive days above 90F from May 8 to October 11, 1921.”

    Second claim – image, no link, misleading title and trendline (solid line is 5-year mean, dashed line has no information)
    – – “The NOAA USHCN thermometer data for Texas shows 1921 as the hottest year, with Texas cooling since 1895.”

    Third claim – image, misleading caption, 1921 was the hottest year until ~1998
    – – “Yet the NOAA NCEI graph for Texas shows Texas warming, and 1921 as not being a particularly hot year.”
    – – link: https://www.ncdc.noaa.gov/cag/statewide/time-series/41/tavg/12/12/1895-2019?base_prd=true&begbaseyear=1901&endbaseyear=2000&trend=true&trend_base=10&begtrendyear=1895&endtrendyear=2019

    The data shows a warming trend.
    Hawaii is not included in the data.
    Either the source is correct and there is warming, or the source isn’t correct and no conclusions can be reached. Since the original video uses this information, the video must think it is reliable.
    – If so, then other pieces of data from the same source should also be reliable.
    – If so, the other data also shows warming trends in the vast majority of states.
    – – Alabama and Mississippi having flat or slightly decreasing trends
    – The data shows the hottest years after 2000 with the following exceptions:
    – – Alabama, ~1920
    – – Idaho, ~1932
    – – Kentucky, ~1920
    – – Louisiana, ~1920
    – – Mississippi, ~1922
    – – Tennessee, ~1920
    – – Utah, ~1934

    The above indicate the 1930s was NOT the hottest decade in the US.

    FOURTH CLAIM – image,
    – – link: https://wattsupwiththat.com/2012/04/27/climate-scientists-who-have-been-claiming-texas-is-warming-are-totally-wrong/ ; known climate denialist page, blog site, not peer reviewed, not published in science journal
    – – “This is very different from their 2012 version of the same graph, which showed 1921 as the hottest year, and no warming.”

    Climate scientists who have been claiming Texas is warming are totally wrong.
    https://wattsupwiththat.com/2012/04/27/climate-scientists-who-have-been-claiming-texas-is-warming-are-totally-wrong/
    Anthony Watts / April 27, 2012

    Link:
    http://www.ncdc.noaa.gov/temp-and-precip/time-series/index.php?parameter=tmp&month=12&year=2011&filter=ytd&state=41&div=0
    Dead link, how convenient
    Not Found

    The requested URL /temp-and-precip/time-series/index.php was not found on this server.

    – Using the actual website
    https://www.ncdc.noaa.gov/cag/statewide/time-series/41/tavg/12/12/1895-2011?base_prd=true&begbaseyear=1901&endbaseyear=2000&trend=true&trend_base=10&begtrendyear=1895&endtrendyear=2019&filter=true&filterType=binomial

    We see a warming trend from 1895-2011.

    The blog goes on to list many other unsubstantiated assumptions and accusations with an additional reference:

    Link: local newspaper, not peer reviewed, not published in science journal; image, no link or attribution,
    Mims: Research shows Texas is not warming
    https://www.mysanantonio.com/life/article/Research-shows-Texas-is-not-warming-3498409.php
    Forrest Mims|April 23, 2012

    Includes a link:
    https://www.ncdc.noaa.gov/temp-and-precip/time-series/index.php?parameter=tmp&month=1&year=2011&filter=%201&state=41&div=0
    Another dead link

    The denialist blog also gives a reference and link to:

    Dr. Daniel Boice of the Southwest Research Foundation studied the temperature at New Braunfels and San Antonio from 1946 to 1990.
    http://www.swri.org/3pubs/ttoday/fall97/heat.htm

    This link doesn’t go to the intended report, instead of being a dead link, it goes to the following page:
    – – https://www.swri.org/newsroom

    There are, in fact, only two search results for “Daniel Boice” on the SWRI site:
    – – https://www.swri.org/search/results/%E2%80%9CDaniel%20Boice%E2%80%9D

    While a search for “Boice” provides more results [https://www.swri.org/search/results/%E2%80%9CBoice%E2%80%9D], none are related to meteorology, weather, climate, or the so called “heat island”.

    Searches for “heat island”, “New Braunfels”, and “San Antonio” do not give any results relating to Daniel Boice.
    However, search results for “climate change” show numerous sites and articles supporting the scientific consensus for anthropogenic climate change and global warming as well as the need to reduce greenhouse gas emissions.
    https://www.swri.org/global-change-climate-change-impact-assessments
    https://www.swri.org/sites/default/files/brochures/carbon-capture.pdf
    https://www.swri.org/node/1838776
    https://www.swri.org/carbon-capture

    • Billy says:

      ajspades19 , alarmist such as you will never be convinced of the truth until your own toes freeze off. Then however, before admitting that you were wrong, you will concoct some convoluted explanation as to why they turned black and fell off. It’s simple, the sun heats the earth. Occam’s razor.

Leave a Reply

Your email address will not be published. Required fields are marked *