NOAA Official : 124 Degrees In The Tasmanian Mountains

I was looking at the entire temperature record for Australia this morning, and noticed two very hot temperatures in 2019.

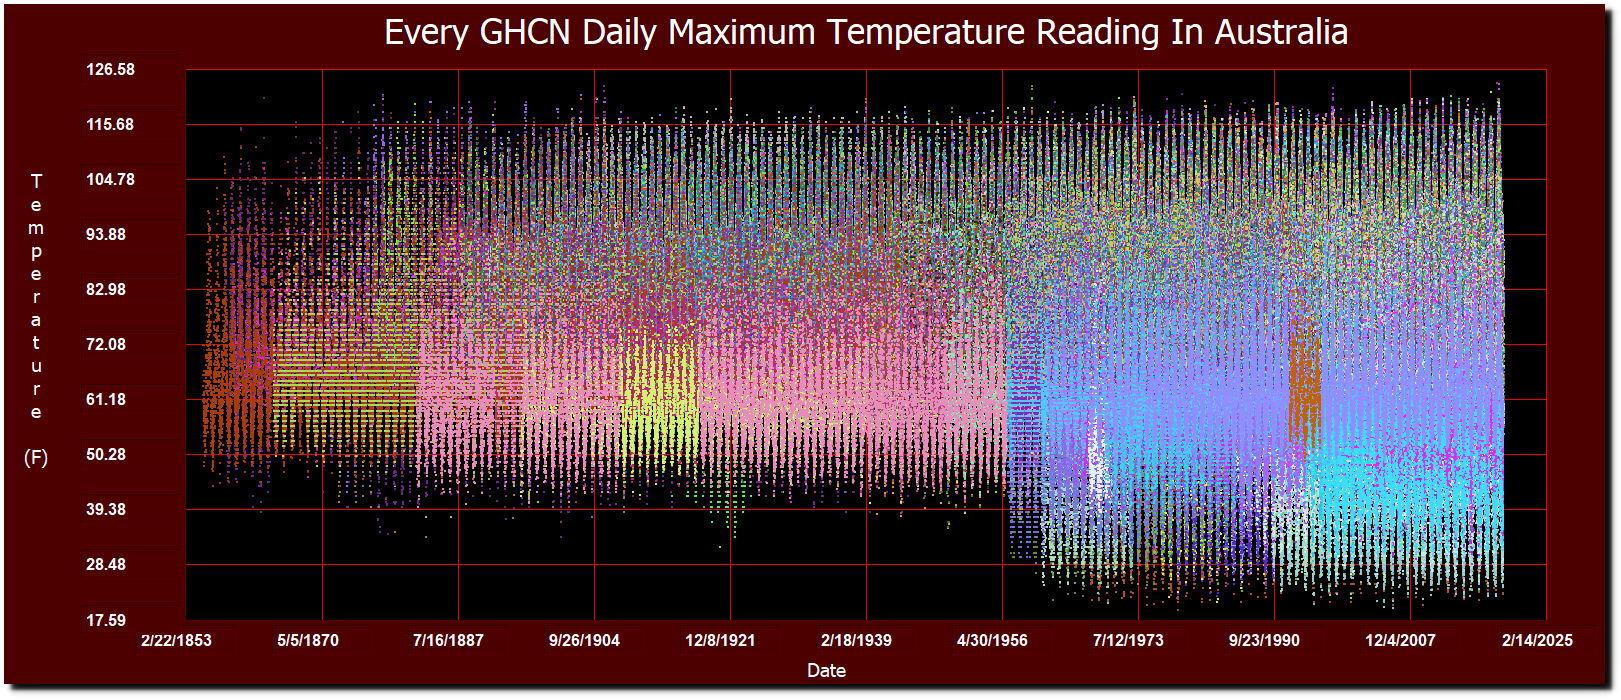
NOAA reports 123F at Warra, Tasmania on January 30, 60F on January 31, and 124F on February 1.

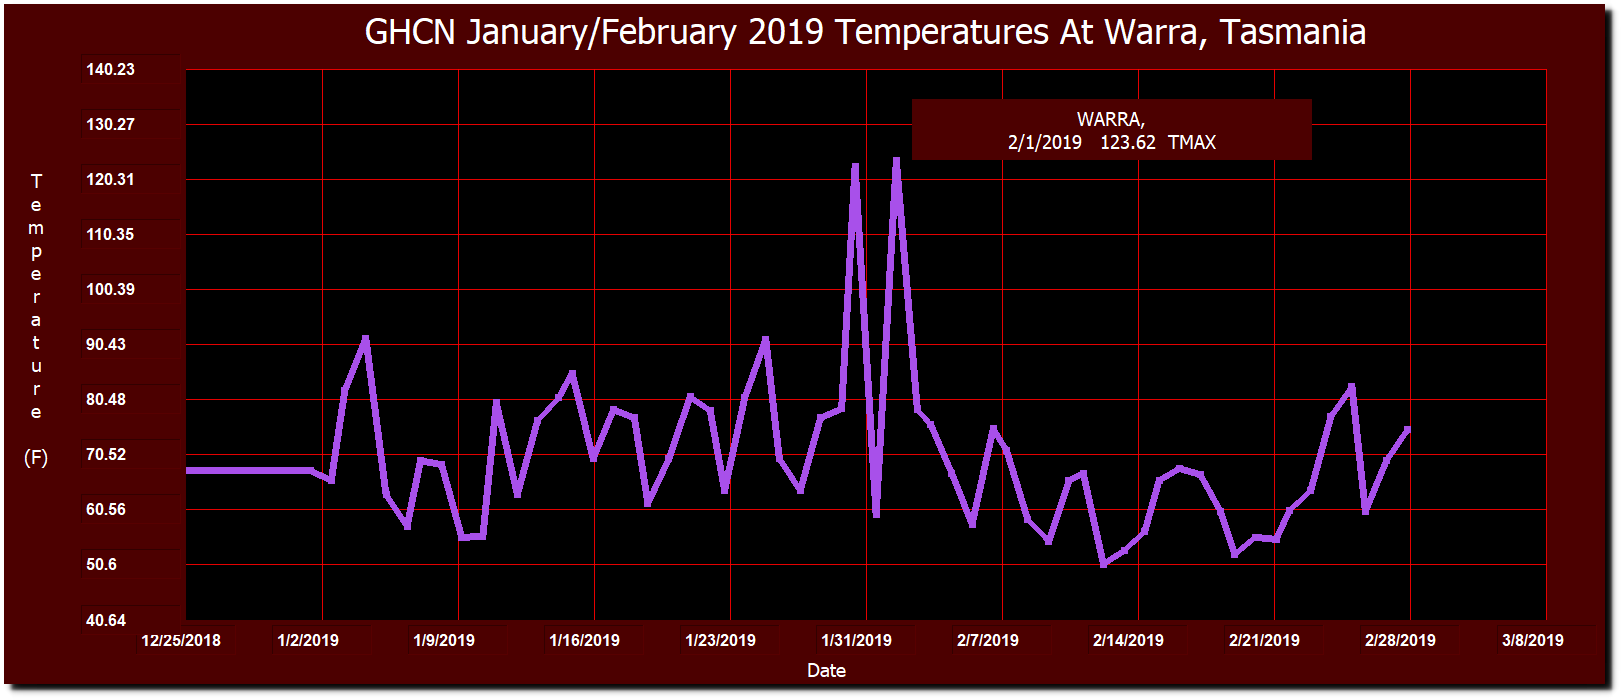
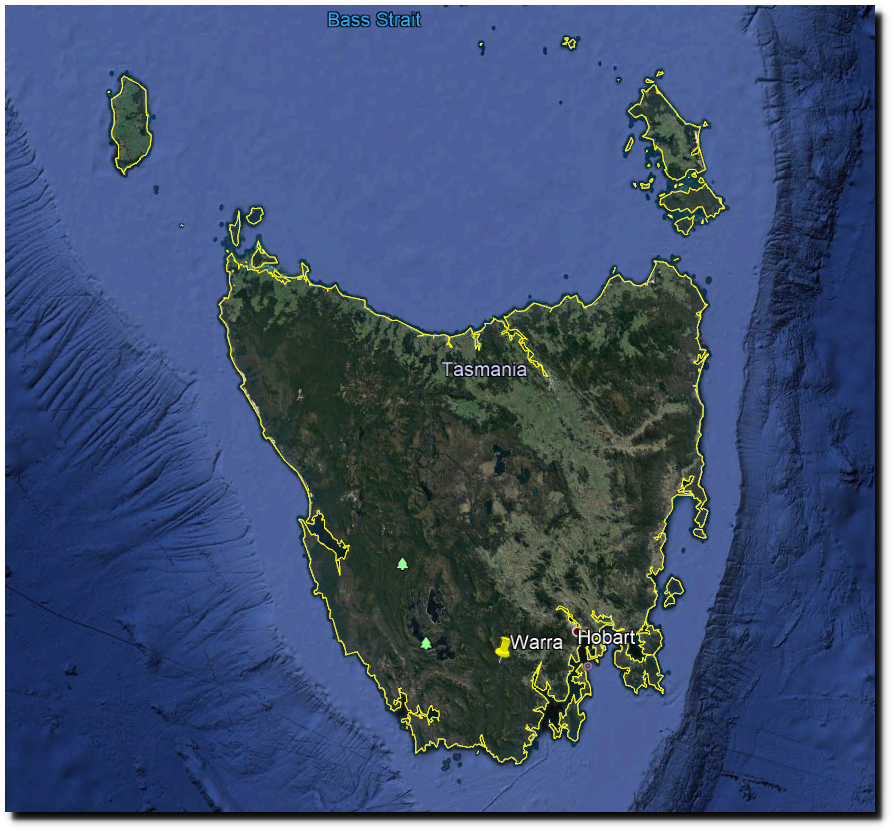
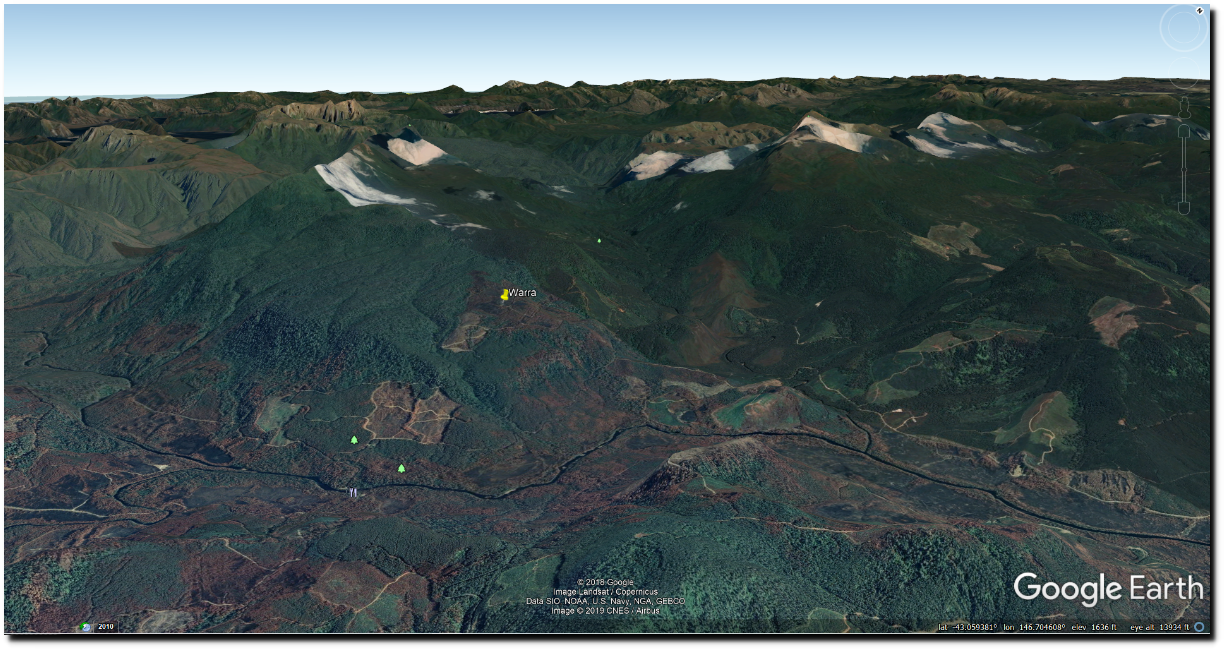
Warra is located in the southern mountains of Tasmania 43 degrees south and 1,636 feet elevation. The average maximum temperature for January/February was 70F including the two bogus hot readings, or 68F without them.

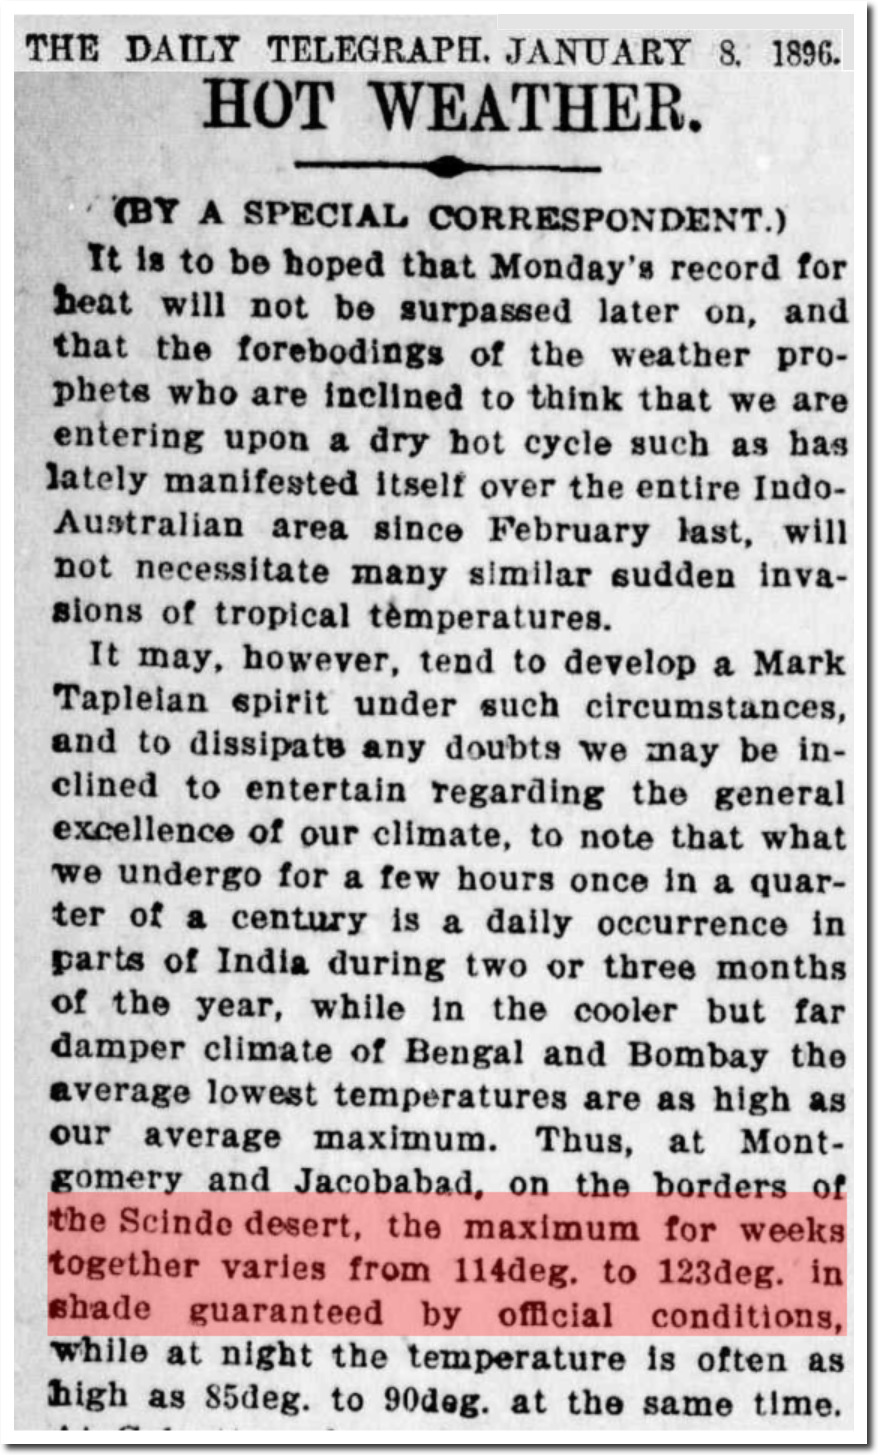
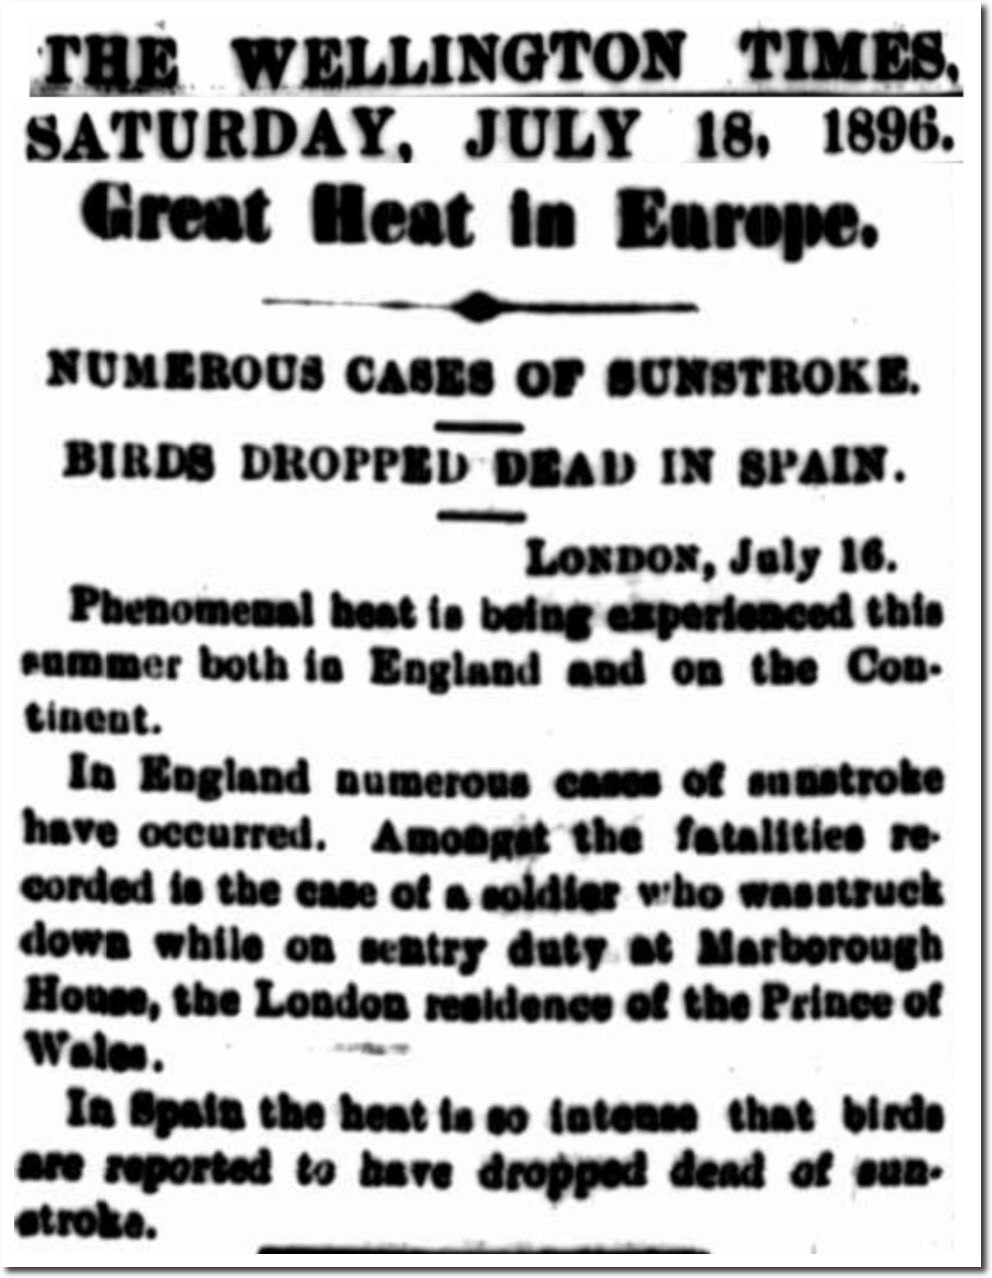
A little official government comedy to start the day.

Posted in Uncategorized | Leave a comment

Bourke, NSW Almost As Hot As 1878

Bourke, NSW is one of less than a dozen stations in Australia with a good long term daily temperature record in the GHCN database. Bourke reached 120F three times from 1878 to 1906, and never got that hot again. Maximum temperatures declined from 1878 until the mid-1970s, and have risen since then.

The last three summers have been almost as hot as 1878 and 1892.

Two of the worst heatwaves occurred in 1896 and 1878. In 1896, the January average maximum temperature was 110F.

The New York Times described it as the worst heatwave on record.

TimesMachine: August 18, 1896

India also was reported to reach 123 degrees in January, 1896.

08 Jan 1896 – HOT WEATHER. – Trove

During the Northern Hemisphere summer of 1896, there was a tremendous heatwave in Europe.

18 Jul 1896 – Great Heat in Europe. – Trove

Another major heatwave occurred in January, 1878 when Bourke had eighteen days over 110F, and two days over 120F.

Posted in Uncategorized | Leave a comment

1913 : “The Greatest Cataclysm In American History”

I knew that 1913 was bad, but I had no idea how bad it was before this evening. Record heat, floods and tornadoes wreaked devastation across the US. It would require an entire book to document it. So I am going to list a few things in no particular order. This web page has an excellent compilation.

The world’s record temperature of 134F was set in California on July 10, 1913.

mwr-050-01-0010.pdf

From August 1 to September 7, 1913 Nebraska was over 100 degrees every day but one.

On this date in 1913, it was 111 degrees in Nebraska.

ftp://ftp.ncdc.noaa.gov/pub/data/ghcn/daily/all/USC00231711.dly

03 Jul 1913, Page 2 – The Logan Republican at Newspapers.com

Omaha was devastated by a tornado earlier in the year.


Easter Sunday brought tornadoes from coast to coast.

The true story of our national calamity of flood, fire and tornado … – Logan Marshall – Google Books

The worst flooding in Ohio history also occurred in 1913.

Kansas had their “worst drought in history”

18 Aug 1913 – DROUGHT IN KANSAS. – Trove

As did the worst flooding in Texas history. This picture was taken near where I bought my first house – in Richmond, Texas. The flood crest was 56 feet on December 11, 1913.

09 Dec 1913, 3 – The Los Angeles Times at Newspapers.com

28 Mar 1913, 6 – The Baltimore Sun at Newspapers.com

27 Mar 1913, Page 1 – The Washington Post at Newspapers.com

27 Mar 1913, Page 1 – Harrisburg Telegraph at Newspapers.com

24 Mar 1913, 1 – Evening Times-Republican at Newspapers.com

25 Mar 1913, Page 5 – Reading Times at Newspapers.com

Posted in Uncategorized | Leave a comment

Southern Oceans Go Cold

Experts say it is the hottest year ever.

anomnight.8.26.2019.gif (1174×640)

Posted in Uncategorized | Leave a comment

August 28, 1948 – Every State Above 90F

On August 28, 1948, every state was over 90 degrees, and 68% of USHCN stations were over 90 degrees. Twenty-three states were over 100 degrees. Heat like that is incomprehensible now, and if it did happen – climate experts would declare 97% certainly that it couldn’t have happened at the low CO2 levels of 1948.

28 Aug 1948, 1 – The Lincoln Star at Newspapers.com

Posted in Uncategorized | Leave a comment

No Change In Arctic Ice Extent Over The Past Week

This may turn out to be the shortest melt season on record.

Index of /DATASETS/NOAA/G02135/north/daily/images/2019/08_Aug/

Ocean and Ice Services | Danmarks Meteorologiske Institut

Meanwhile, climate alarmists ramp up the hysteria in their imaginary alternate reality …

Posted in Uncategorized | Leave a comment

Shrinking Down The Rabbit Hole

“xenomoly” is correct. The Arctic and Antarctic trends move opposite each other.

ipcc_far_wg_I_chapter_07.pdf

During the summer of 1976, almost all of the sea ice around Antarctica melted.

The National Geographic Archive | November 1976 | page 1

 But this is what “shrinking” looks like to “Andy”.

NOAA/G02135/south/monthly/images/08_Aug/S_08_extent_anomaly_plot_hires_v3.0.png

Antarctic sea ice extent is very close to the 1979-1990 average.

Charctic Interactive Sea Ice Graph | Arctic Sea Ice News and Analysis

Posted in Uncategorized | Leave a comment

New Video : Greenland Propaganda Meltdown

Posted in Uncategorized | Leave a comment

Nothing Happening In The Arctic

I’ve been pointing out for several weeks that there is little melt happening in the Arctic, and official graphs are starting to catch up with reality.

Ocean and Ice Services | Danmarks Meteorologiske Institut

Posted in Uncategorized | Leave a comment

New Video : Rewriting Iceland

Posted in Uncategorized | Leave a comment