
In 1995, the New York Times predicted that most East Coast beaches would be gone by 2020.
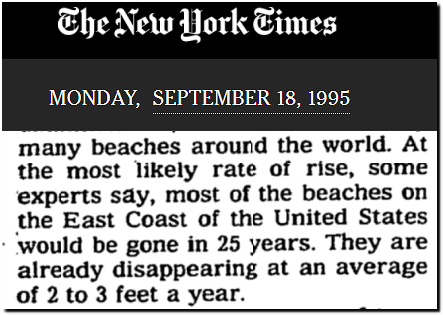
Scientists Say Earth’s Warming Could Set Off Wide Disruptions – The New York Times
The exact opposite has happened.


In 1995, the New York Times predicted that most East Coast beaches would be gone by 2020.
Scientists Say Earth’s Warming Could Set Off Wide Disruptions – The New York Times
The exact opposite has happened.
“Pride of Navy’s Airships Meets Disaster While on Its Way to Middle West
AMBULANCES AND PHYSICIANS RUSHED TO AID OF VICTIMS
Caldwell, Ohio, Sept. 3, 1925—(A. P.)—The giant dirigible Shenandoah is no more. It went down in three pieces here early to-day and killed its commander, Lieut. Commander Zachary Lansdowne, and at least fourteen of the officers and men, making up her crew.
The airship struck a line squall—a variety of storm most feared by airmen—shortly after 5 o’clock this morning near this Noble county village, while traveling at an altitude of 4000 feet enroute from Lakehurst, N. J. to the West.There was no explosion, wee big ship simply met winds of a strength which it was unable to combat. After encountering the storm at the high altitude the ship headed heavenwards to an altitude of approximately 5,000 feet when it suddenly came down again and broke into three pieces. One piece, | 150 feet or more in length, fell in a field about, one and one half miles from Aya, ‘The control compartment in which were commander and navigating crew fell fifty feet away and the third section, 150 feet long, drifted through the air like a free balloon for twelve miles, landing neat Sharon;”

03 Sep 1925, Page 1 – Harrisburg Telegraph at Newspapers.com
Two days later was the hottest day on record in Alabama.

September 1925 brought the most severe drought on record to Alabama, Georgia, Louisiana, Mississippi, South Carolina and Tennessee.


On September 6, 1925 the average maximum temperature in Alabama was 106F

September 6 and 7, 1925 were the two hottest days in Tennessee.


“Three provinces of Holland, Brabant, Gelderland and Overysl, are digging out of the ruins wrought by a hurricane that swept in from the sea, laying waste wide areas, killing many, and injuring more than 500.”

“Arctic Climate Turning Warmer; Glaciers Melting
Oakland Tribune FEBRUARY 18, 1925Arctic Climate Turning Warmer Glaciers Melting
By HAL O’FLAHERTY.
(Special Cable to The Oakland TRIBUNE and the Chicago Daily News.)LONDON, Feb. 18.—The latest, investigations confirm the theory that the arctic climate has changed considerably in recent years. The temperature of the Gulf Stream, which tn 1925, was higher than in the previous year, shows an average increase of from four to five degrees centigrade since 1900 when it was.first measured by the explorer Nansen.
The chief proof of the change in climate is the remarkable shrinkage of the glaciers which have retreated from three to four miles, showing that the mild air has caused corrosion for a considerable time,
Owing to the altered conditions, Spitsbergen, which in former years was isolated by the heavy ice of the ocean from October to May, may become approachable in winter. And for the first time on record a ship has been dispatched there in February,”

“Milk from transgender women who were born male is as good for babies as a mother’s breast milk, an NHS trust said.
A leaked letter from the medical director of University Hospitals Sussex NHS Foundation Trust defends the practice of using drugs to induce lactation and enable trans women to feed babies.”

Transgender women’s milk just as good for babies, says NHS trust
“Proxy tree-ring and historical evidence for precipitation extremes during the preinstrumental nineteenth century indicate that recent floods and droughts on the Amazon River may have not yet exceeded the range of natural hydroclimatic variability.
The most severe and sustained drought in the history of instrumental precipitation and streamflow observations for the Amazon River basin occurred in 1925/26 when river commerce was brought to a standstill and several steamships became grounded in the low water conditions between Iquitos and Manaus, Brazil, and on the lower Amazon River in the state of Pará”

“Middlebury Register and Addison county Journal 29 Feb 1884,
Great Loss of Life in Five Southern States Thousands of Houses Destroyed—Hundreds of People Killed,
The States of Georgia, Alabama, North and South Carolina and Louisiana have been visited by one of the most destructive storms ever seen in the South. Thousands of houses were destroyed in an instant, hundreds of Persons lost their lives, and many more were injured. -The tornado was particularly severe in Georgia and Alabama”

29 Feb 1884, 2 – Middlebury Register and Addison county Journal at Newspapers.com
“York Democratic Press 24 Feb 1888, Fri -Page 2 BY CYCLONE AND FLAME.—Tho Town of Vernon, Ils,, Nearly Wiped Out.
AN APPALLING DISASTER!
Tho Loss of Life Estimated at Fully : Forty-Eight.Whole Families Buried Beneath the Ruins of Their Desolated Homes—Tho Tornado Strikes the Eastern Portion of thee Town and Buildings Are Blown Into Kindlings,
Mount Vernon, IL., Feb. 20.—This city Was visited by a terrible tornado about 4:45 p.m, yesterday. It had been thundering and raining for some time, when suddenly a low rumbling noise was heard and a black dense cloud that seemed to touch the earth swept over the city, and it became very dark. As soon as the cloud passed the sky brightened an people realized the shock and loss they lad sustained. Hundreds of houses were blown down, and ‘many people were crushed in the ruins. It is impossible to estimate the loss at this time. At least half of the town ix in ruins,”

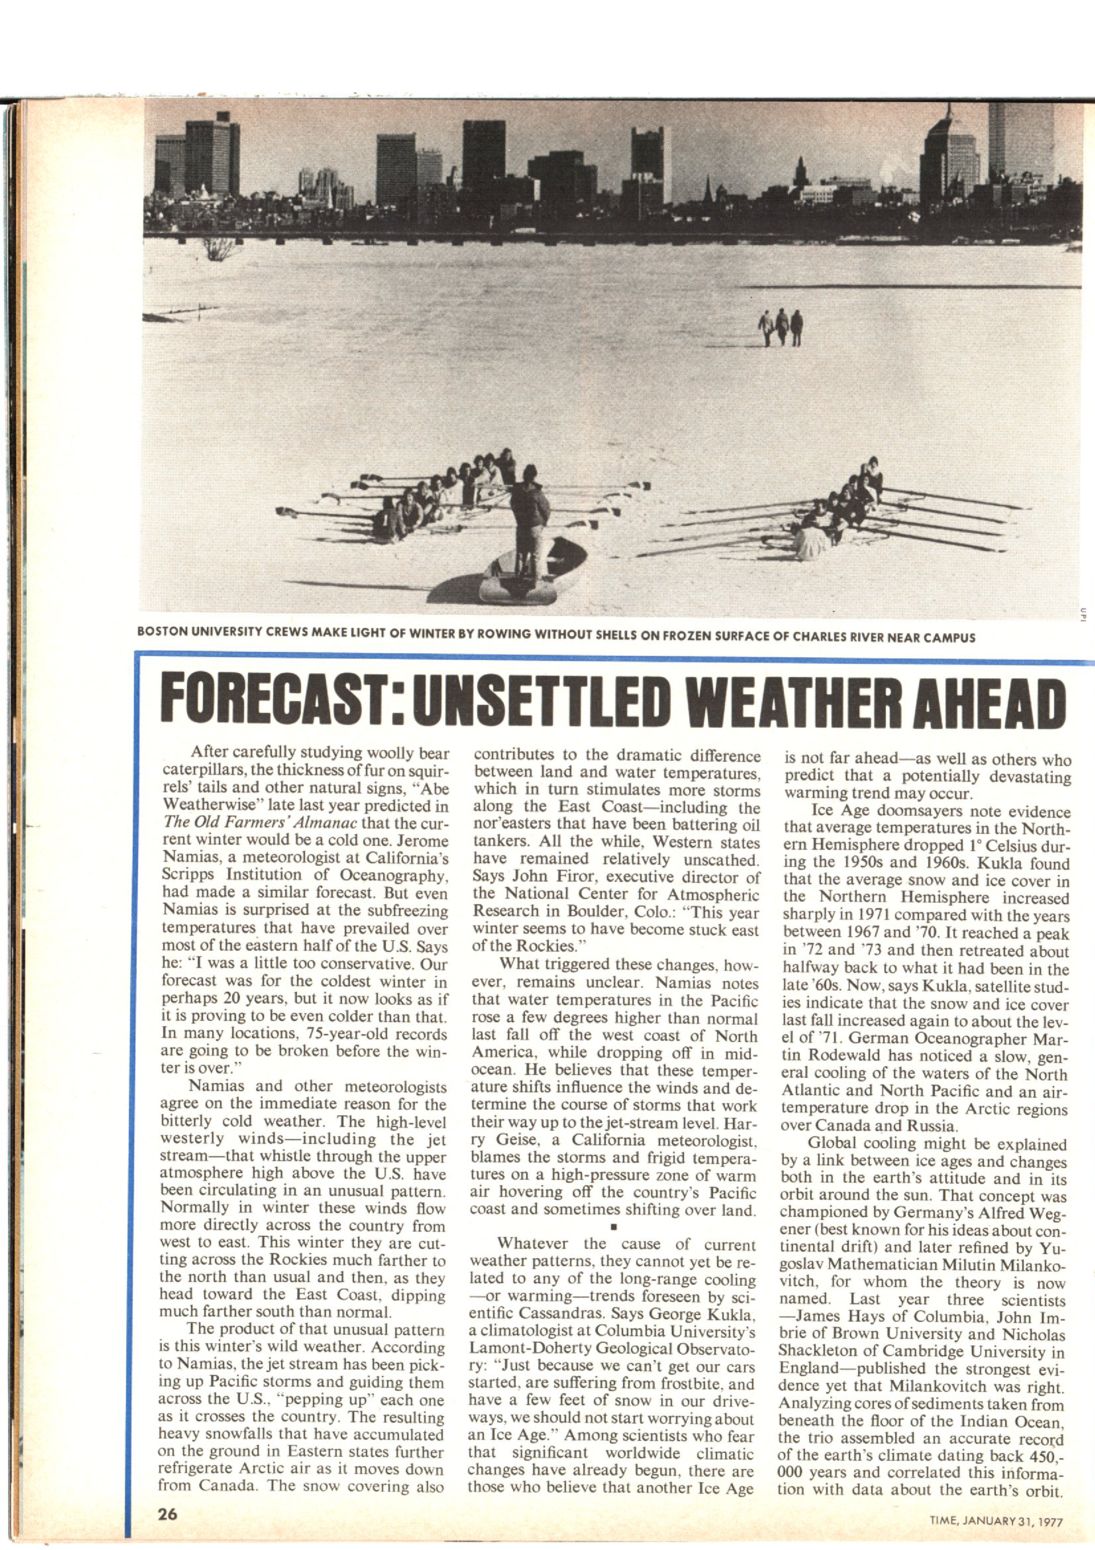
“Ice Age doomsayers note evidence that average temperatures in the Northern Hemisphere dropped 1° Celsius during the 1950s and 1960s. Kukla found that the average snow and ice cover in the Northern Hemisphere increased sharply in 1971 compared with the years between 1967 and °70. It reached a peak in ’72 and °73 and then retreated about halfway back to what it had been in the late 60s. Now, says Kukla, satellite studies indicate that the snow and ice cover last fall increased again to about the level of 71. German Oceanographer Martin Rodewald has noticed a slow, general cooling of the waters of the North Atlantic and North Pacific and an airtemperature drop in the Arctic regions over Canada and Russia.
Global cooling might be explained by a link between ice ages and changes both in the earth’s attitude and in its orbit around the sun. That concept was championed by Germany’s Alfred Wegener (best known for his ideas about continental drift) and later refined by Yugoslav Mathematician Milutin Milankovitch, for whom the theory is now named. Last year three scientists —James Hays of Columbia, John Imbrie of Brown University and Nicholas Shackleton of Cambridge University in England—published the strongest evidence yet that Milankovitch was right, Analyzing cores of sediments taken from beneath the floor of the Indian Ocean, the trio assembled an accurate record of the earth’s climate dating back 450,000 years and correlated this information with data about the earth’s orbit,
TIME, JANUARY 31, 1977”

Page 33 – Jan. 31, 1977, Vol. 109, No. 5 – The Vault – TIME

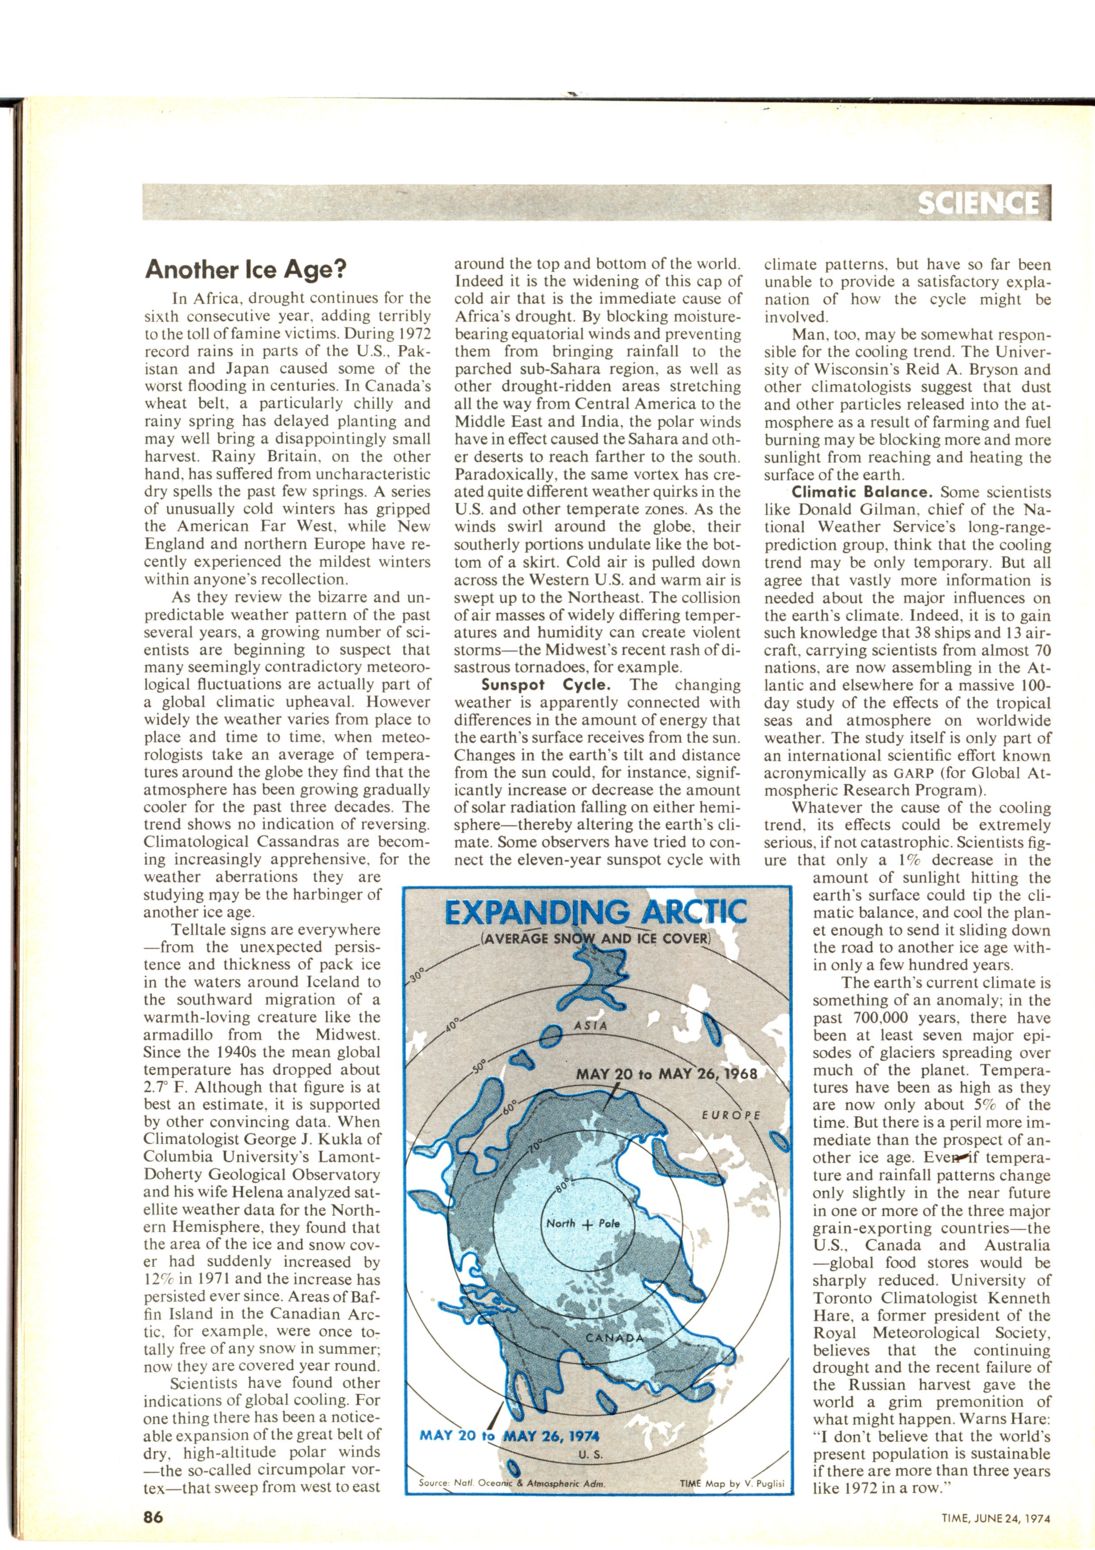
“Telltale signs are everywhere — from the unexpected persistence and thickness of pack ice in the waters around Iceland to the southward migration of a warmth-loving creature like the armadillo from the Midwest.Since the 1940s the mean global temperature has dropped about 2.7° F. Although that figure is at best an estimate, it is supported by other convincing data. When Climatologist George J. Kukla of Columbia University’s Lamont-Doherty Geological Observatory and his wife Helena analyzed satellite weather data for the Northern Hemisphere, they found that the area of the ice and snow cover had suddenly increased by 12% in 1971 and the increase has persisted ever since. Areas of Baffin Island in the Canadian Arctic, for example, were once totally free of any snow in summer; now they are covered year round.
Scientists have found other indications of global cooling. For one thing there has been a noticeable expansion of the great belt of dry, high-altitude polar winds — the so-called circumpolar vortex—that sweep from west to east around the top and bottom of the world. Indeed it is the widening of this cap of cold air that is the immediate cause of Africa’s drought. By blocking moisture-bearing equatorial winds and preventing them from bringing rainfall to the parched sub-Sahara region, as well as other drought-ridden areas stretching all the way from Central America to the Middle East and India, the polar winds have in effect caused the Sahara and other deserts to reach farther to the south. Paradoxically, the same vortex has created quite different weather quirks in the U.S. and other temperate zones. As the winds swirl around the globe, their southerly portions undulate like the bottom of a skirt. Cold air is pulled down across the Western U.S. and warm air is swept up to the Northeast. The collision of air masses of widely differing temperatures and humidity can create violent storms—the Midwest’s recent rash of disastrous tornadoes, for example.”

Page 105 – June 24, 1974, Vol. 103, No. 25 – The Vault – TIME
A short video showing how the New York Times starts out with an agenda, and then creates a fictional story in support of it.
