Disrupting the Borg is expensive and time consuming!
Google Search
-
Recent Posts
- Analyzing The Western Water Crisis
- Gaslighting 1924
- “Why Do You Resist?”
- Climate Attribution Model
- Fact Checking NASA
- Fact Checking Grok
- Fact Checking The New York Times
- New Visitech Features
- Ice-Free Arctic By 2014
- Debt-Free US Treasury Forecast
- Analyzing Big City Crime (Part 2)
- Analyzing Big City Crime
- UK Migration Caused By Global Warming
- Climate Attribution In Greece
- “Brown: ’50 days to save world'”
- The Catastrophic Influence of Bovine Methane Emissions on Extraterrestrial Climate Patterns
- Posting On X
- Seventeen Years Of Fun
- The Importance Of Good Tools
- Temperature Shifts At Blue Hill, MA
- CO2²
- Time Of Observation Bias
- Climate Scamming For Profit
- Back To The Future
March 2026 M T W T F S S 1 2 3 4 5 6 7 8 9 10 11 12 13 14 15 16 17 18 19 20 21 22 23 24 25 26 27 28 29 30 31 Recent Comments
- Bob G on Analyzing The Western Water Crisis
- arn on Analyzing The Western Water Crisis
- Bob G on Analyzing The Western Water Crisis
- Hank Phillips on Analyzing The Western Water Crisis
- Bob G on Analyzing The Western Water Crisis
The Fake Post-1970 US Temperature Spike
USHCN raw temperature data shows a sharp rise in temperatures after 1970.
I did some analysis on this, and discovered that since 1970, NOAA has been losing December data much faster than they have been losing July data. This causes post-1970 temperatures to be skewed upwards.
If I plot only stations with complete records for the year, the post-1970 peak gets reduced.
Posted in Uncategorized
Leave a comment
Stampeding The Herd Over The Cliff
More evidence the people behind the global warming big lie are attempting genocide.
Alarmism and catastrophic thinking are valuable in the sense that a panicked herd can be stampeded over a cliff.
NYT Opinion on Twitter: “Panic might seem counterproductive,
Posted in Uncategorized
Leave a comment
Arctic Sea Ice Continues To Grow
Last year had the highest June Arctic sea ice volume since 2006, and this year is well ahead of last year.
Most of the Arctic is covered with ice more than two meters thick.
CICE_combine_thick_SM_EN_20190215.png (758×631)
Arctic winter temperatures are running close to the 1958-2002 mean.
Ocean and Ice Services | Danmarks Meteorologiske Institut
Temperatures are running around -30C from North Dakota to Siberia.
Meanwhile, “scientists say” the increase in ice is a “horror story of melting.”
Posted in Uncategorized
Leave a comment
Doubling The Hockey Stick Fraud
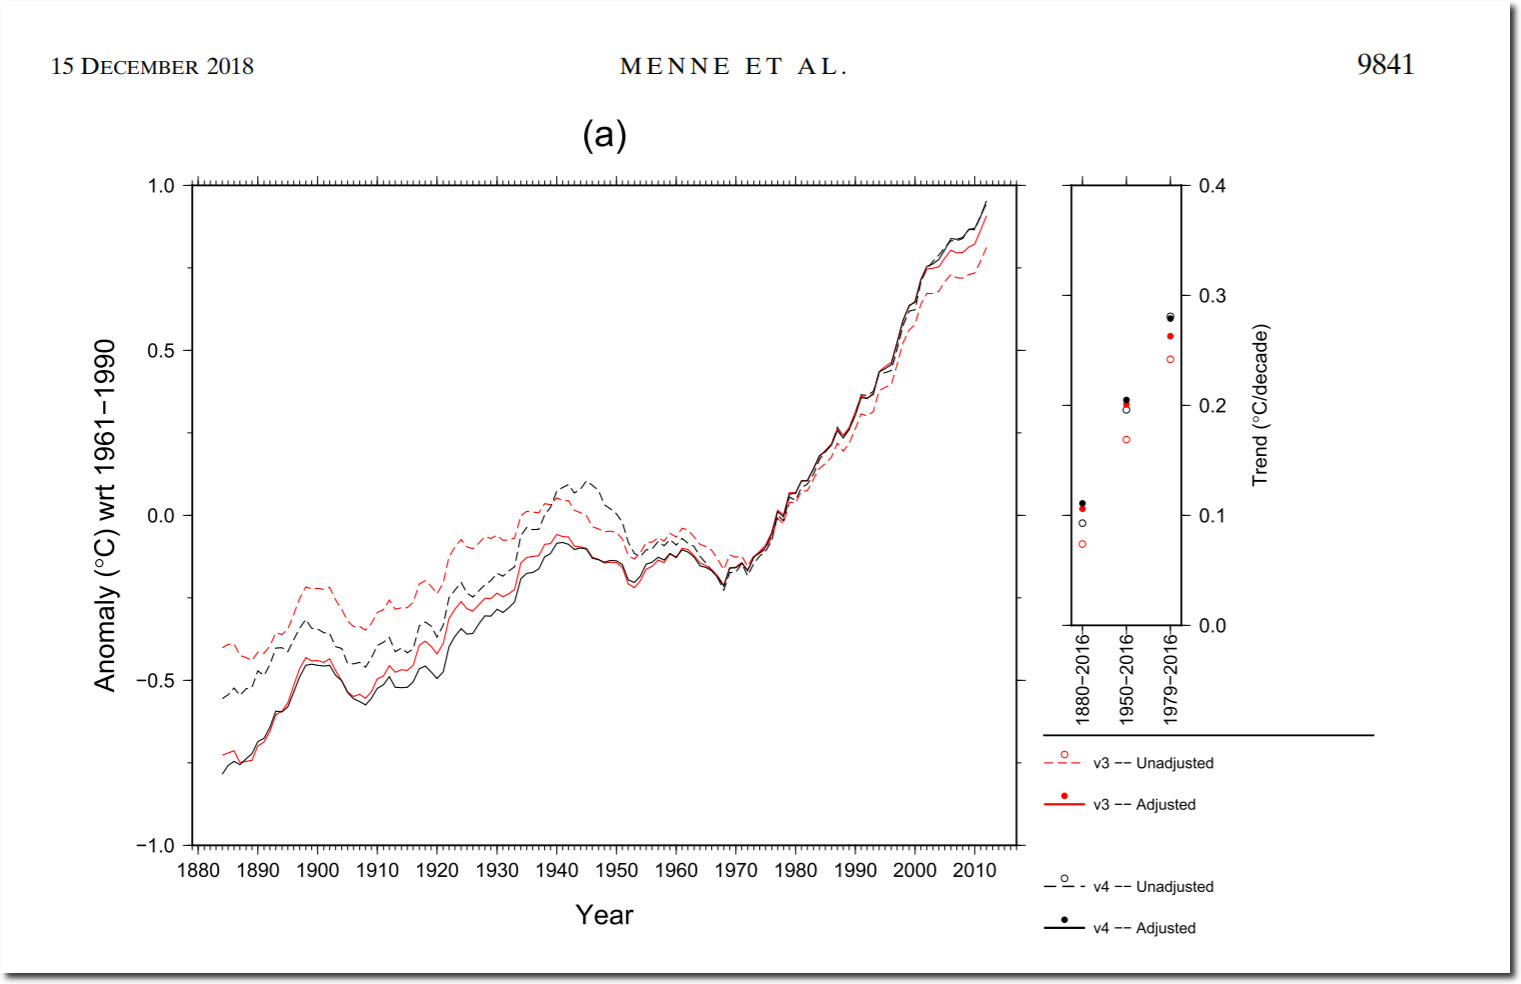
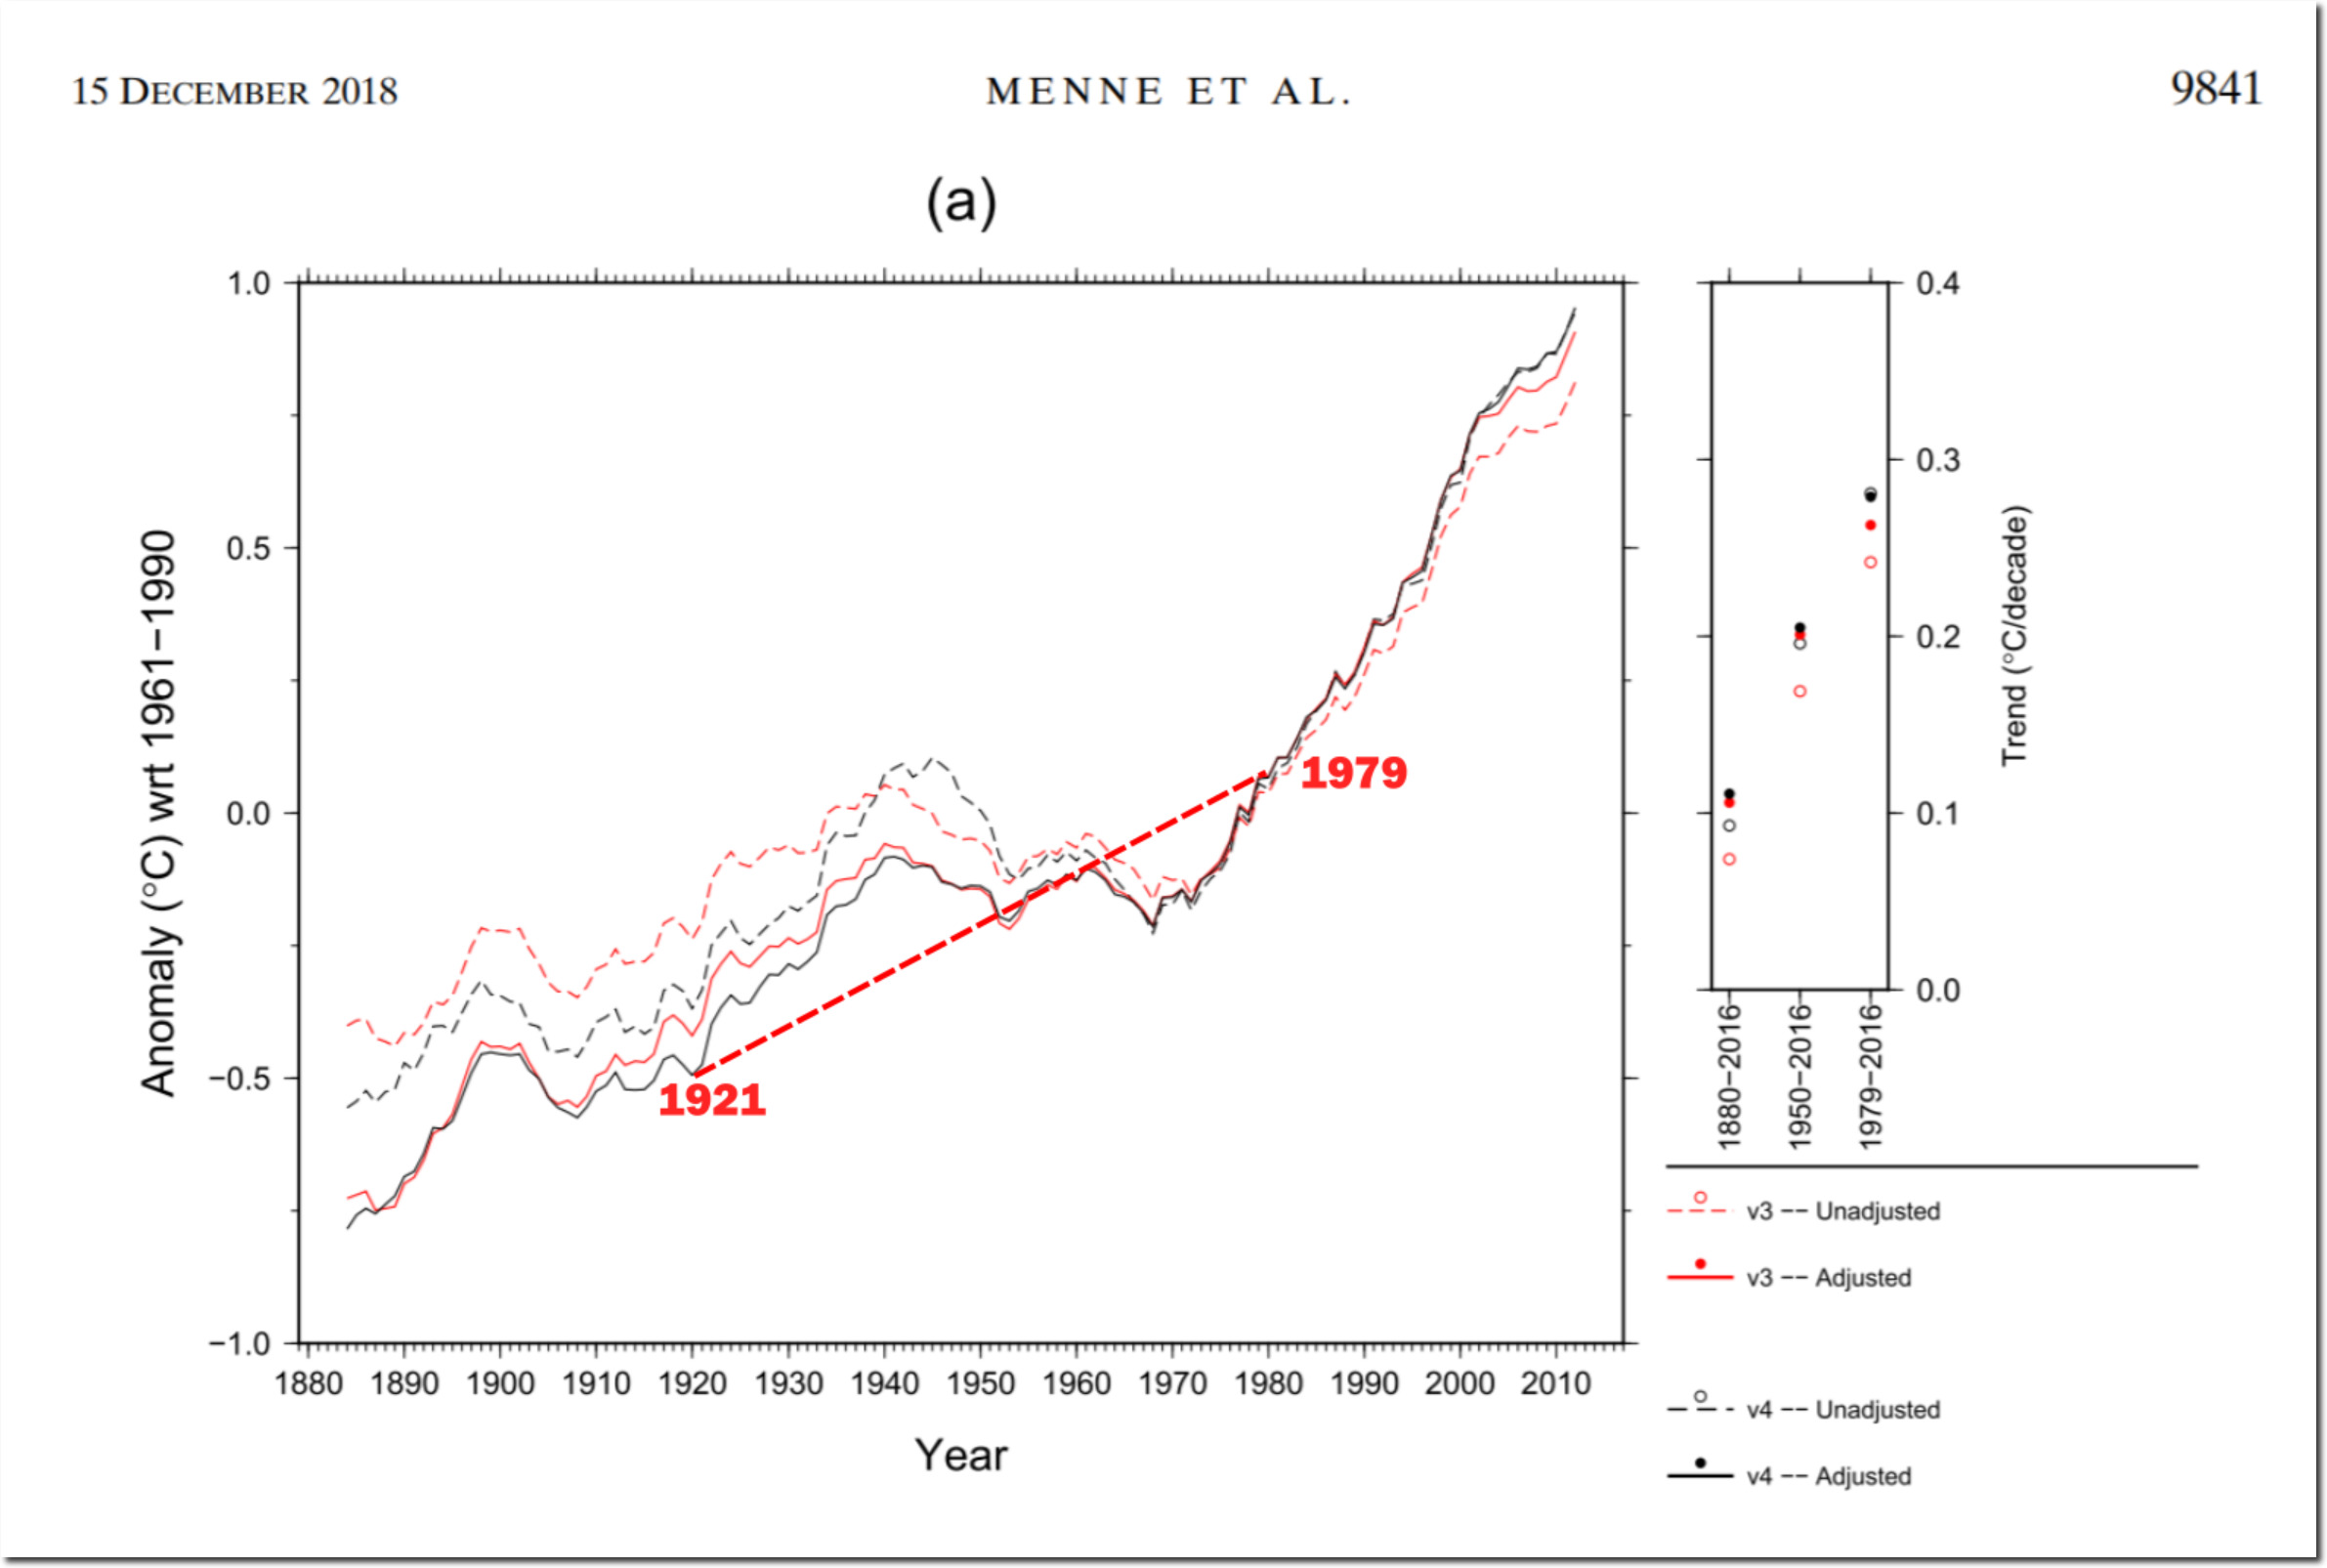
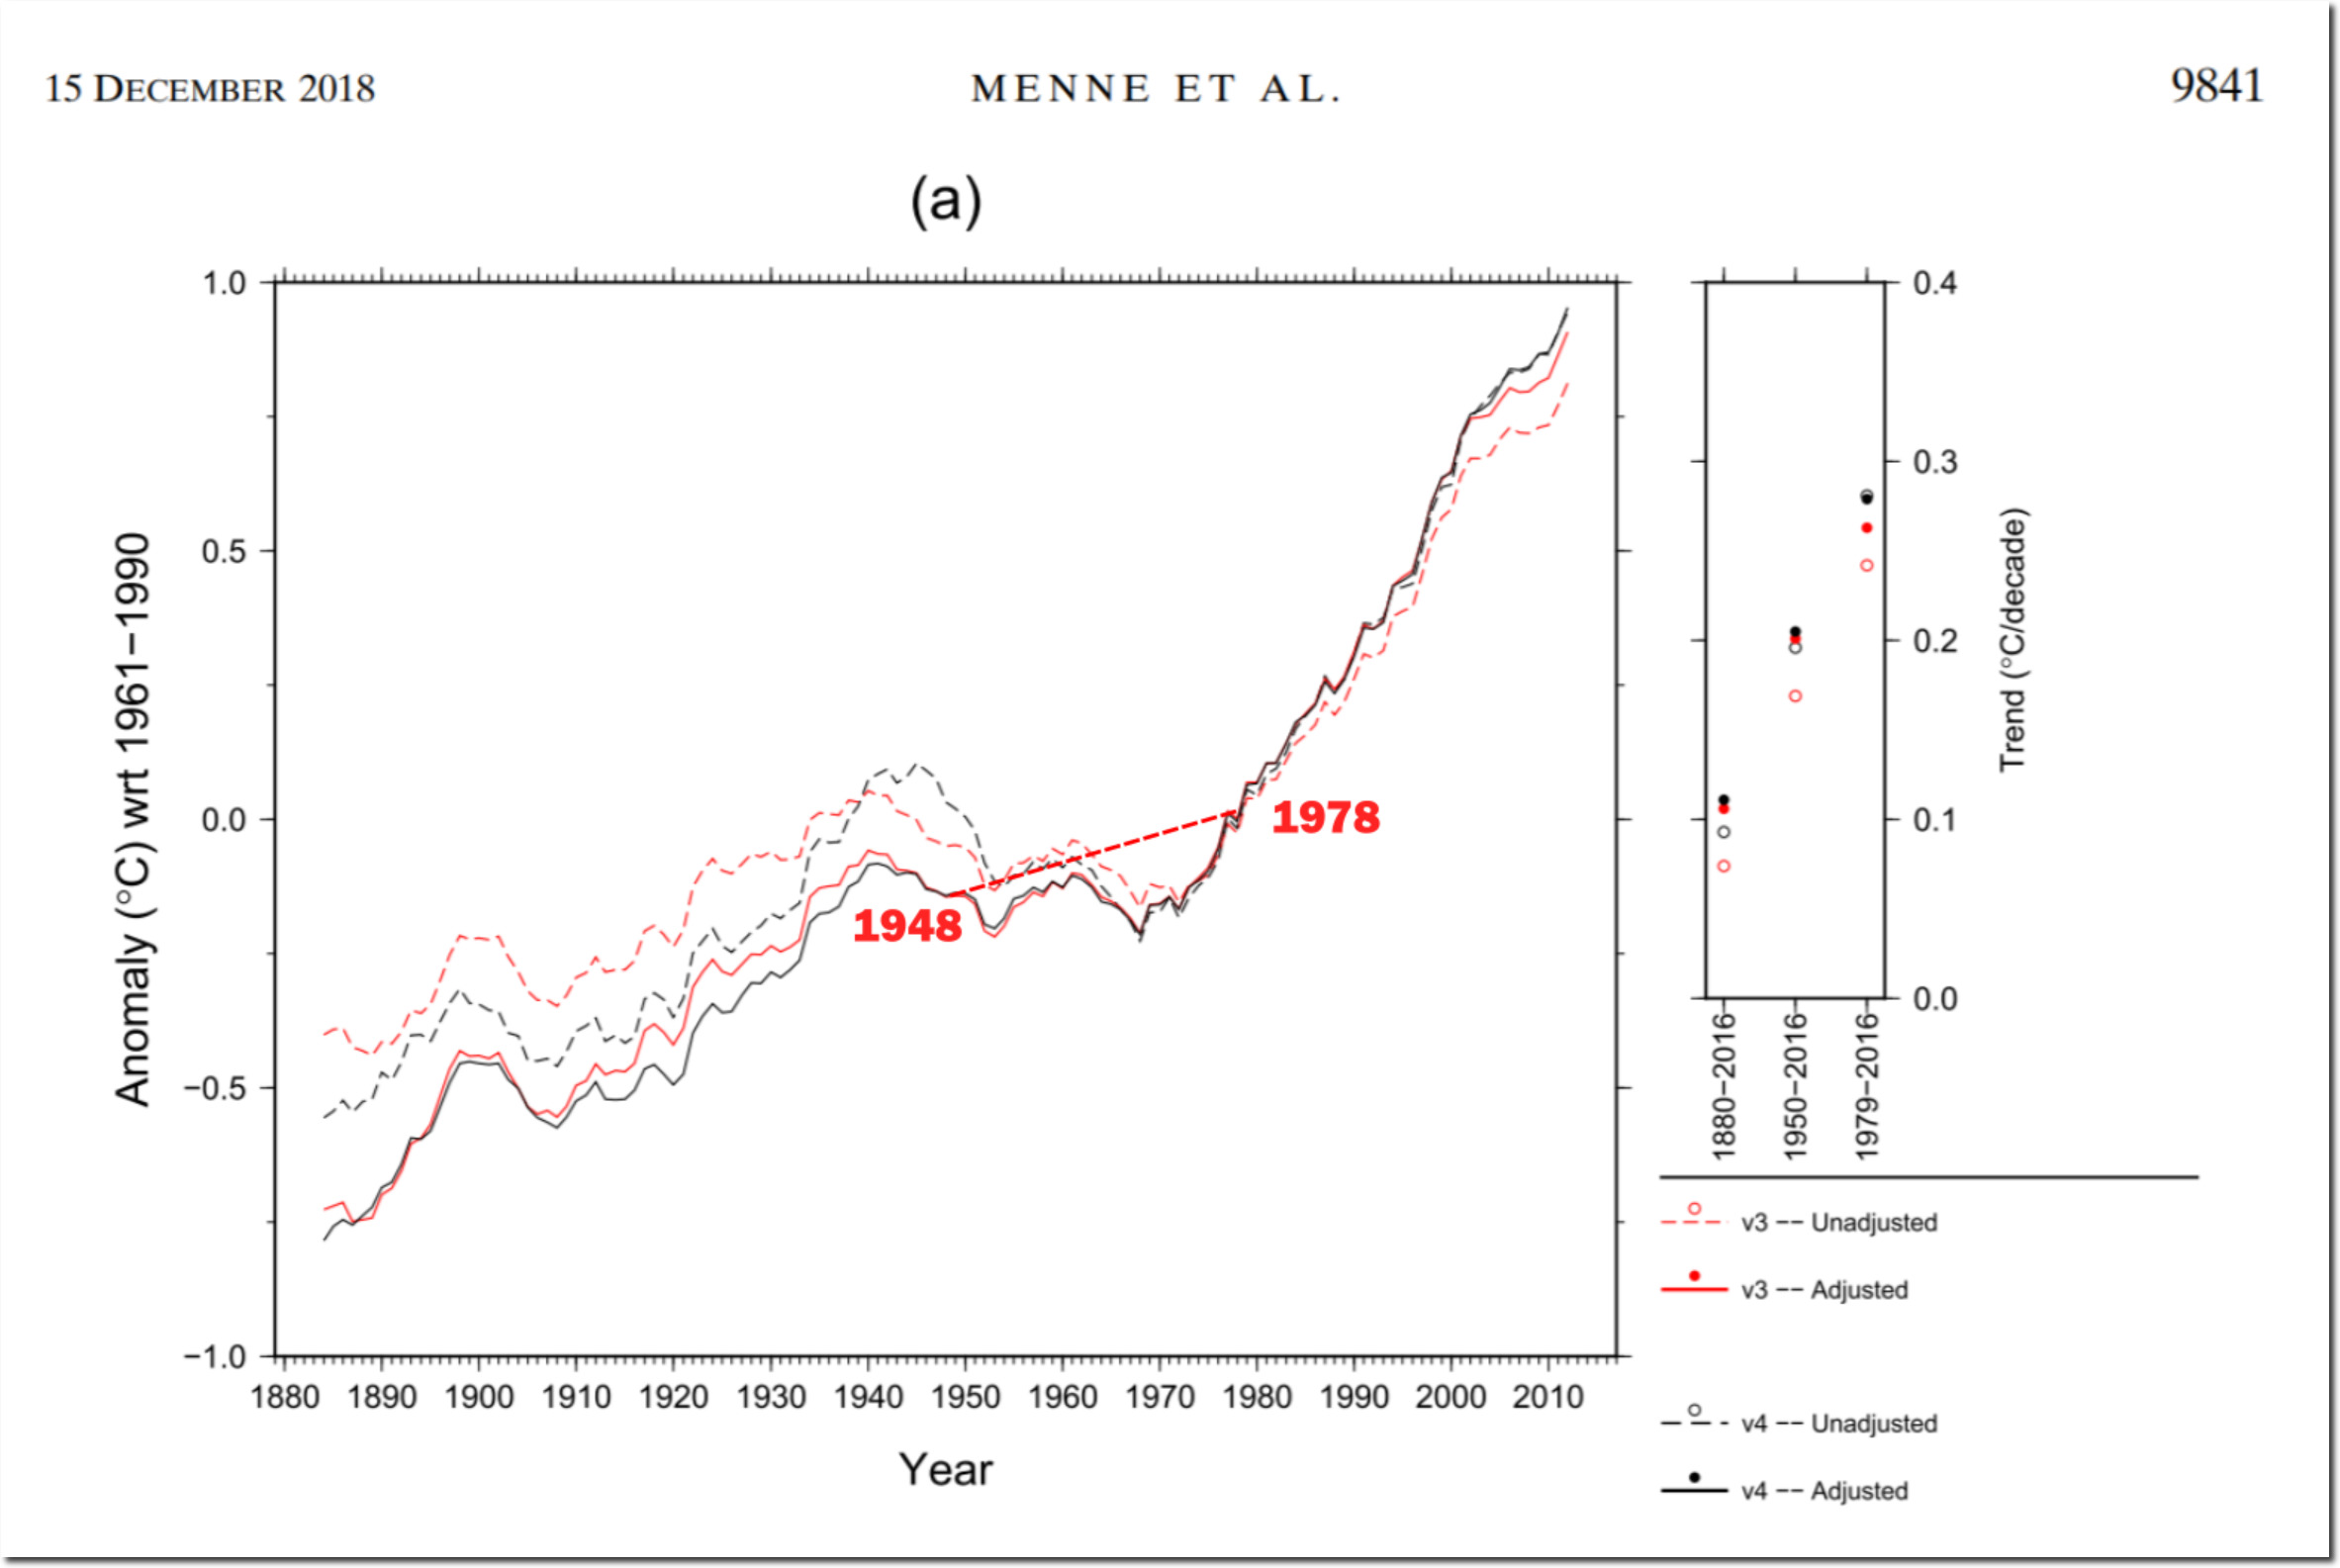
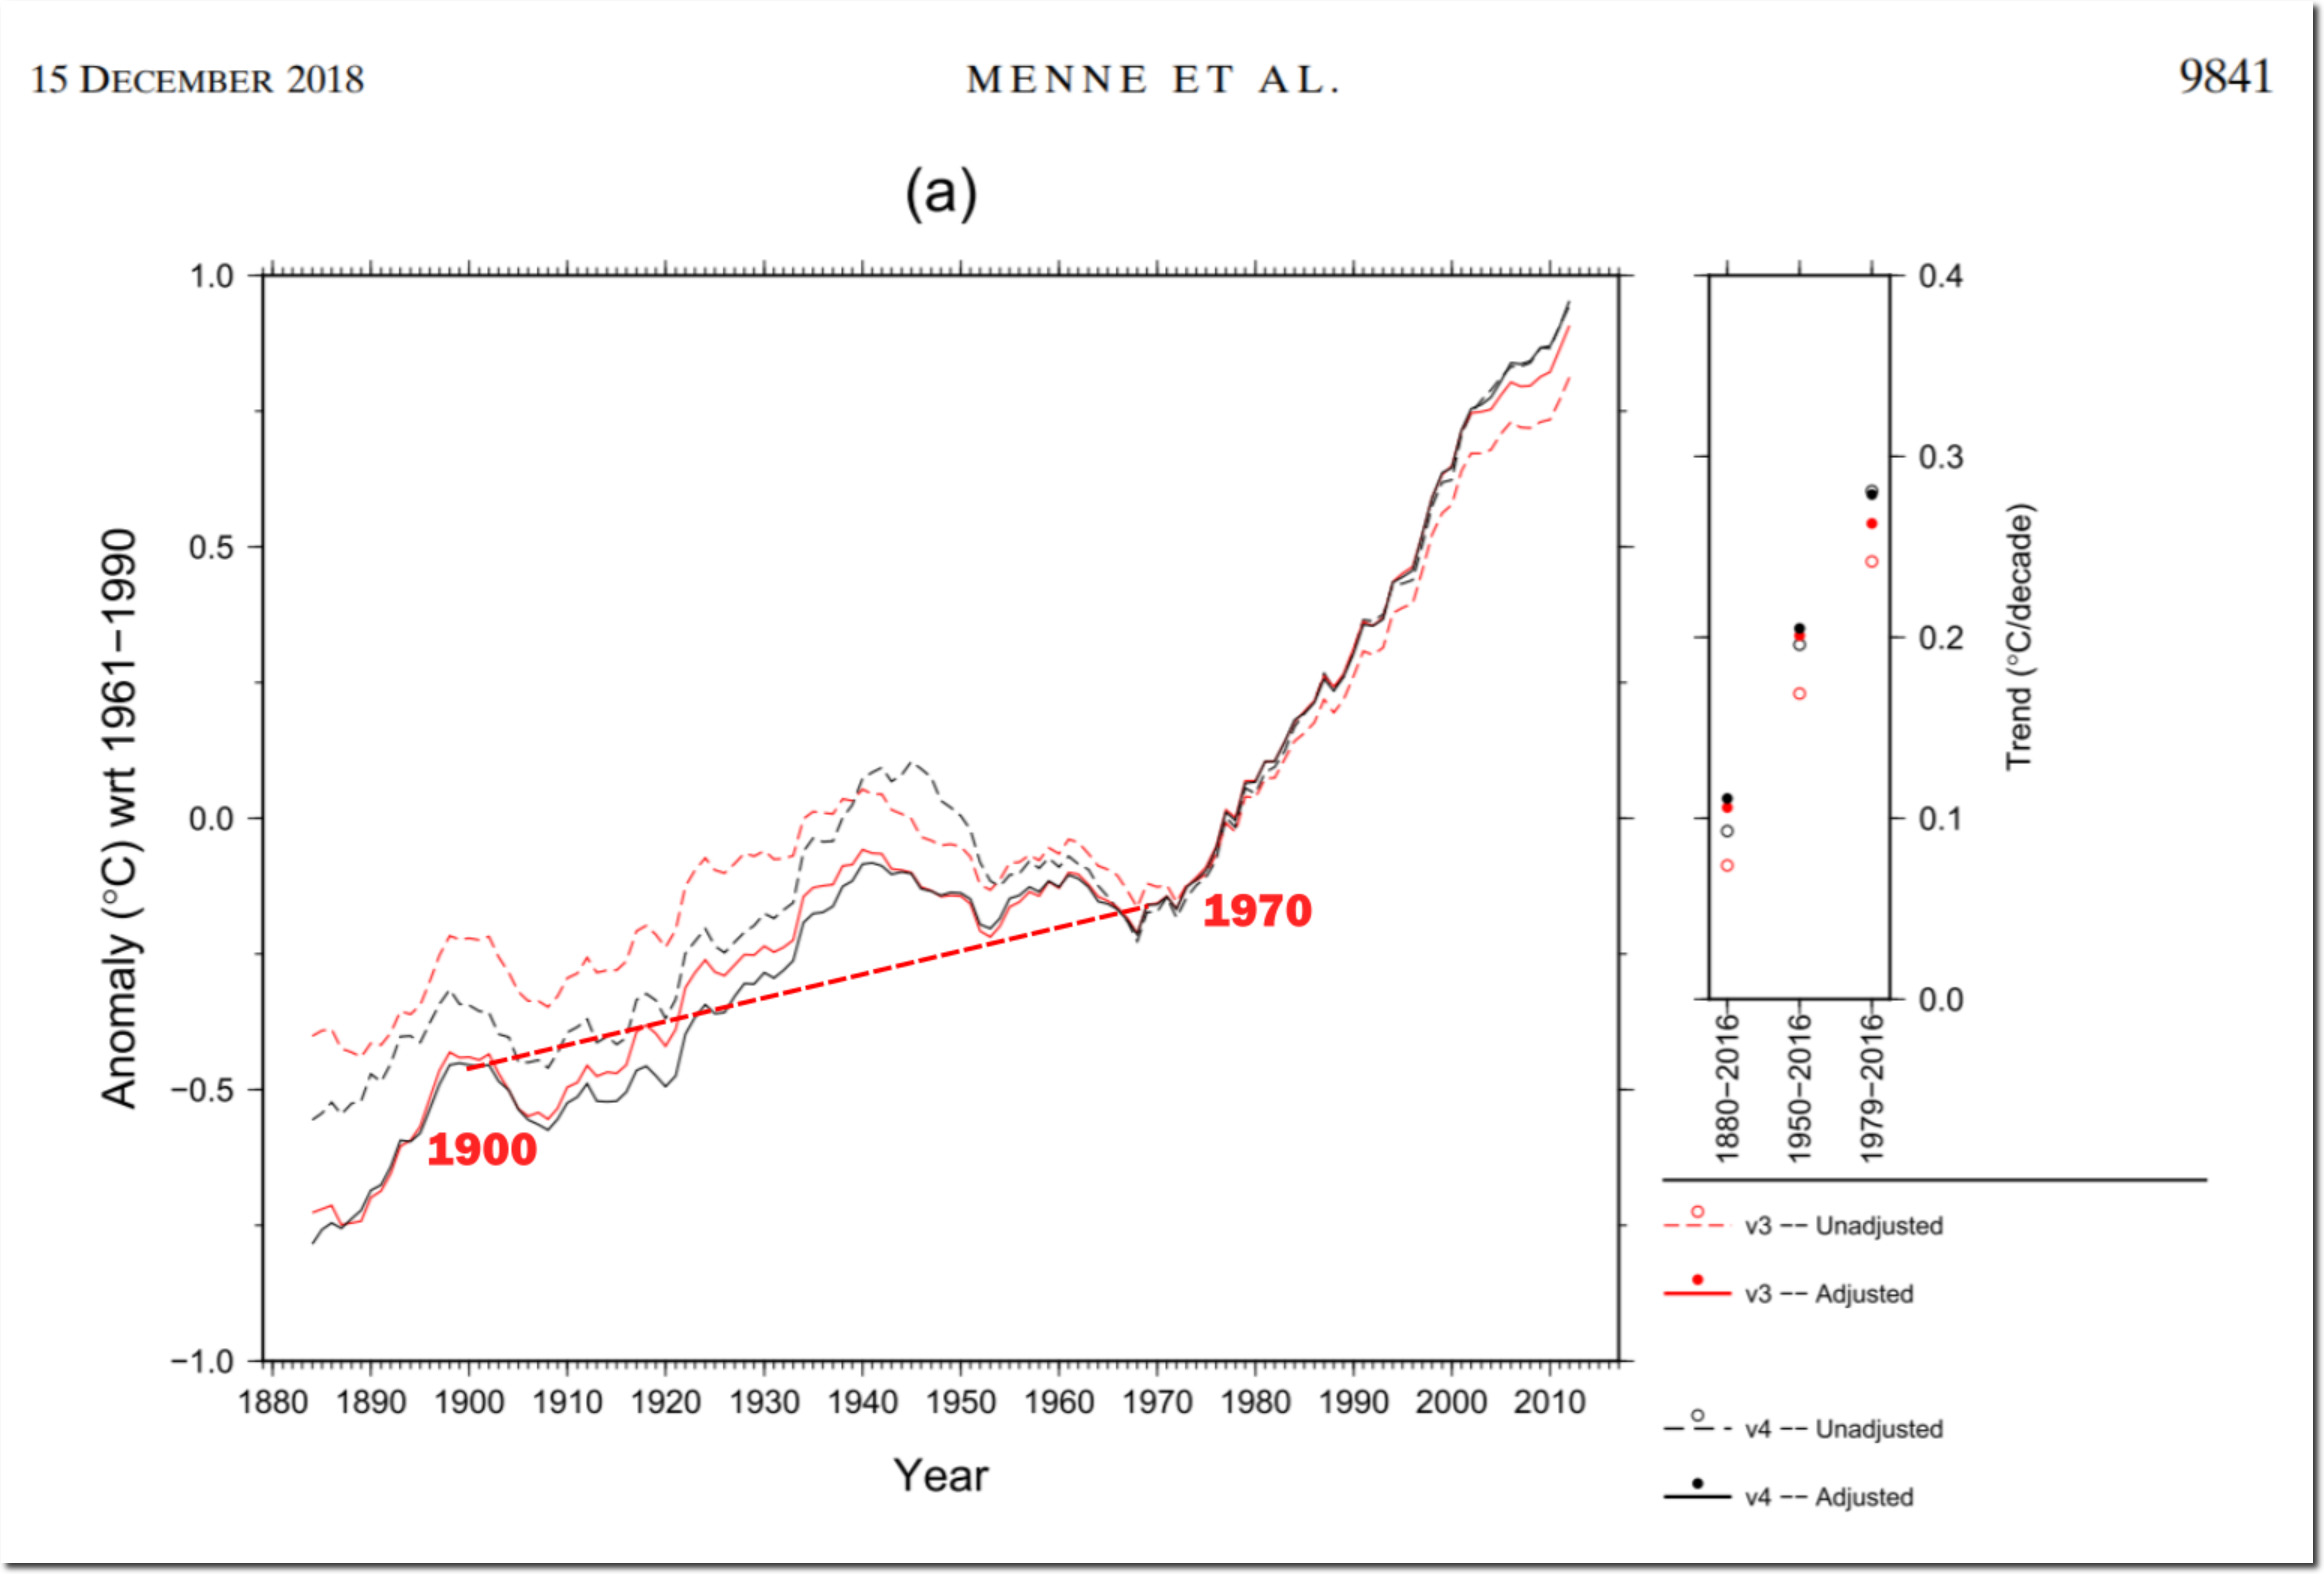
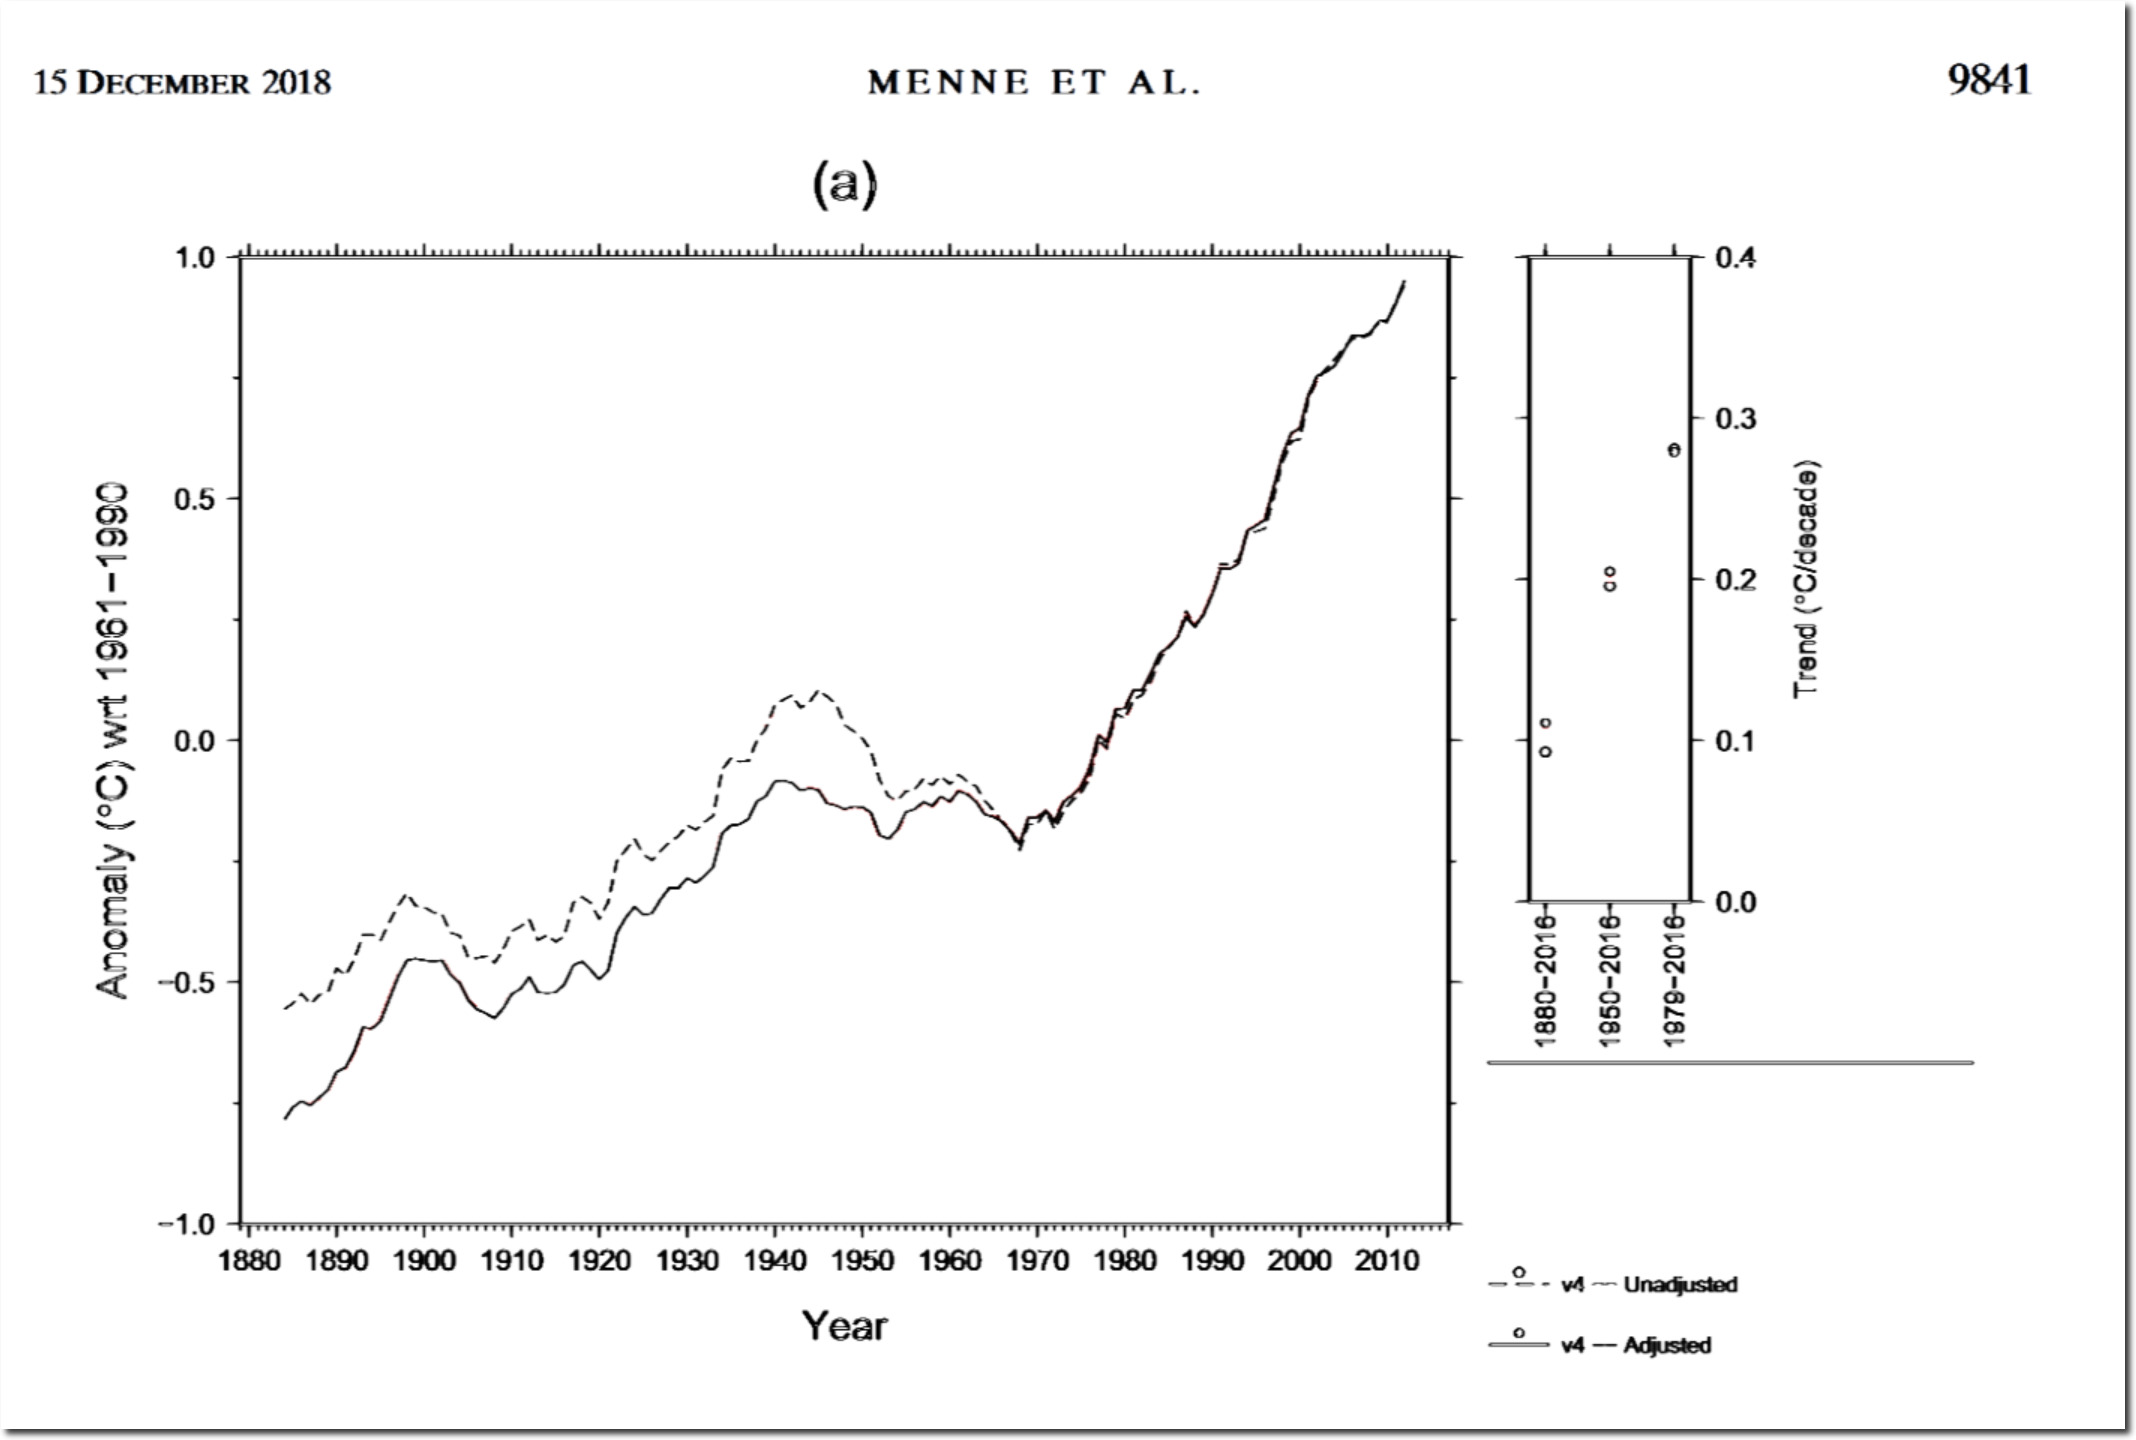
The latest version of NOAA’s Global Historical Climatology network (GHCN) has an even more impressive hockey stick than prior versions, showing more than 1.6C warming – with a spectacular post 1970 hockey stick.
The post-2000 global warming pause was central to the 2014 IPCC report, but it has been erased.
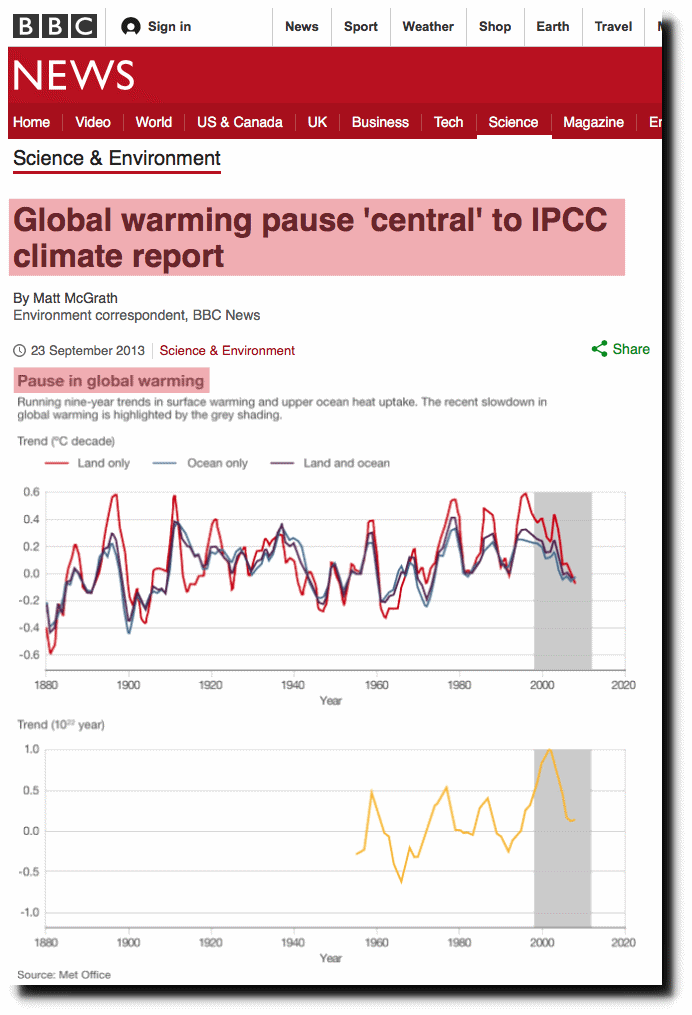
Global warming pause ‘central’ to IPCC climate report – BBC News
The hockey stick since 1970 also bears no resemblance to lower troposphere temperatures, which show much less warming since 1978.
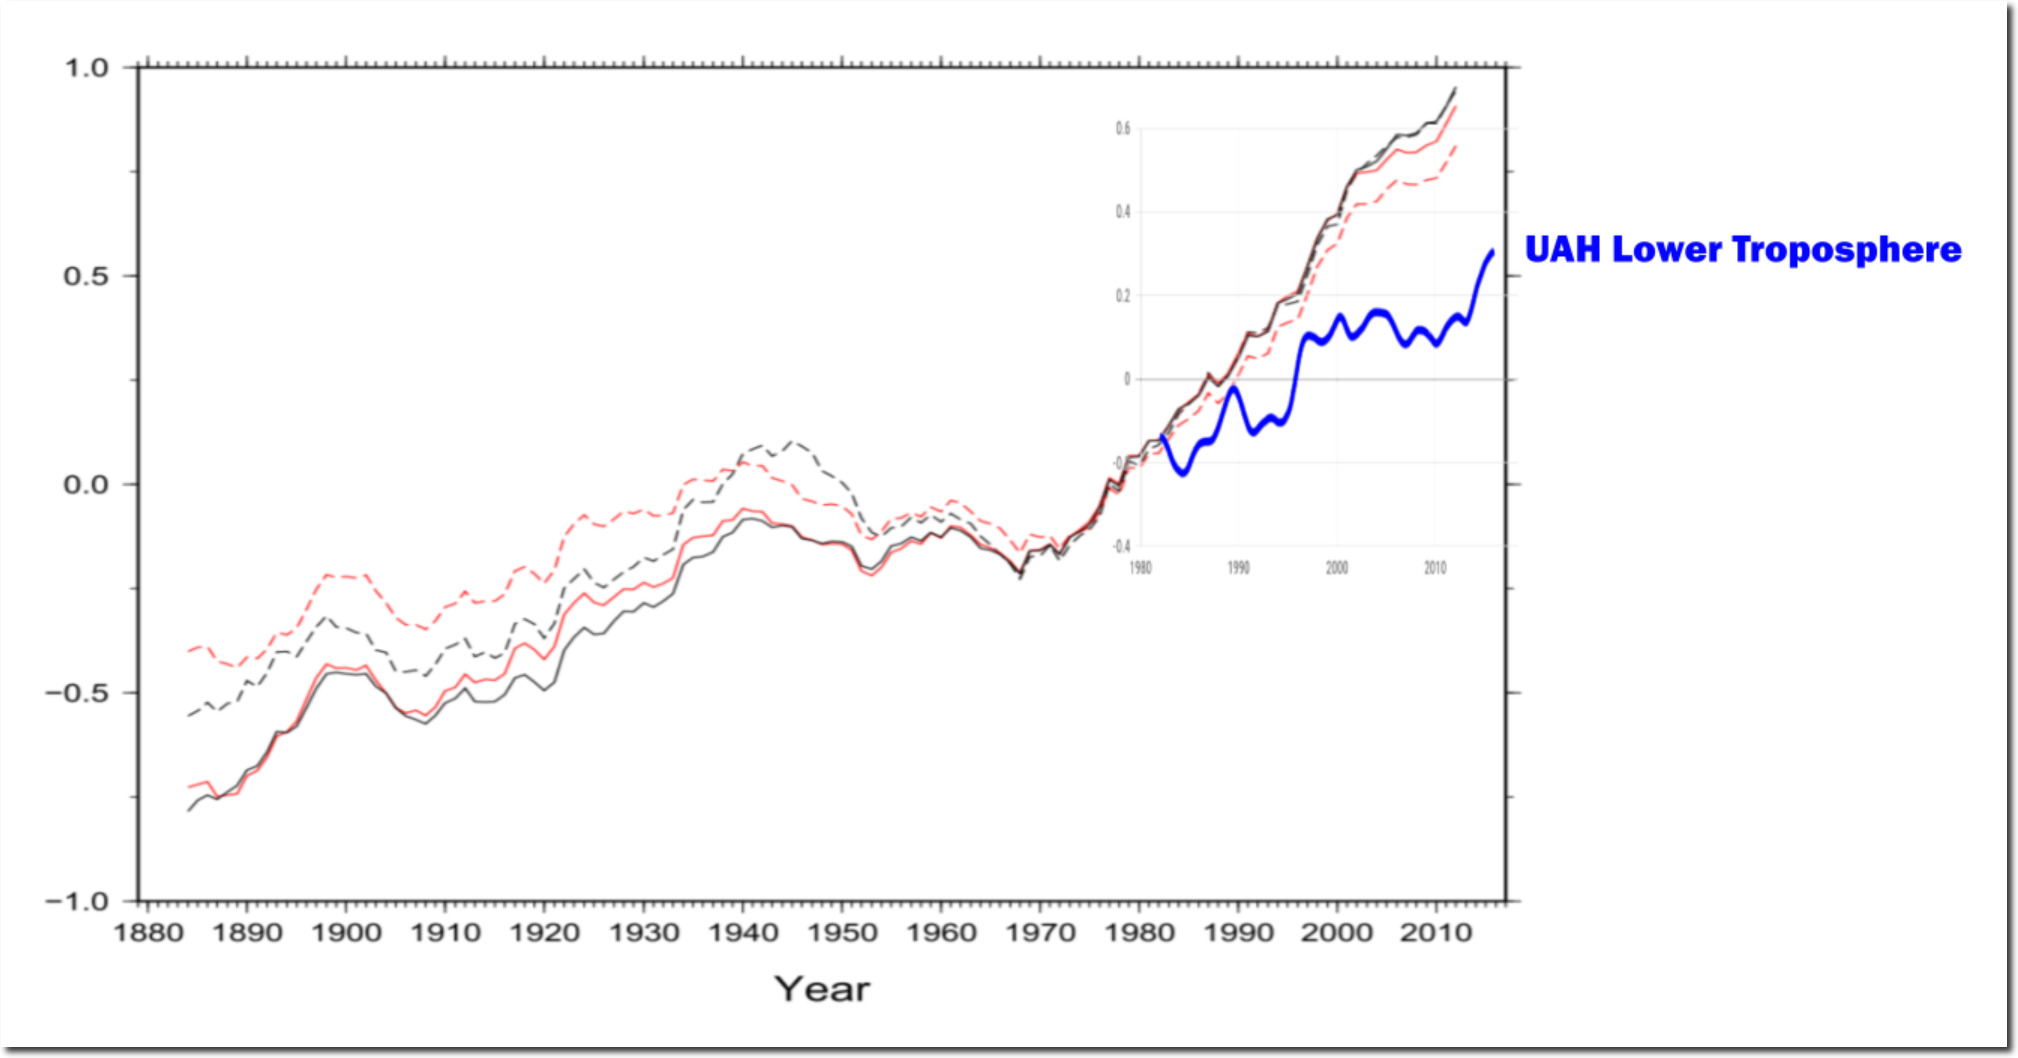
www.woodfortrees.org/data/uah6/mean:12
Over the past 20 years, NOAA and NASA have massively altered their data to increase warming. The graph below combines the 2000 version of NASA global surface temperatures, with lower troposphere temperatures – and shows a total of less than 0.8C warming since middle of the 19th century. Less than one half of the current claims by NOAA.
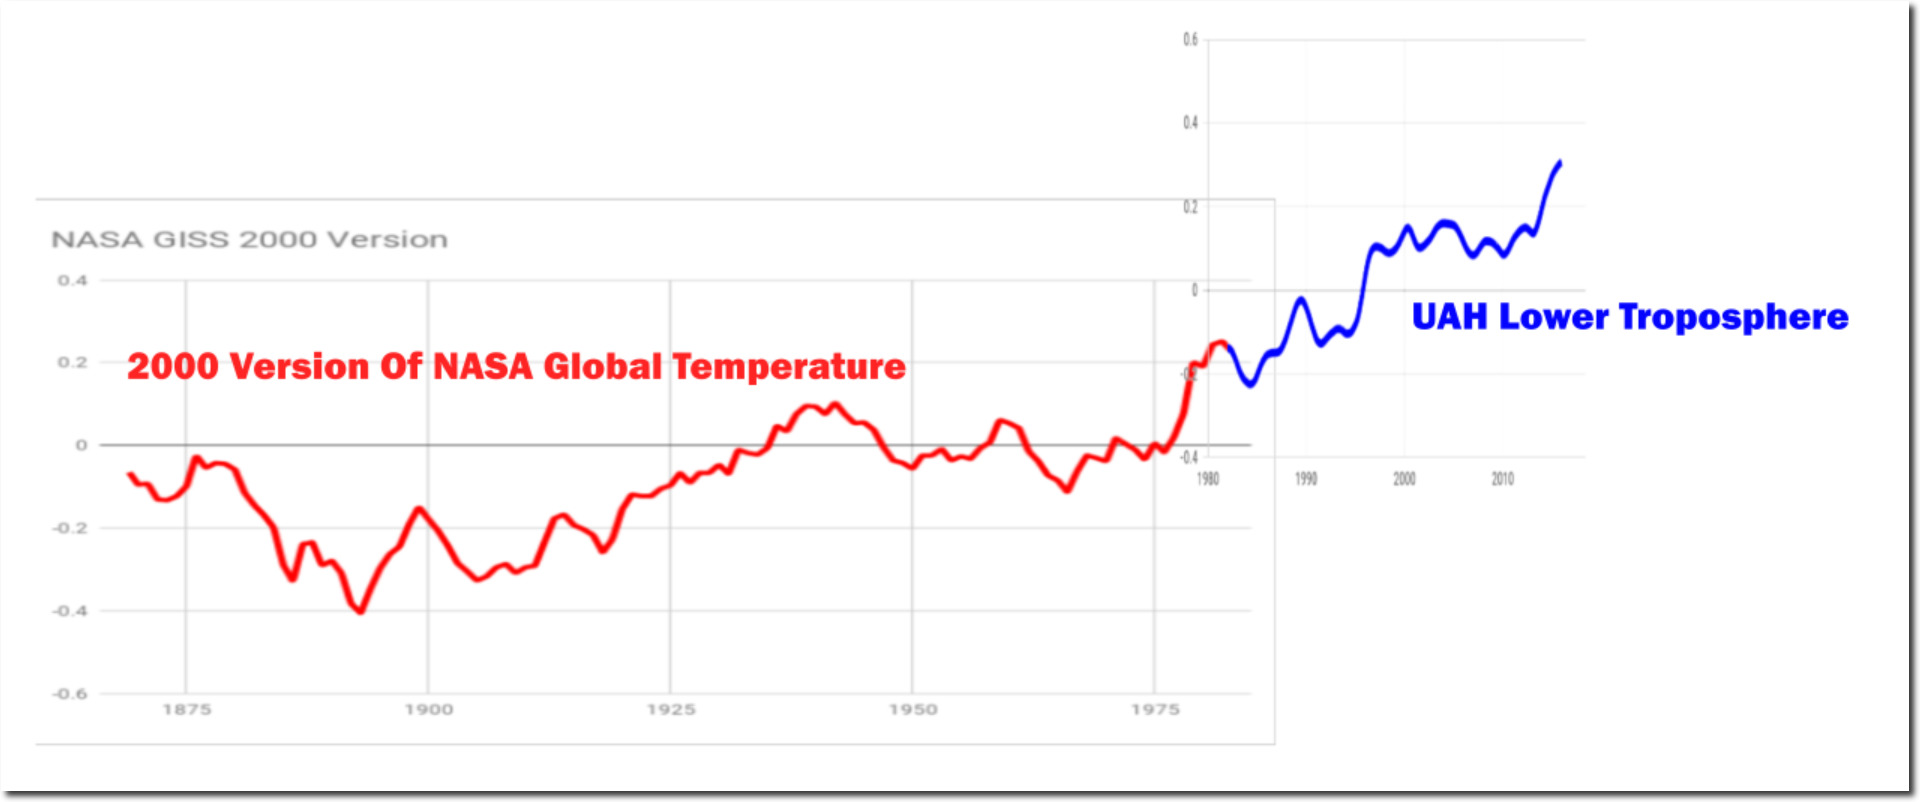
In the year 2000, NASA showed about 0.5C warming prior to 2000. Now they show nearly 1.5C warming prior to the year 2000.
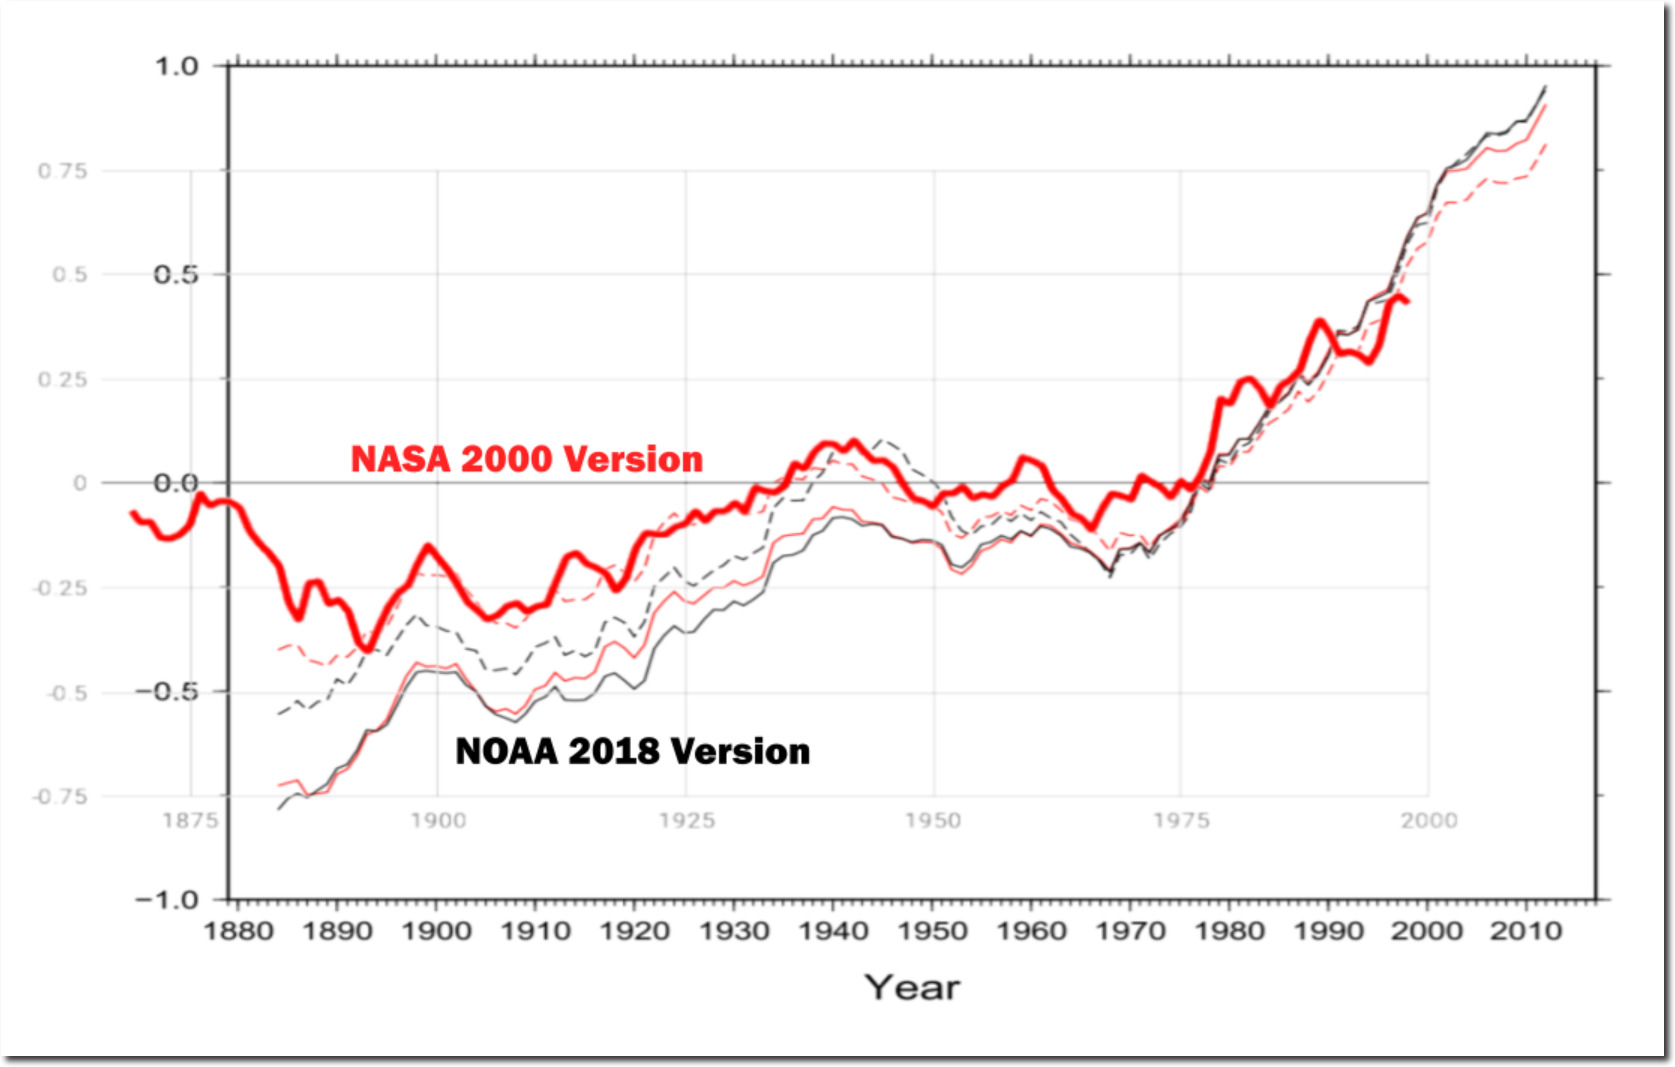
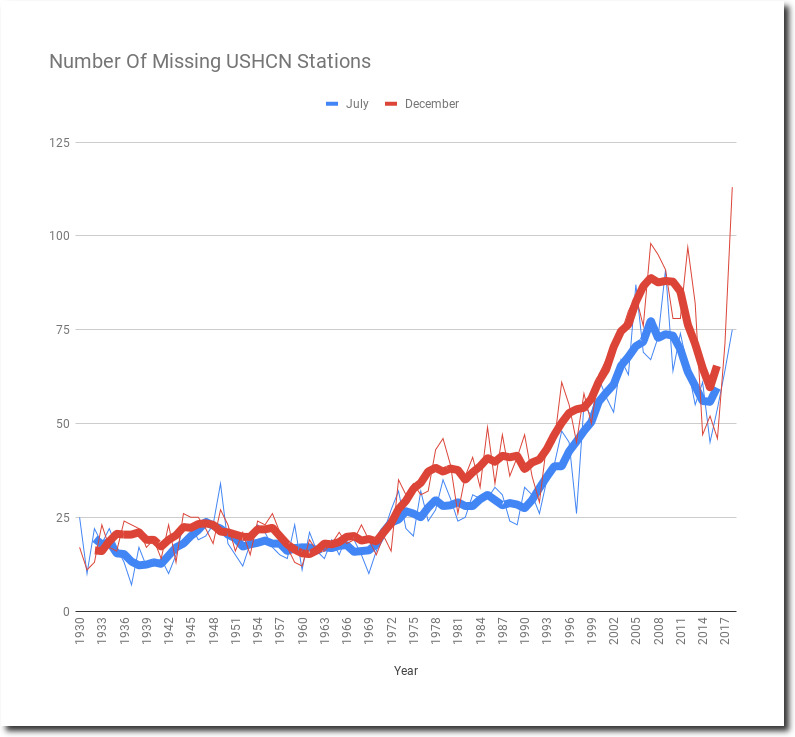
NASA and NOAA are constantly altering their data to cool the past and warm the present.
In 1989, NOAA said most global warming occured prior to 1919, and that earth cooled from 1921 to 1979.
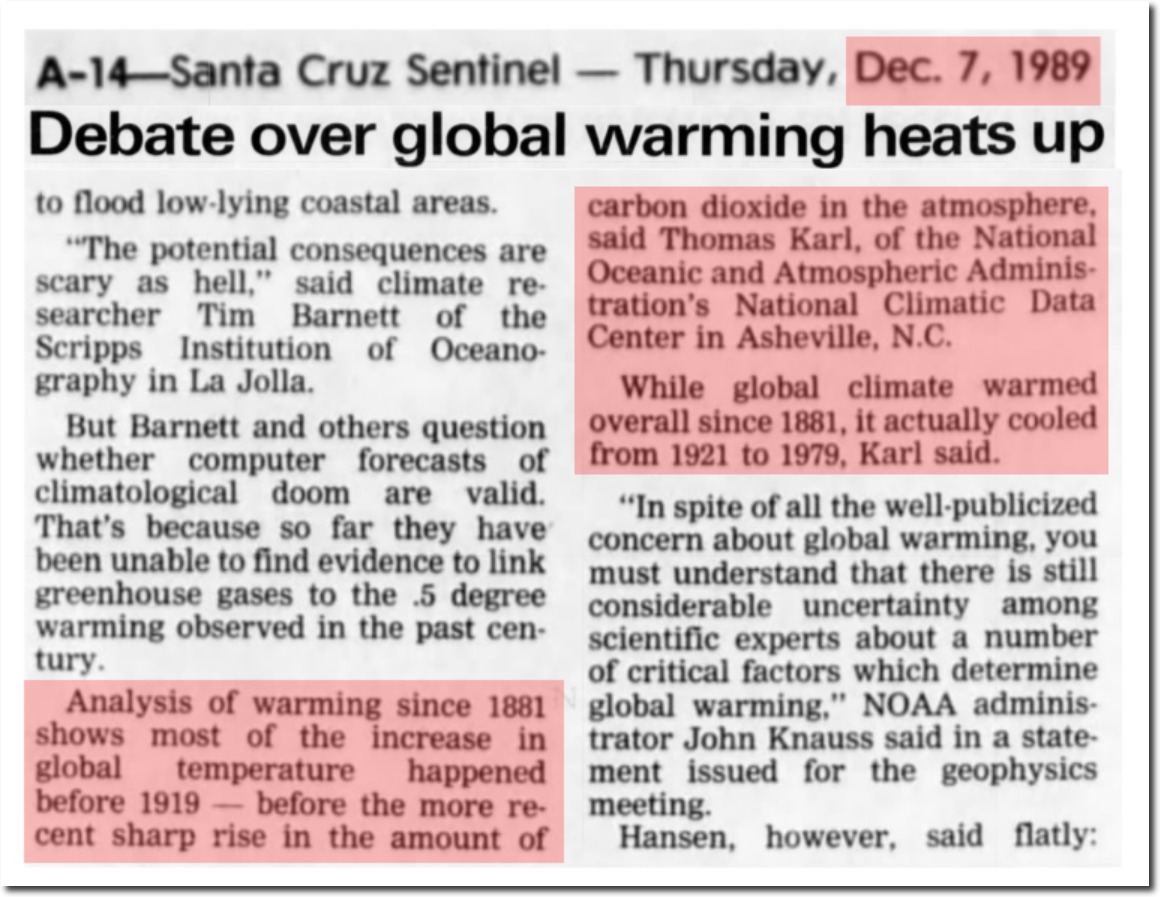
07 Dec 1989, Page 14 – Santa Cruz Sentinel at Newspapers.com
NOAA now shows 0.6C warming during the 1921 to 1979 cooling.
In 1978, experts said there was no end in sight to the 30 year cooling trend, which has now been completely erased by NOAA.
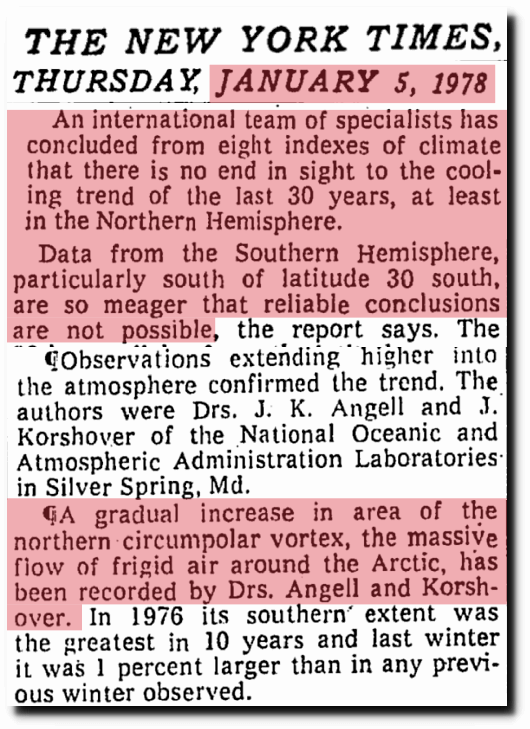
NOAA has turned that 30 year cooling trend into a warming trend.
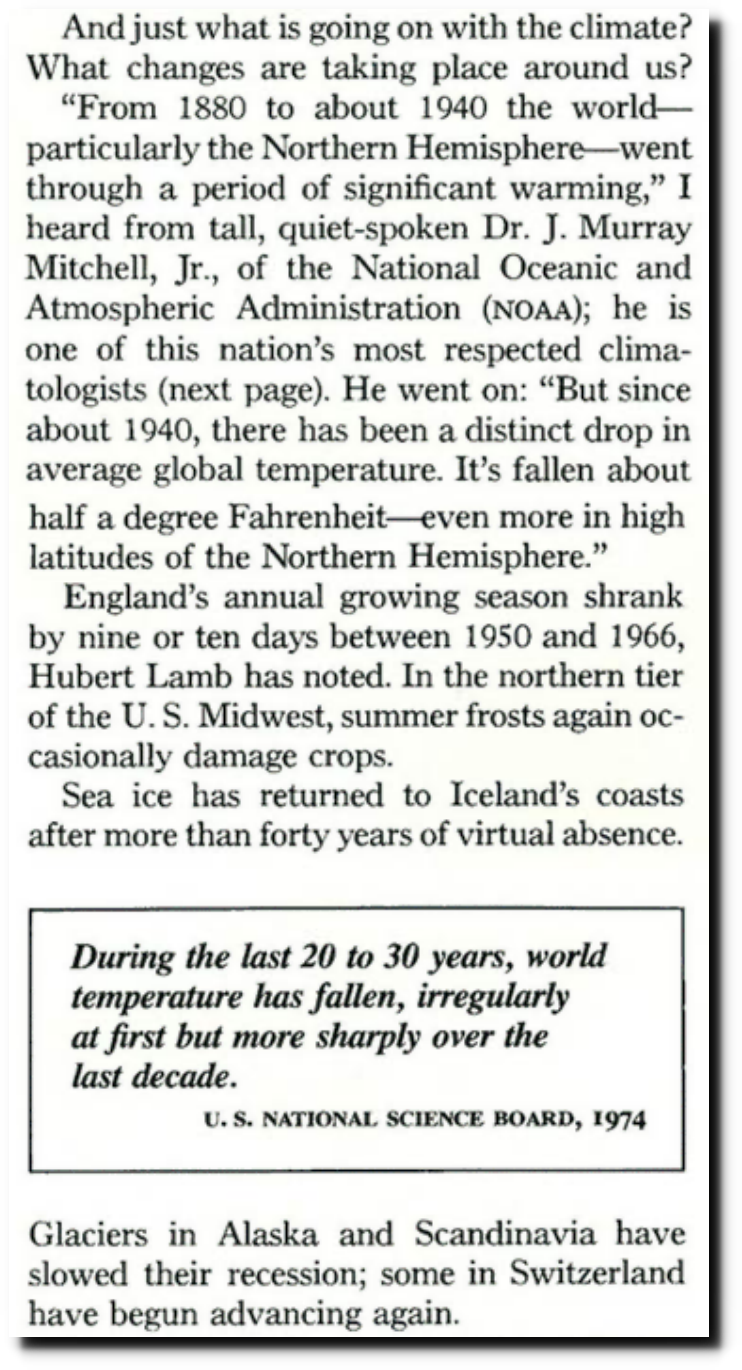
In 1978, NOAA showed about half a degree cooling from 1958 until 1976 – at both the surface and the troposphere.
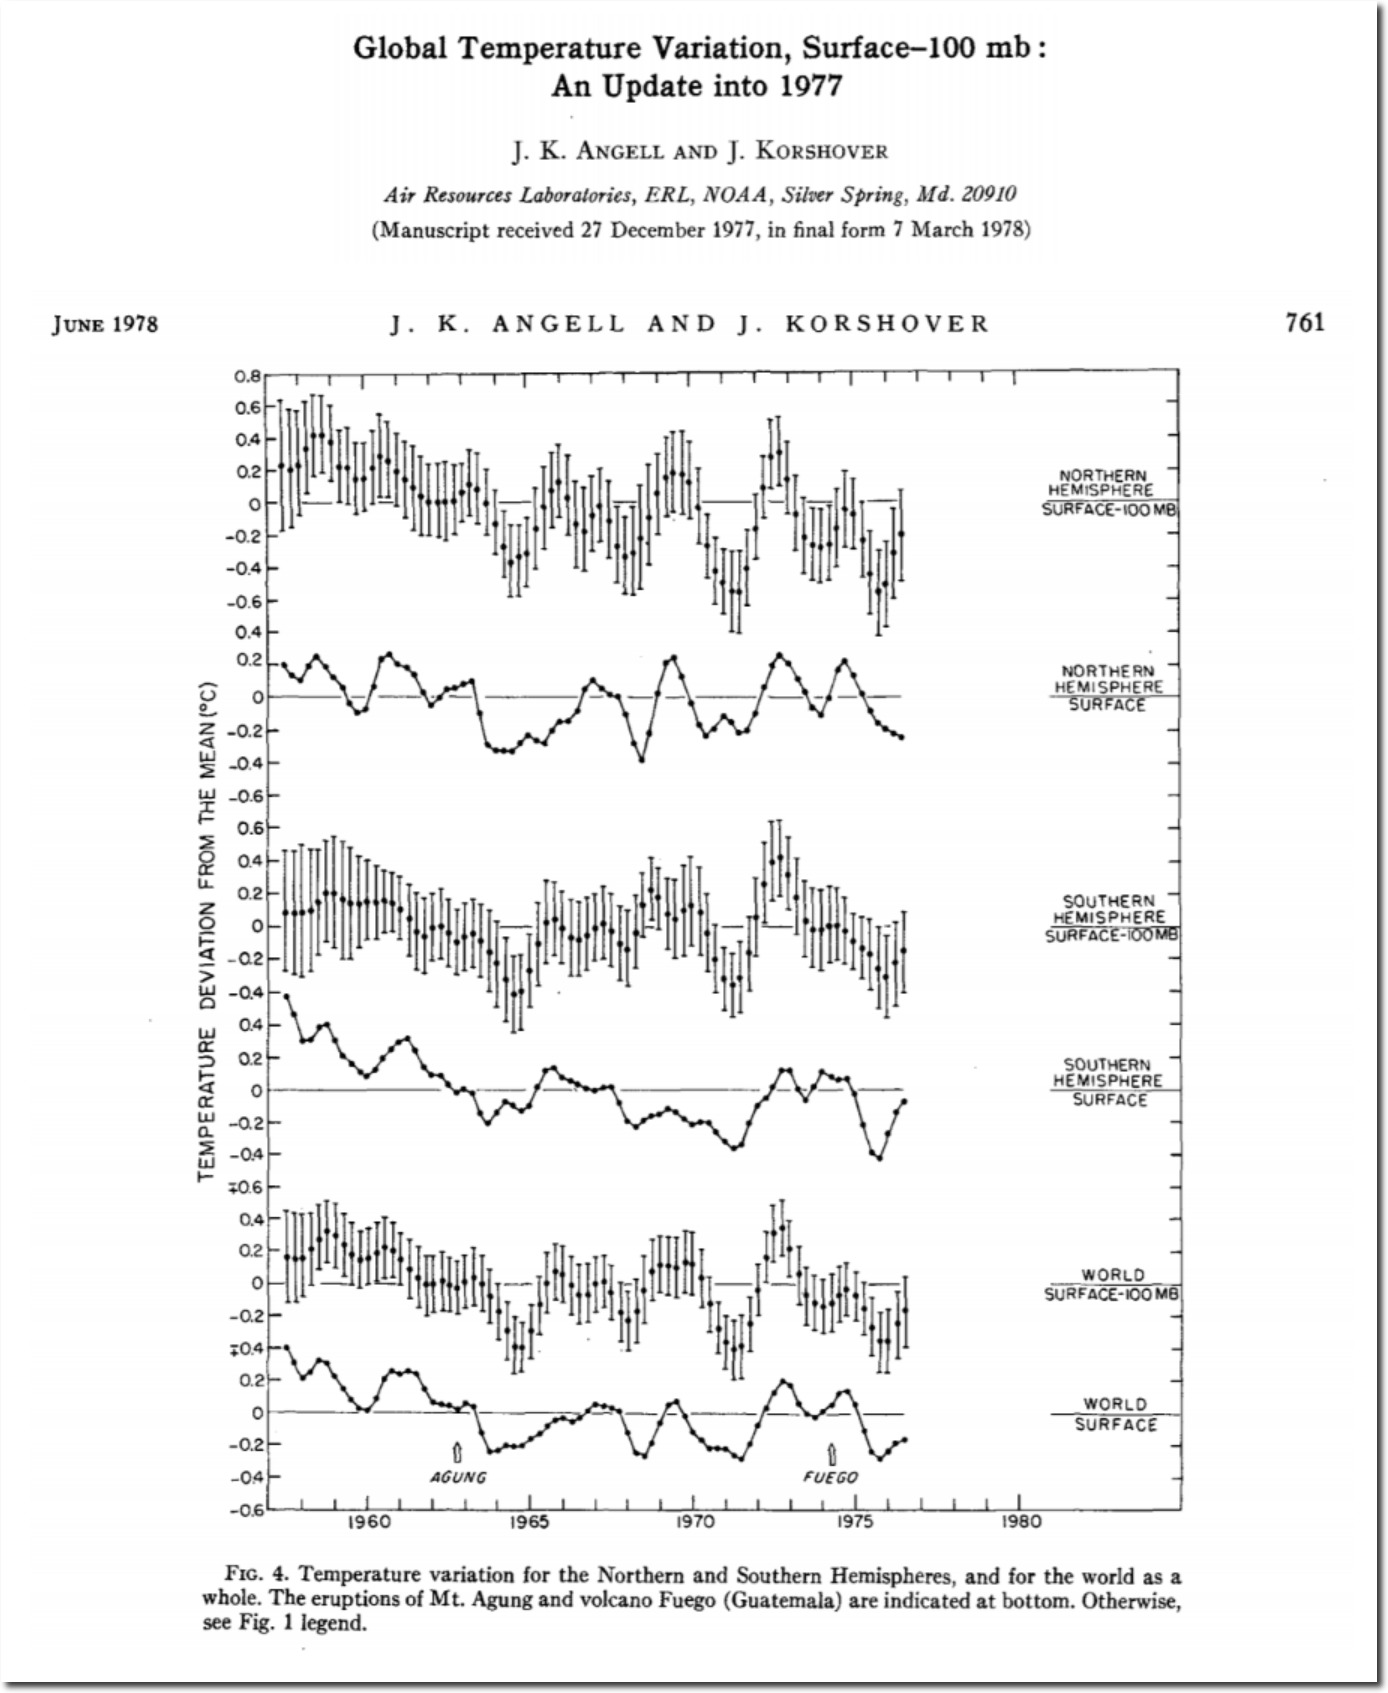
1520-0493(1978)106<0755:GTVSMA>2.0.CO;2
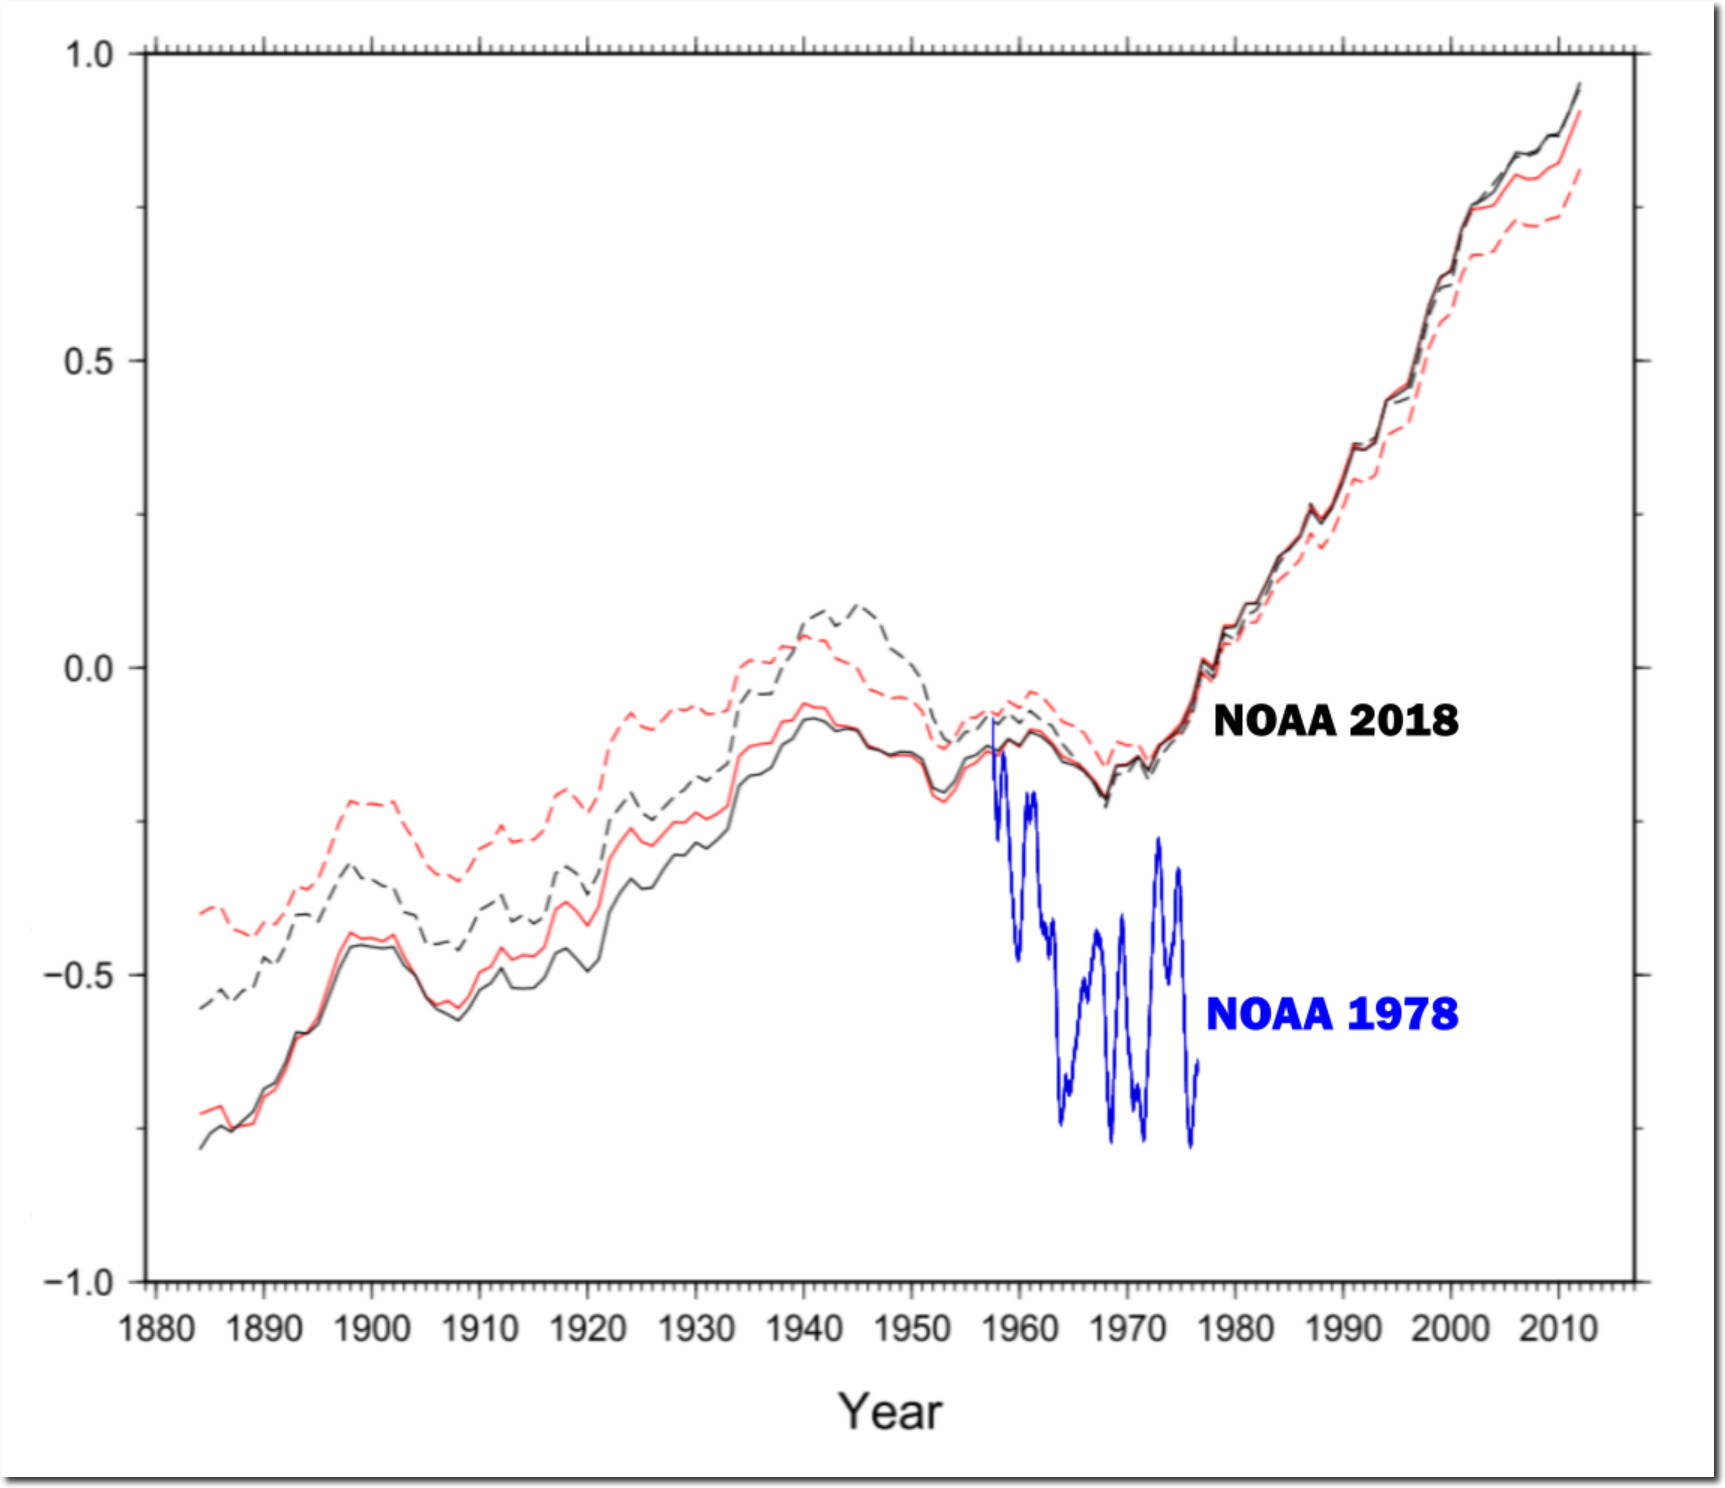
The graph below overlays the 1978 world surface temperatures on the current NOAA graph. You can see that 1976 was just as cold as the 1880s.
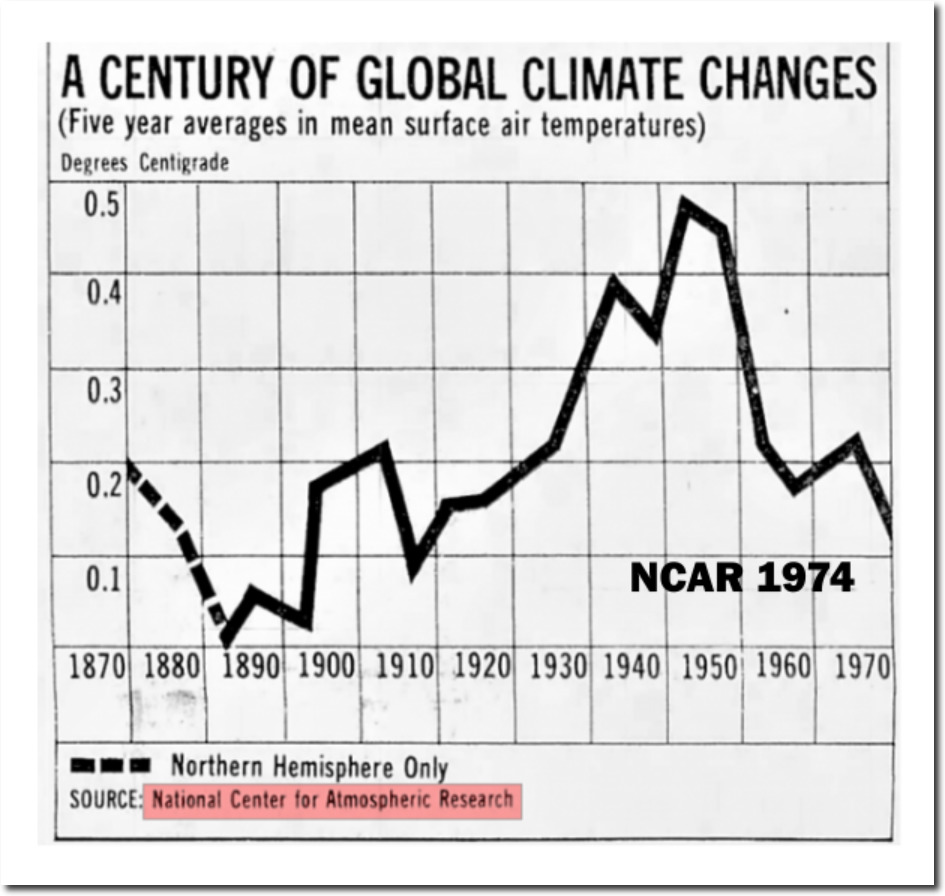
In 1974, the National Center for Atmospheric Research showed the same thing – 1970 was cooler than 1900.
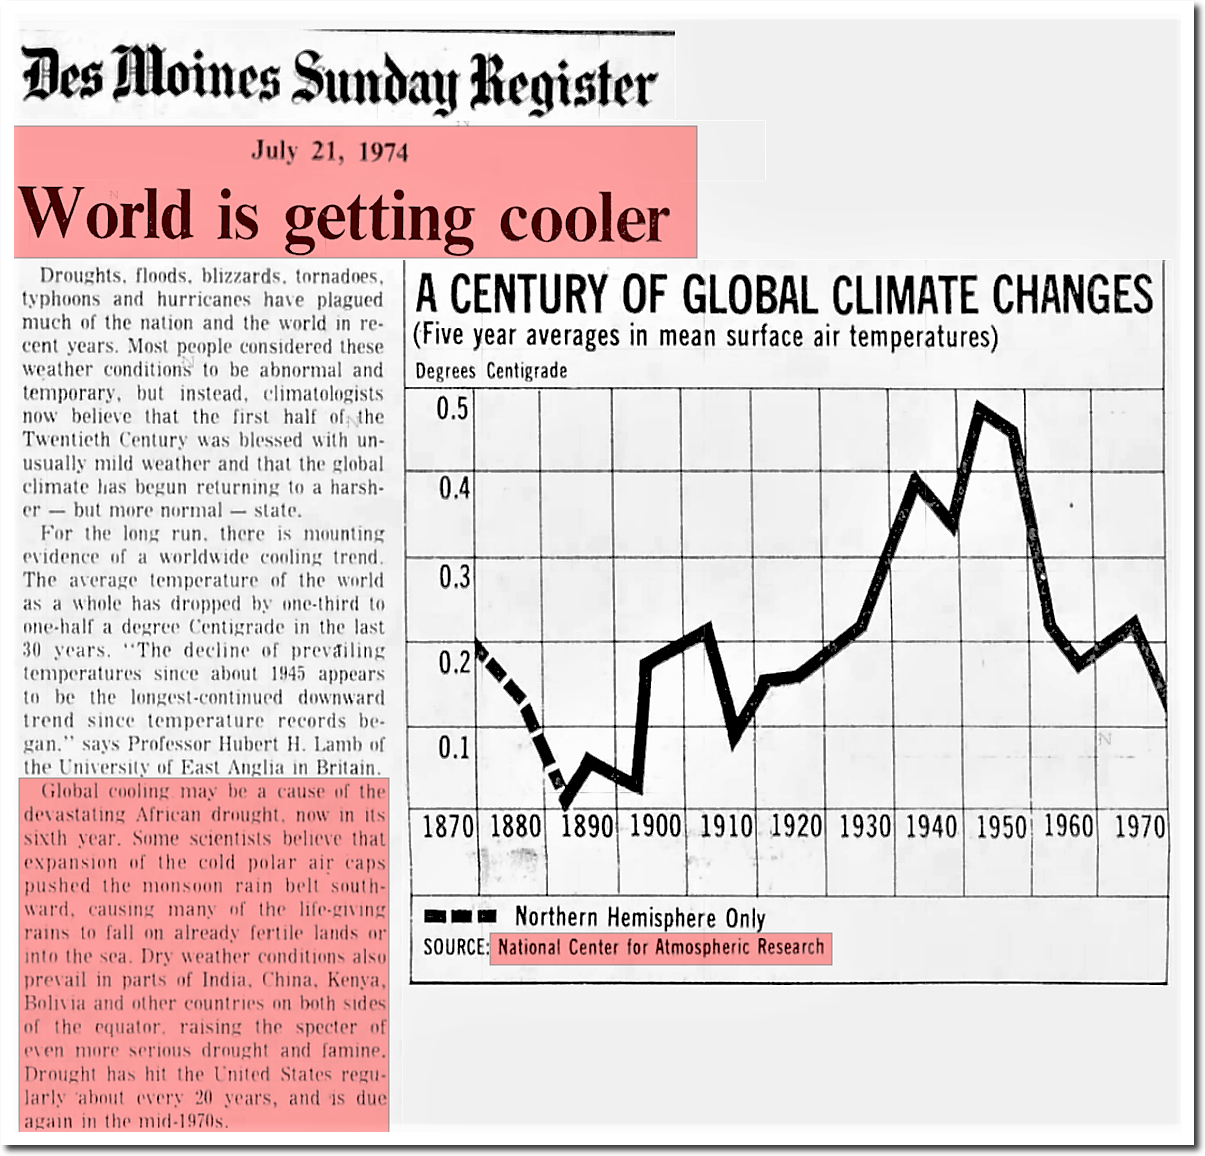
21 Jul 1974, 13 – The Des Moines Register at Newspapers.com
NOAA now shows 1970 about half a degree warmer than 1900.
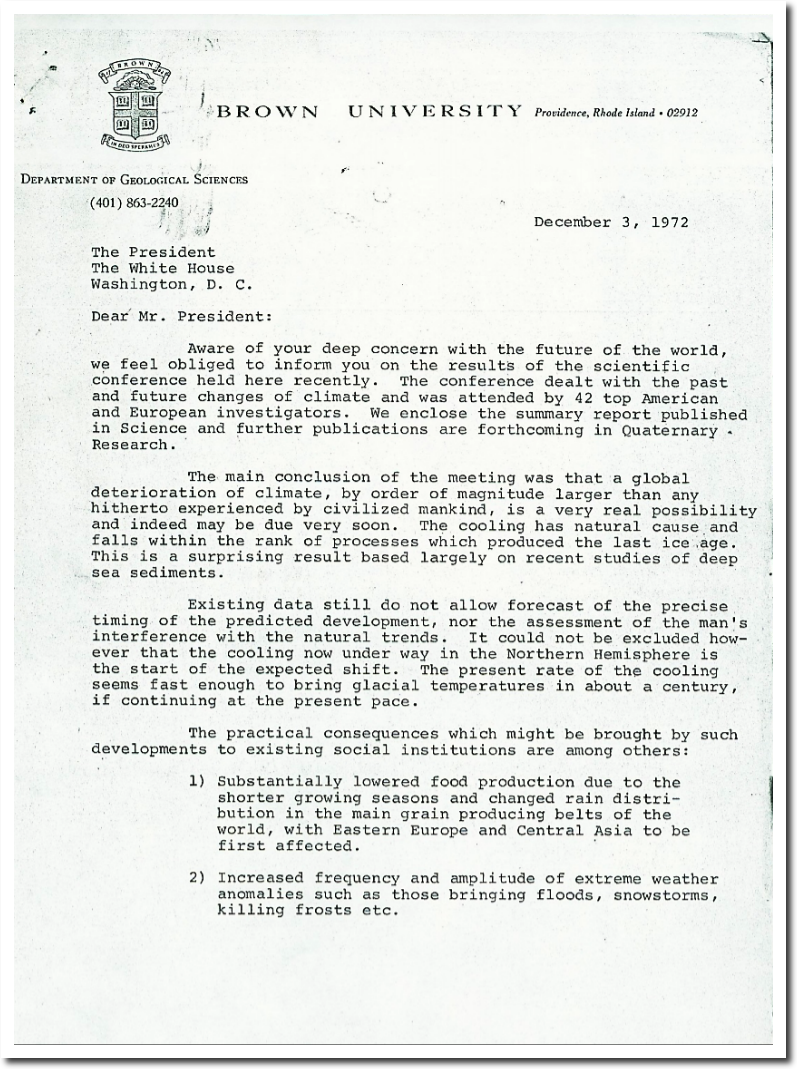
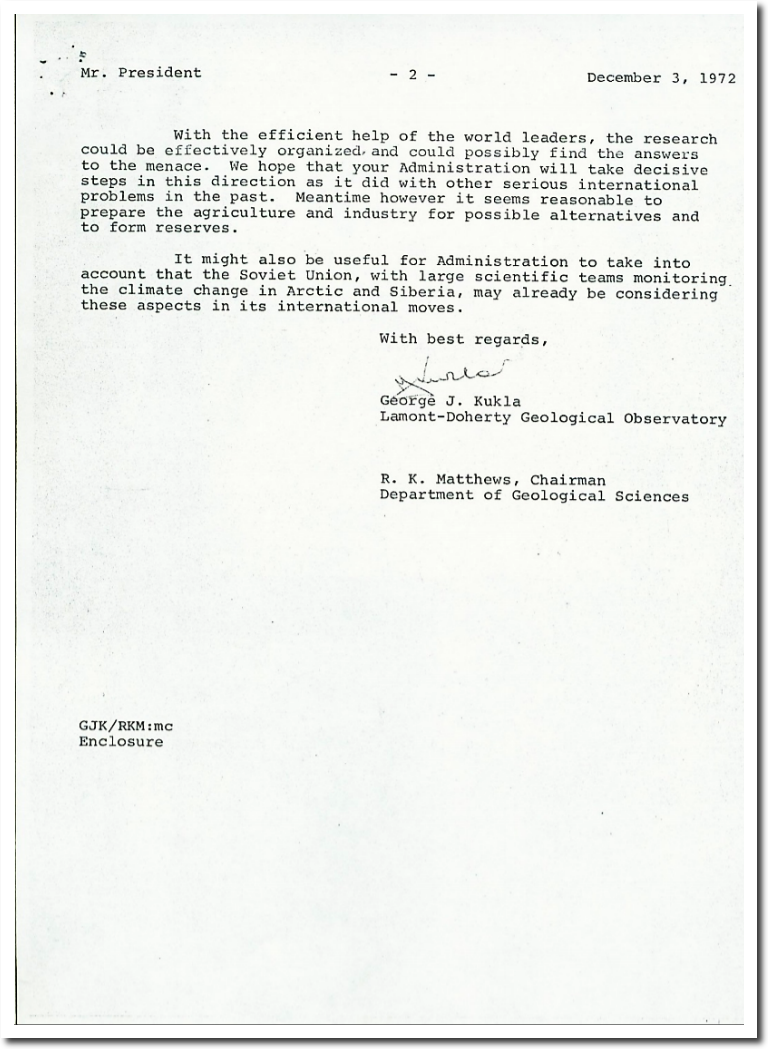
During the 1970s, scientists were so worried global cooling, that they wrote a letter to President Nixon warning of a new ice in about a century.
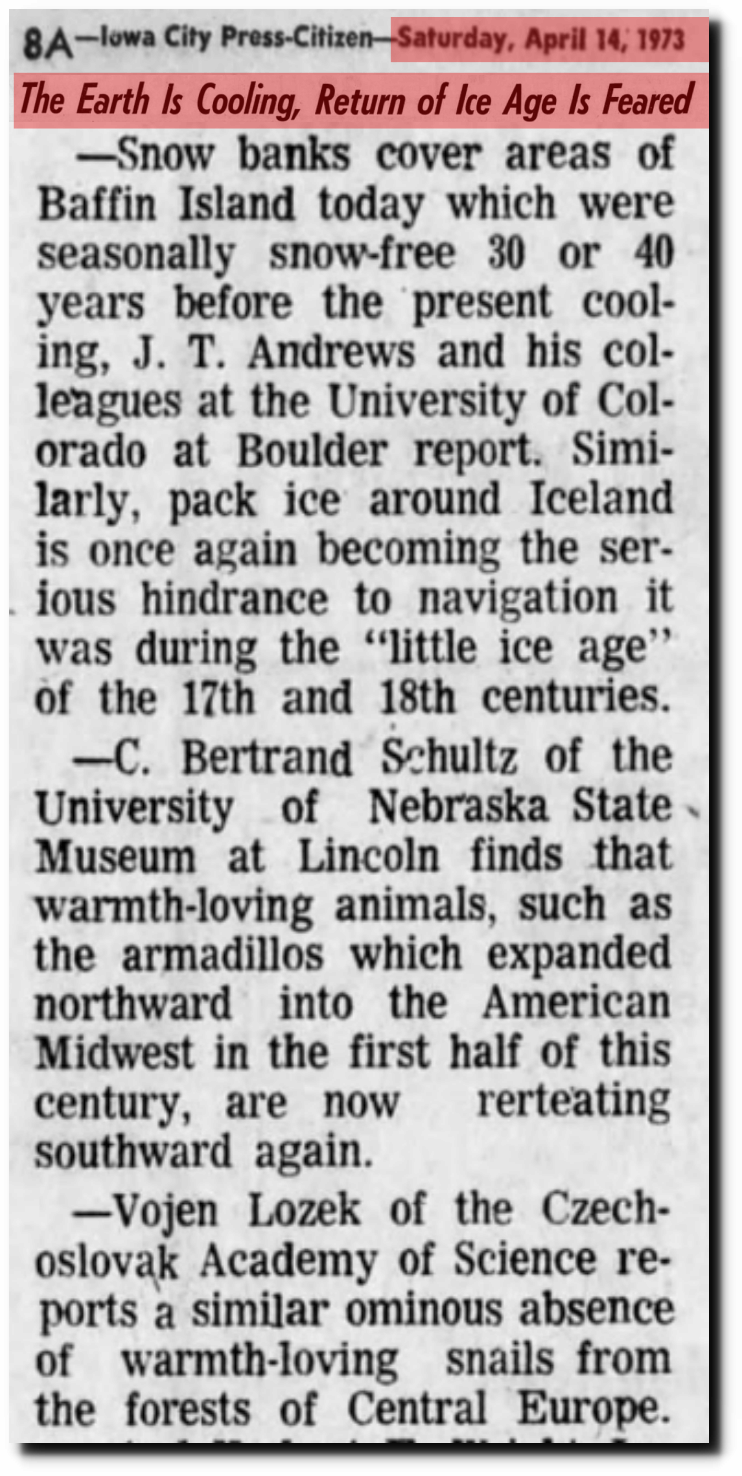
14 Apr 1973, Page 8 – Iowa City Press-Citizen
THE ROLE OF NOAA’S CLIMATE PREDICTION CENTER IN THE DEVELOPMENT OF CLIMATE SERVICES
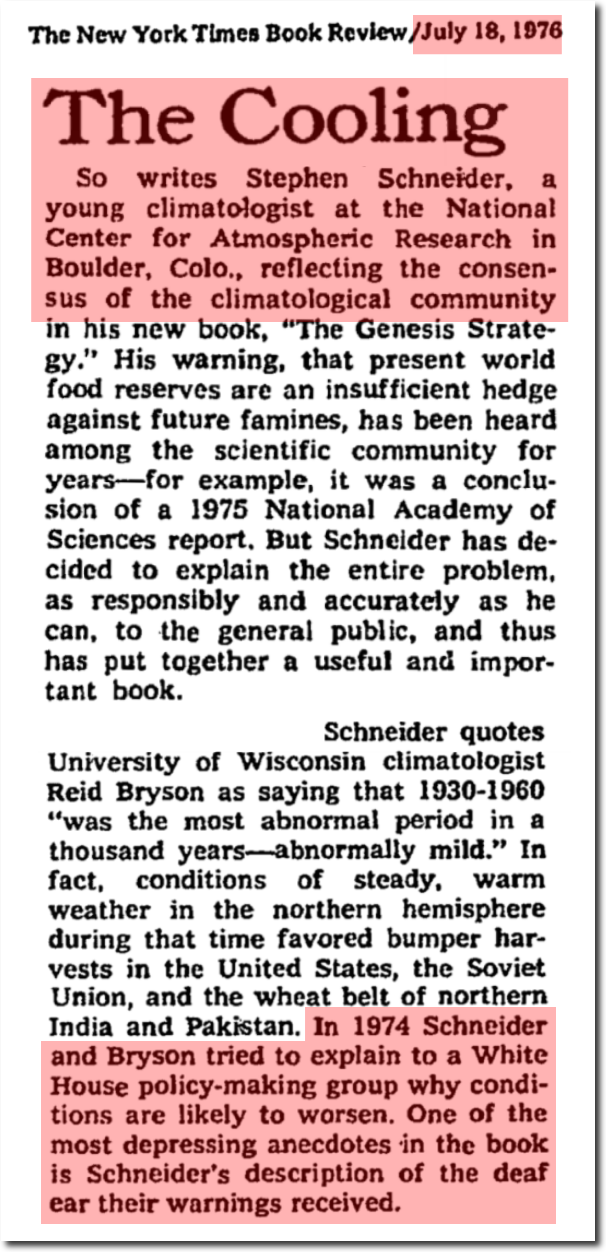
The Genesis Strategy – The New York Times
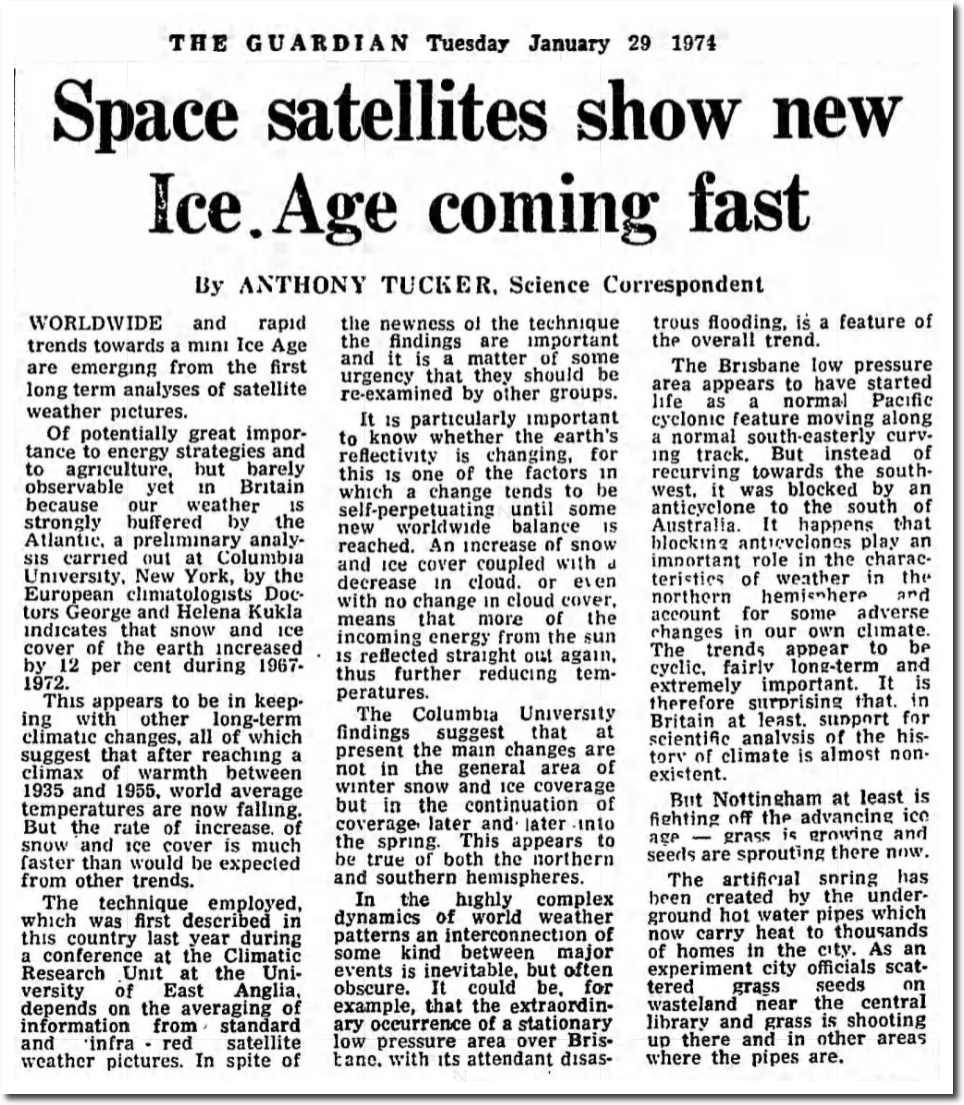
29 Jan 1974, 5 – The Guardian at Newspapers.com
The National Geographic Archive | November 1976 | page 1
There was unanimous consensus that earth was cooling.
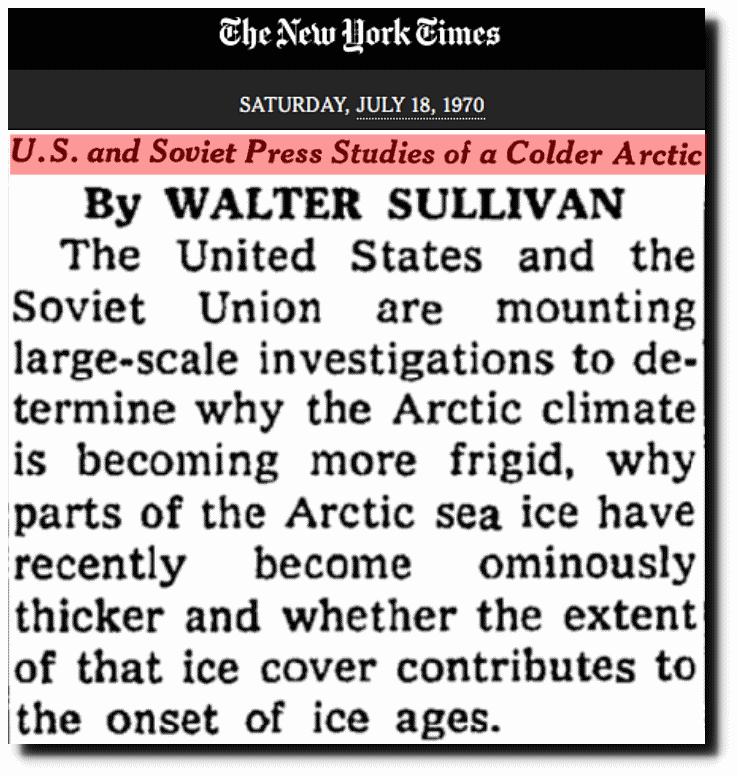
U.S. and Soviet Press Studies of a Colder Arctic – The New York Times
Climategate E-mails show that climate scientists openly discussed their plans to alter past data and cool the past, and that is exactly what they have done.
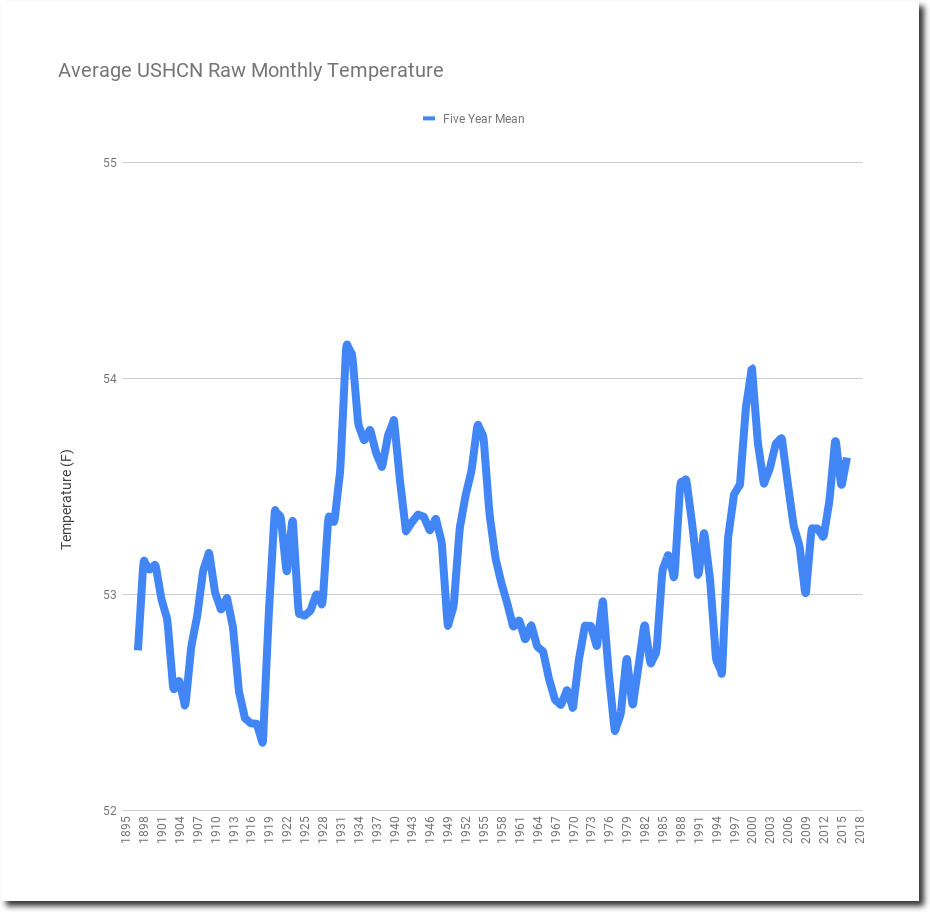
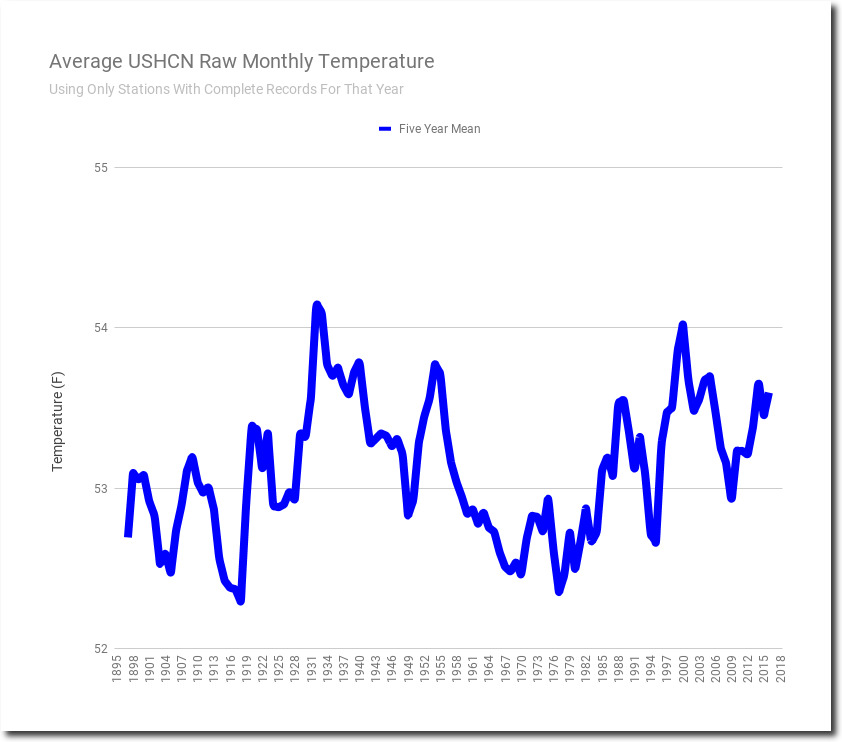
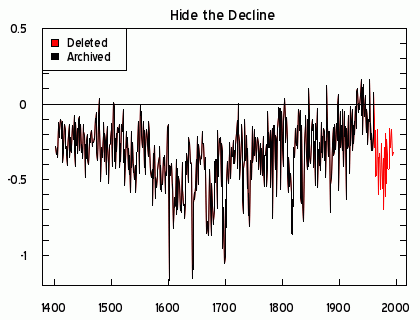
The 1940s blip has been removed, just as climate scientists colluded to do.
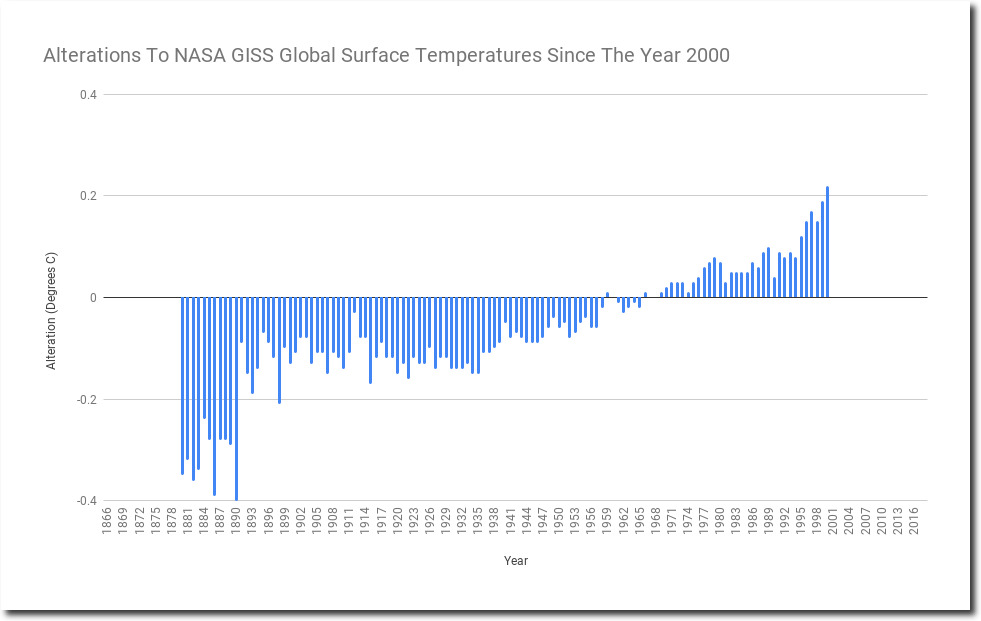
Climate alarmists frequently claim temperature adjustments reduce warming, but as you can see in the graph above, that claim is patently false. Prior to 1970, the adjusted temperatures are cooler than the measured temperatures, which increases warming.
This fake thermometer data is what Michael Mann grafted on to the proxy data, after he hid the inconvenient decline. And he used the fake thermometer data as his justification to hide the proxy data.
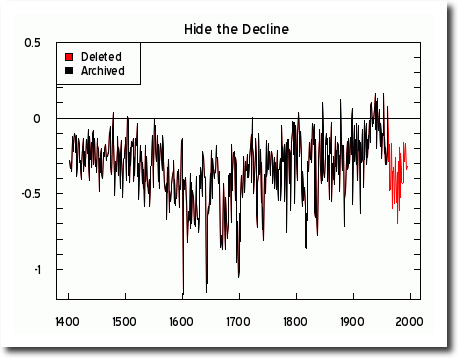
Before they could hide the decline in proxy temperatures, NOAA had to hide the decline in the surface temperatures.

In the absence of any actual evidence of warming, policymakers depend entirely on fake temperature graphs from NOAA and NASA, who make their graphs faker and faker every year – in an attempt to seize control of public policy. This is exactly what President Eisenhower warned about in his farewell address.
The prospect of domination of the nation’s scholars by Federal employment, project allocations, and the power of money is ever present and is gravely to be regarded.
Yet, in holding scientific research and discovery in respect, as we should, we must also be alert to the equal and opposite danger that public policy could itself become the captive of a scientific-technological elite.
Our Documents – Transcript of President Dwight D. Eisenhower’s Farewell Address (1961)
Posted in Uncategorized
Leave a comment
EPA 1983 : Ten Feet Of Sea Level Rise In The Next Few Decades
Apparently Florida is underwater. Experts say so.
01 May 1983, 1 – The Baltimore Sun at Newspapers.com
They also said the climate of New York will be like Florida (which will be underwater.)
19 Oct 1983, 2 – Messenger-Inquirer at Newspapers.com
Now climate scientists say global warming makes winters cold and snowy, and that they predicted it all along.
Posted in Uncategorized
Leave a comment
Extreme Wildfire Fraud In The National Climate Assessment
Yesterday I showed how the National Climate Assessment is committing blatant fraud about heat waves, by hiding the data which shows their claims are inverted from reality.
Extreme Fraud In The National Climate Assessment | The Deplorable Climate Science Blog
In this post, I show how they are doing exactly the same thing with wildfires. They show US burn acreage rapidly increasing.
The graph was taken from page 38 of the Fourth National Climate Assessment document released in November 2018.
Fourth National Climate Assessment, Volume II: Impacts, Risks, and Adaptation in the United States
But why did they start their graph in 1983? The US has very detailed burn acreage data going back for more than a century, and it was much higher prior to 1970.
Indicator 3.16: Area and percent of forest affected by abiotic agents
I overlaid the National Climate Assessment Graph on the Forest Service graph, and it becomes clear exactly what they are doing. Like in the the heatwave graph, they picked the lowest point for their start date, so that they could show an upwards trend – and deceive the public.
They hid essentially all of the essential data, which shows that burn acreage is down 80% in the US over the past 90 years.
Burn acreage was very carefully tracked and reported during the 1930s. People split the atom and built the Golden Gate Bridge during the 1930s. It is not surprising that they also knew how to do the basic mathematics which climate scientists seem to be incapable of.
The same story in California. Last year had very high burn acreage, but the trend since the 1930’s is generally down.
In 1936, forest fires were seen as the greatest threat to prosperity.
05 Dec 1936, Page 7 – Santa Cruz Evening News at Newspapers.com
And as always, the fraudulent work of the National Climate Assessment is backed by many other fraudsters, like the Union of Concerned Scientists.
Is Global Warming Fueling Increased Wildfire Risks? | Union of Concerned Scientists
Posted in Uncategorized
Leave a comment
Guardian 1989 – Only Communism Can Stop Twelve Feet Of Sea Level Rise
Thirty years ago, The Guardian and Canberra Times said that without global communism, sea level would rise one to four meters by the year 2030.
GOVERNMENTS must yield national sovereignty to multilateral authorities able to enforce laws “across environmentally invisible frontiers”
A Commonwealth Expert Group set up to look at climate change estimated there was a 90 per cent certainty that …. sea levels would rise by between one and four metres, by the year 2030.
26 Jan 1989 – Call for anti-greenhouse action – Trove
Who would house the displaced populations of low lying areas like the Maldives, a chain of 1200 islands barely above sea level? Current attitudes to refugees and immigrants in most countries did not suggest that large population movements were feasible. Acceptance of an enhanced risk of large scale drowning was clearly not an option.
The Canberra Times also said the Maldives would be underwater by 2018.
26 Sep 1988 – Threat to islands
We didn’t listen, and look what happened to the Maldives.The ocean now extends all the way to the edge of the beach.
Posted in Uncategorized
Leave a comment


