
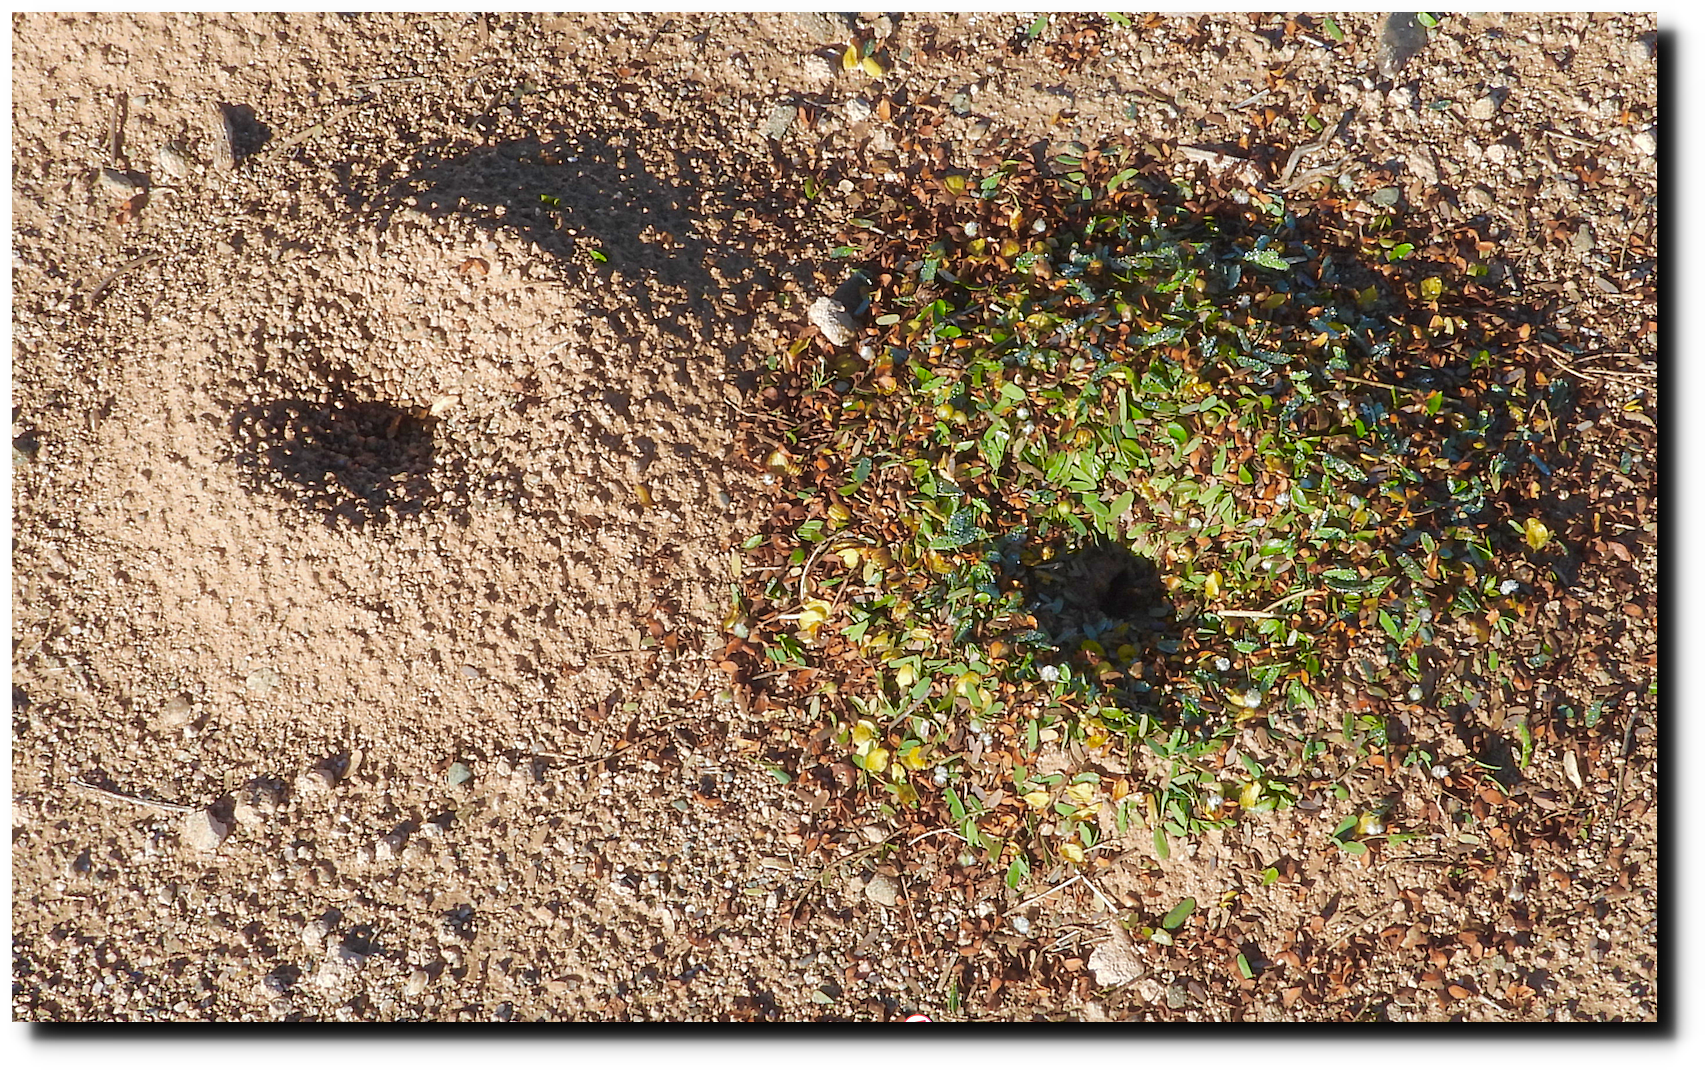
This colony of artistic ants decorated their home with creosote leaves and blossoms.
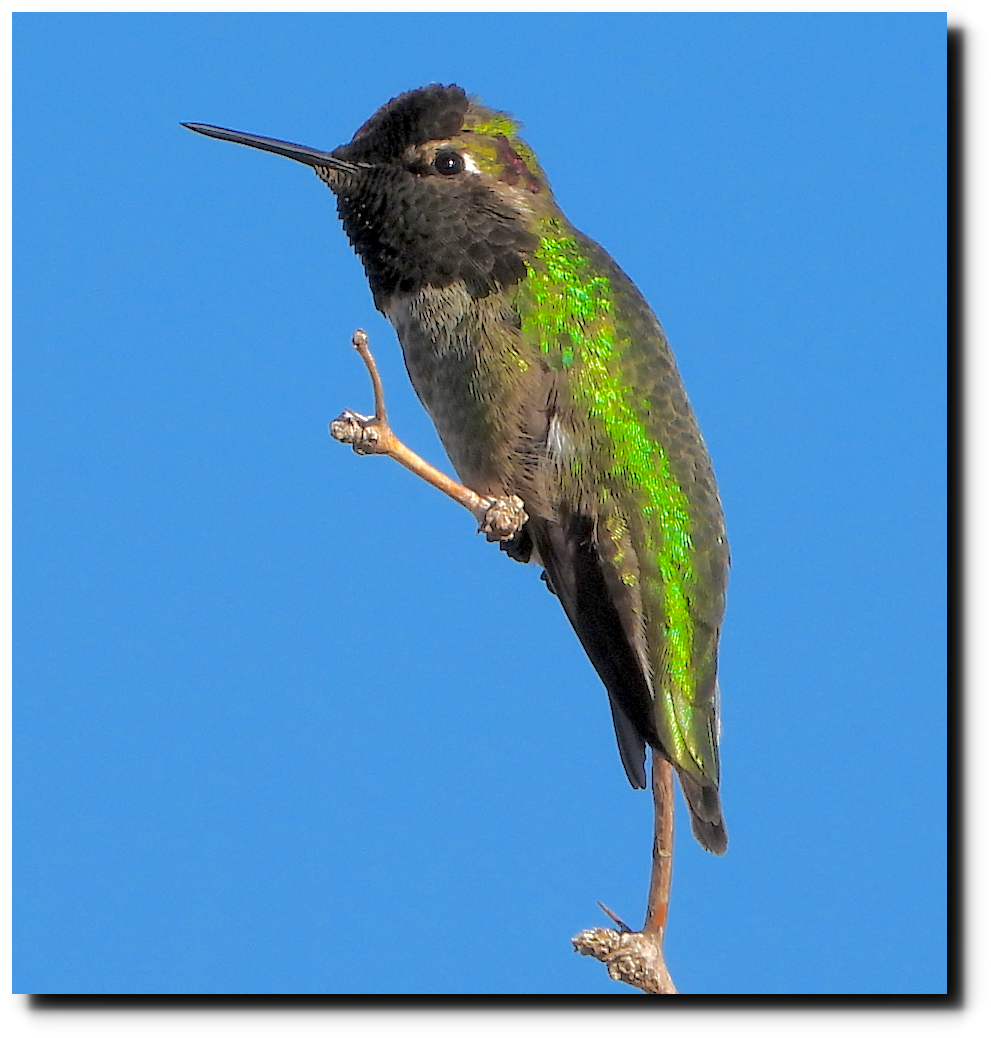
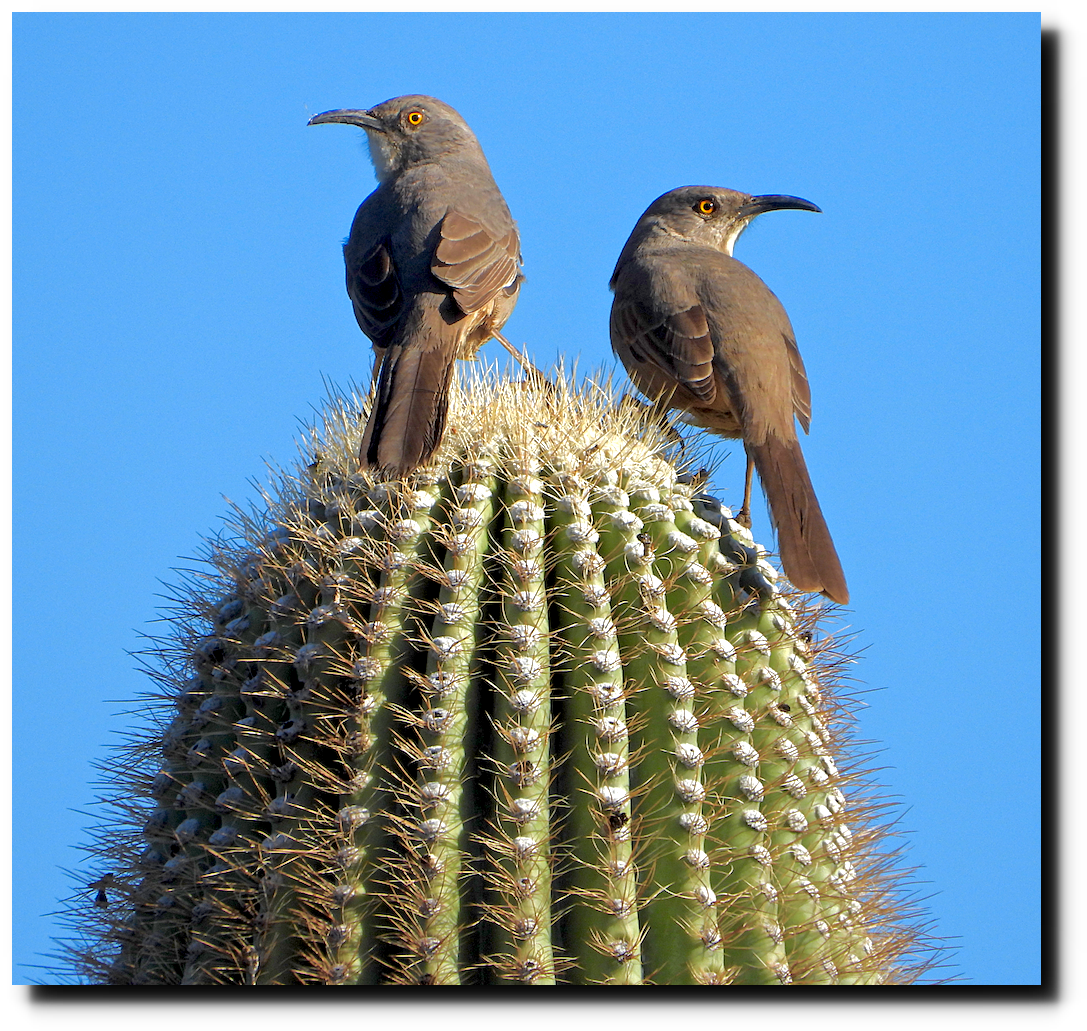
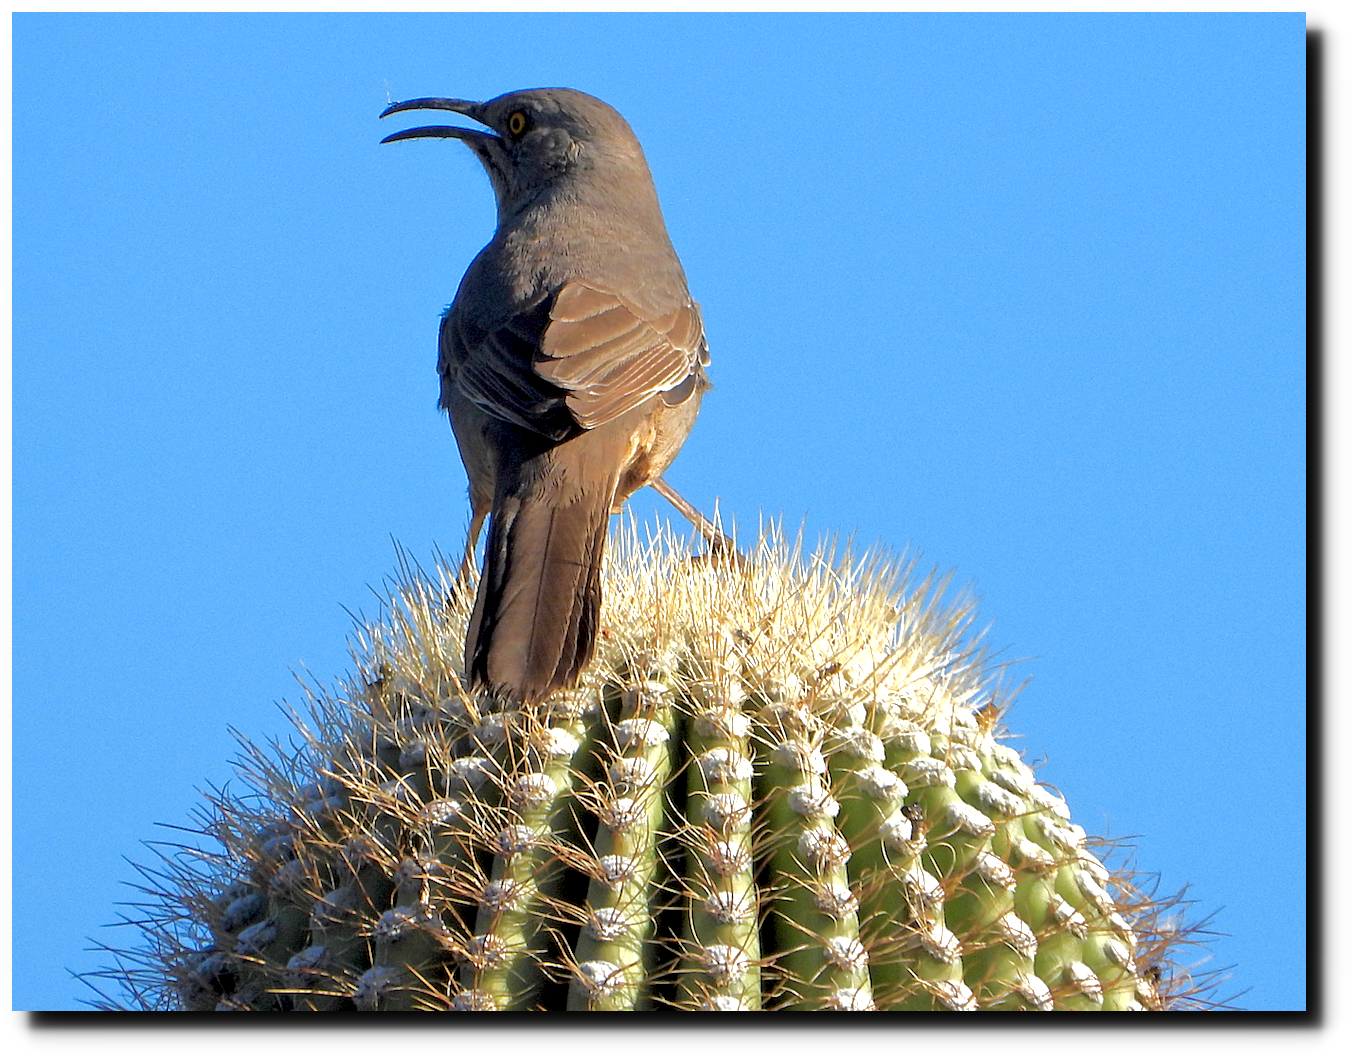
The local birds are also decked out in their holiday colors.


This colony of artistic ants decorated their home with creosote leaves and blossoms.
The local birds are also decked out in their holiday colors.
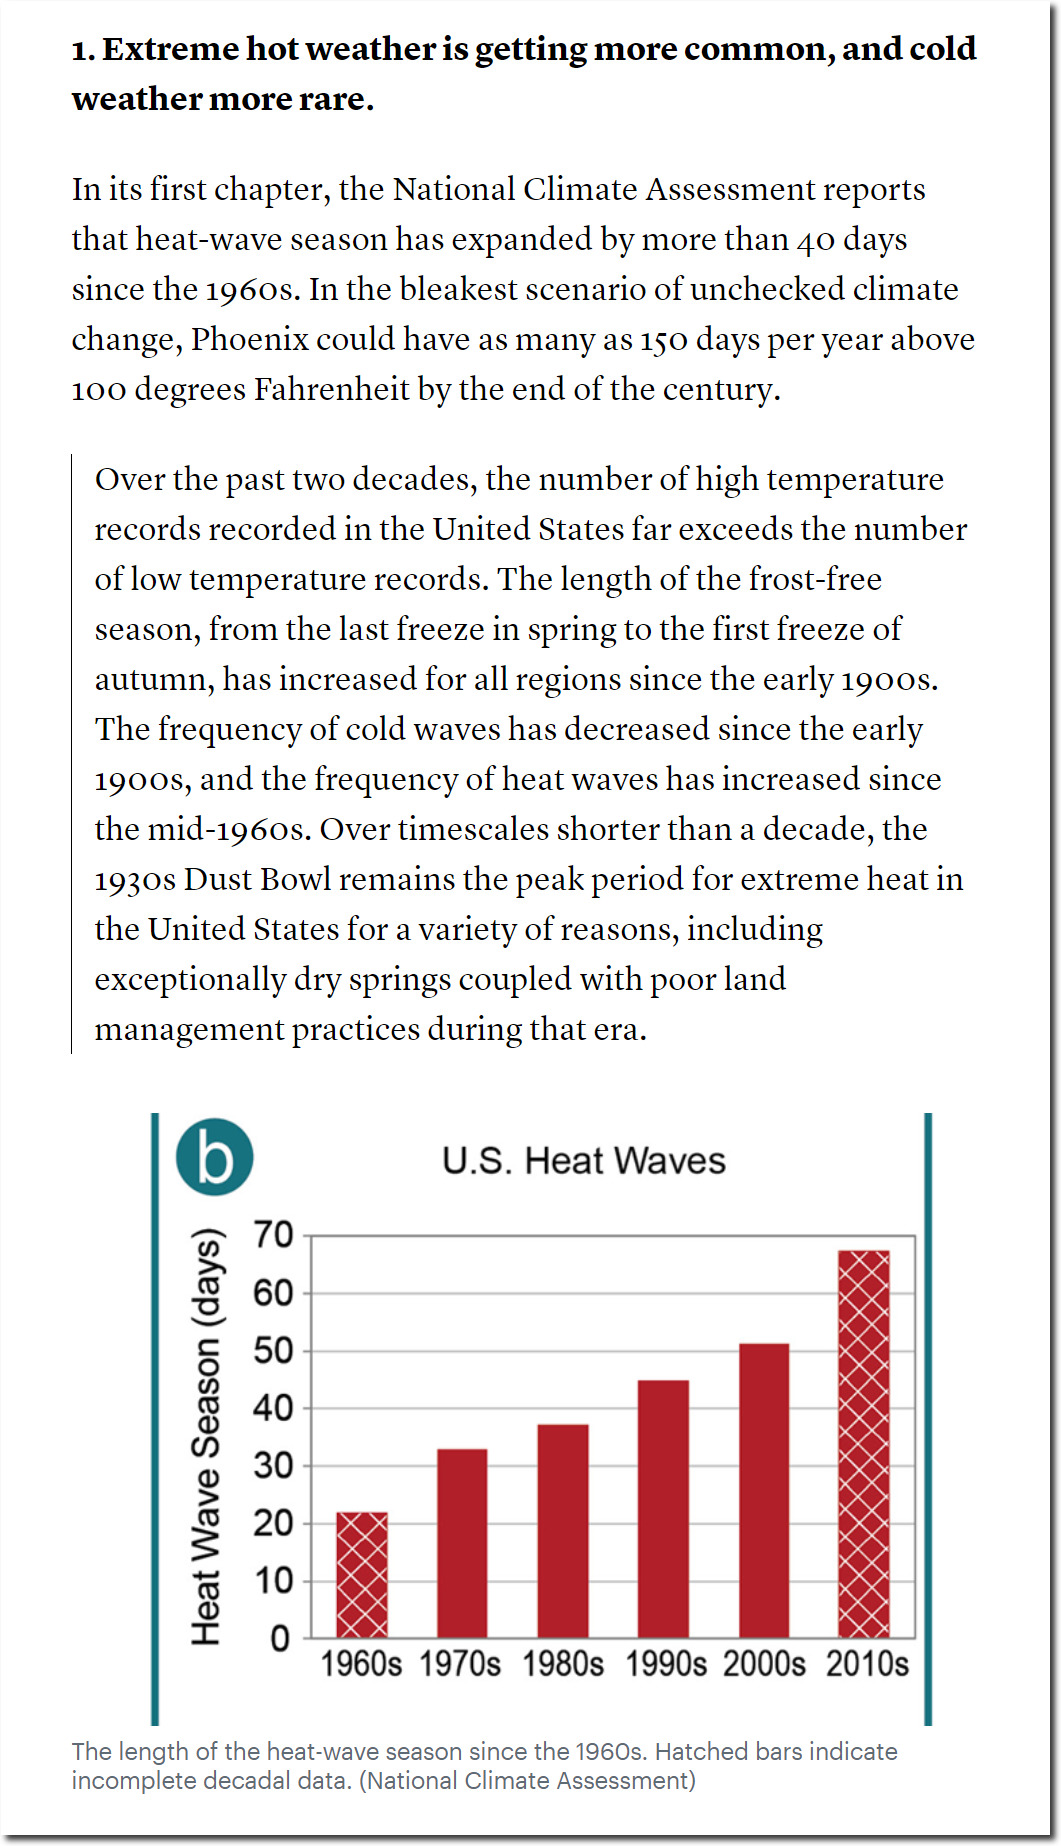
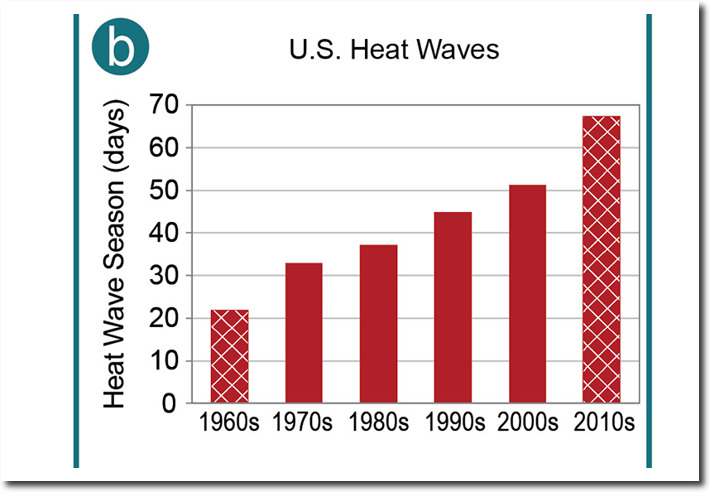
Katharine Hayhoe’s and Michael Mann’s National Climate Assessment is laced with fraud, starting in the first chapter where they claim heatwaves are becoming more common in the US.
The Most Chilling Parts of the 2018 Climate Assessment – The Atlantic
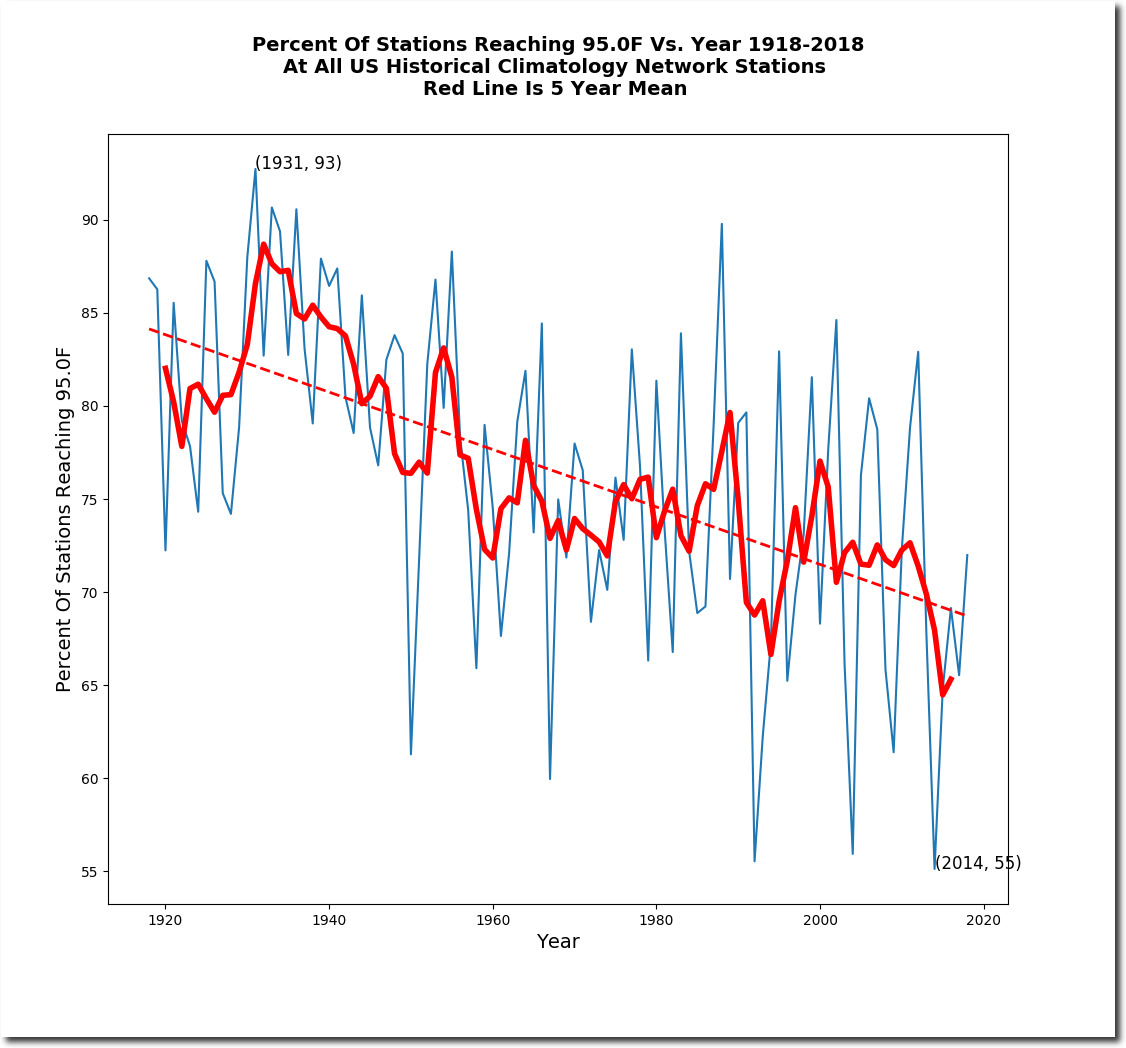
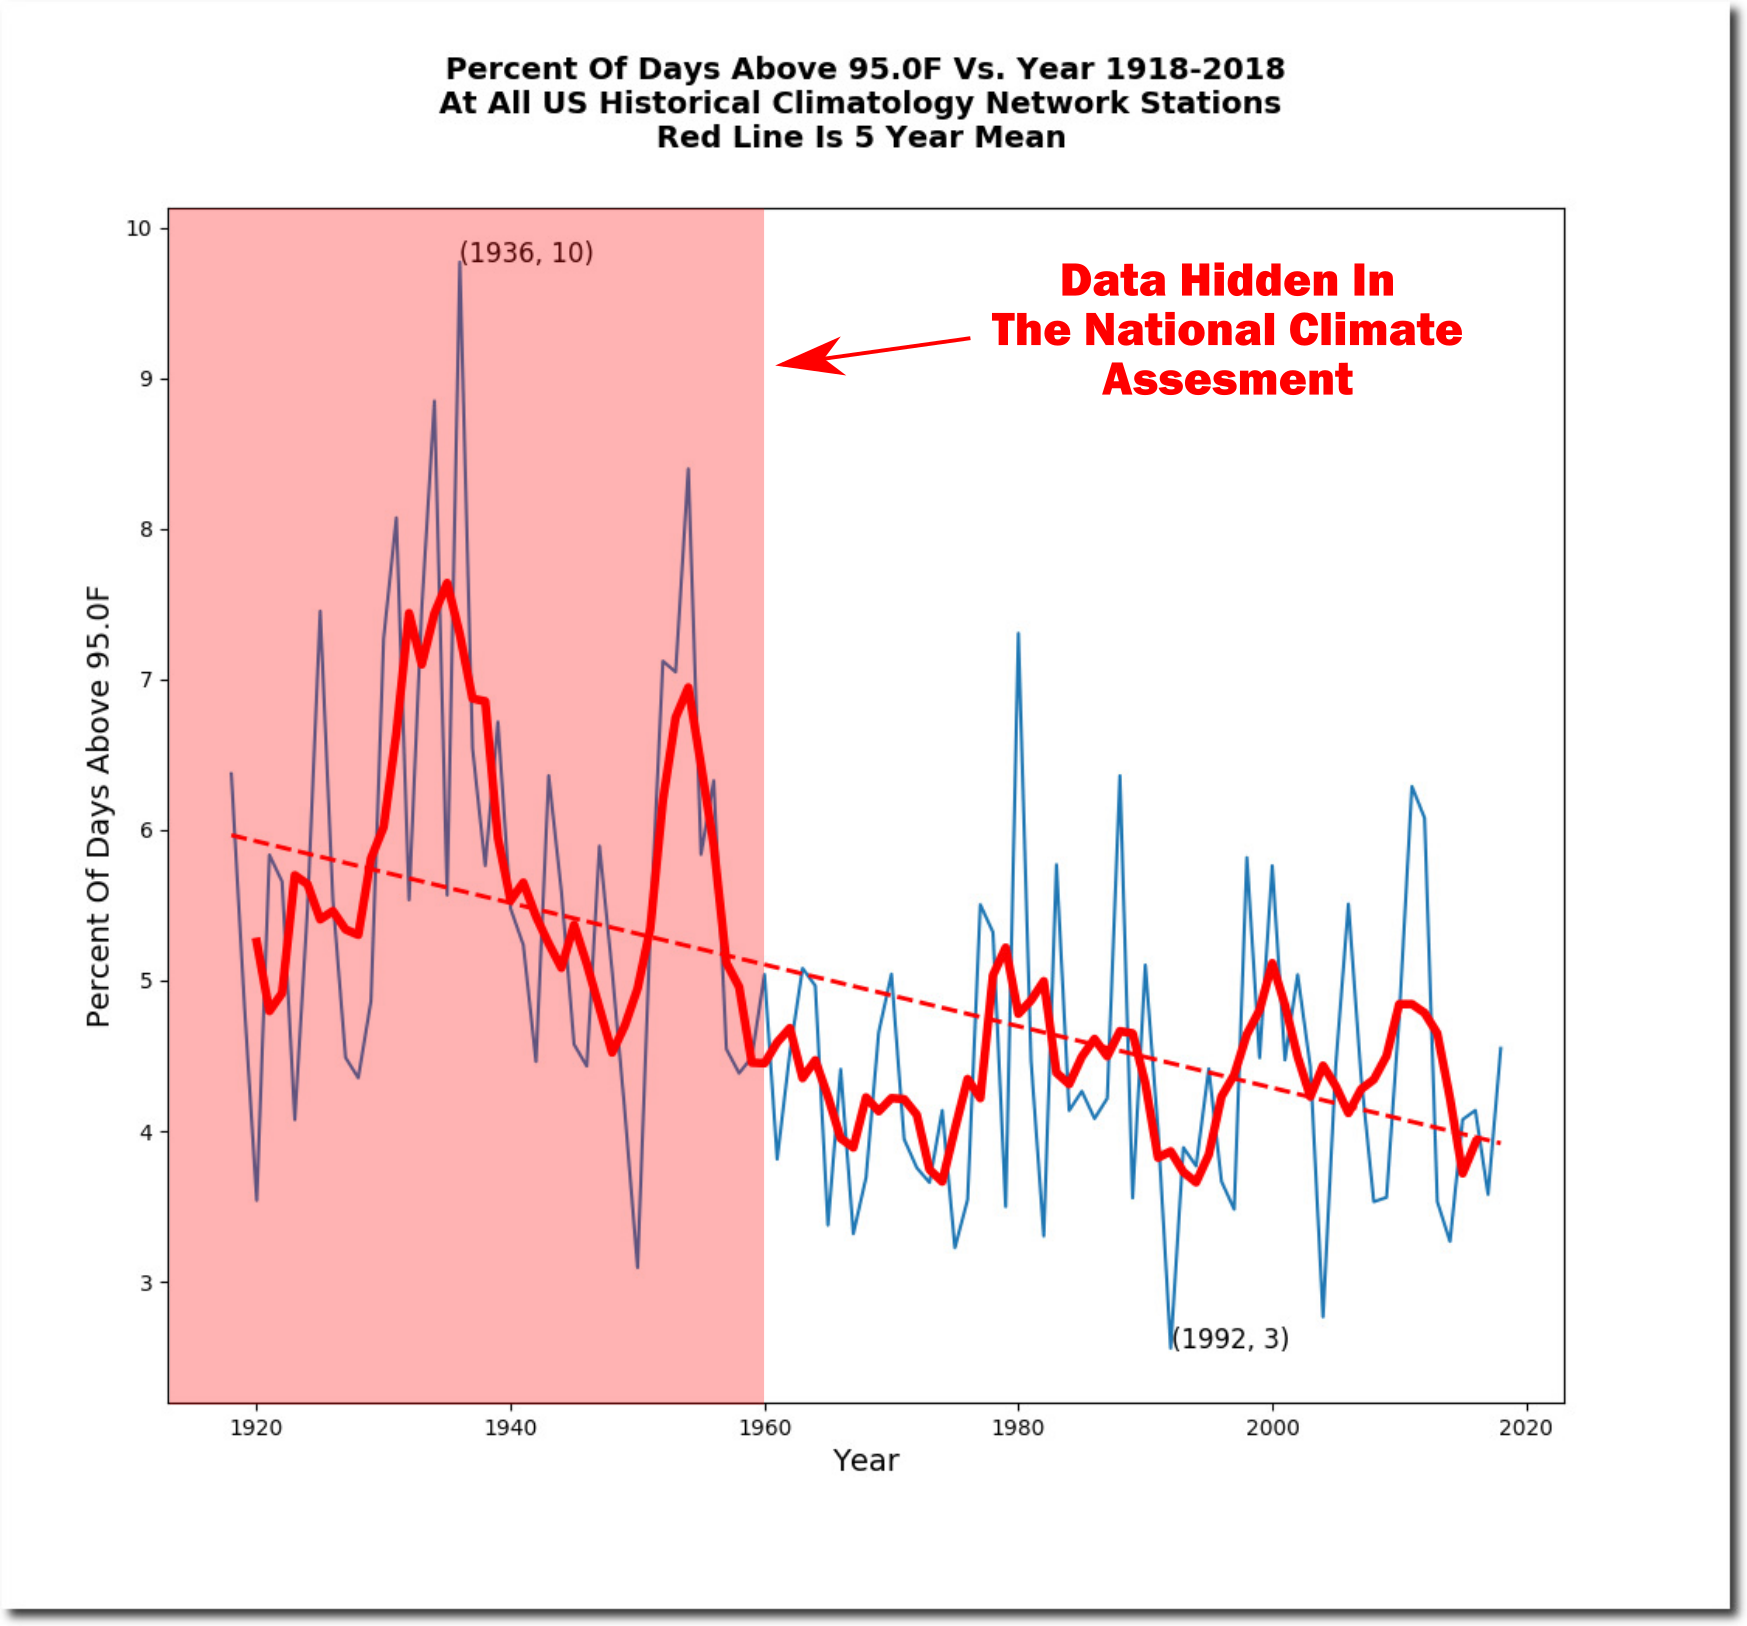
The frequency of hot days has plummeted in the US over the past century, down nearly 50% since the 1930’s.
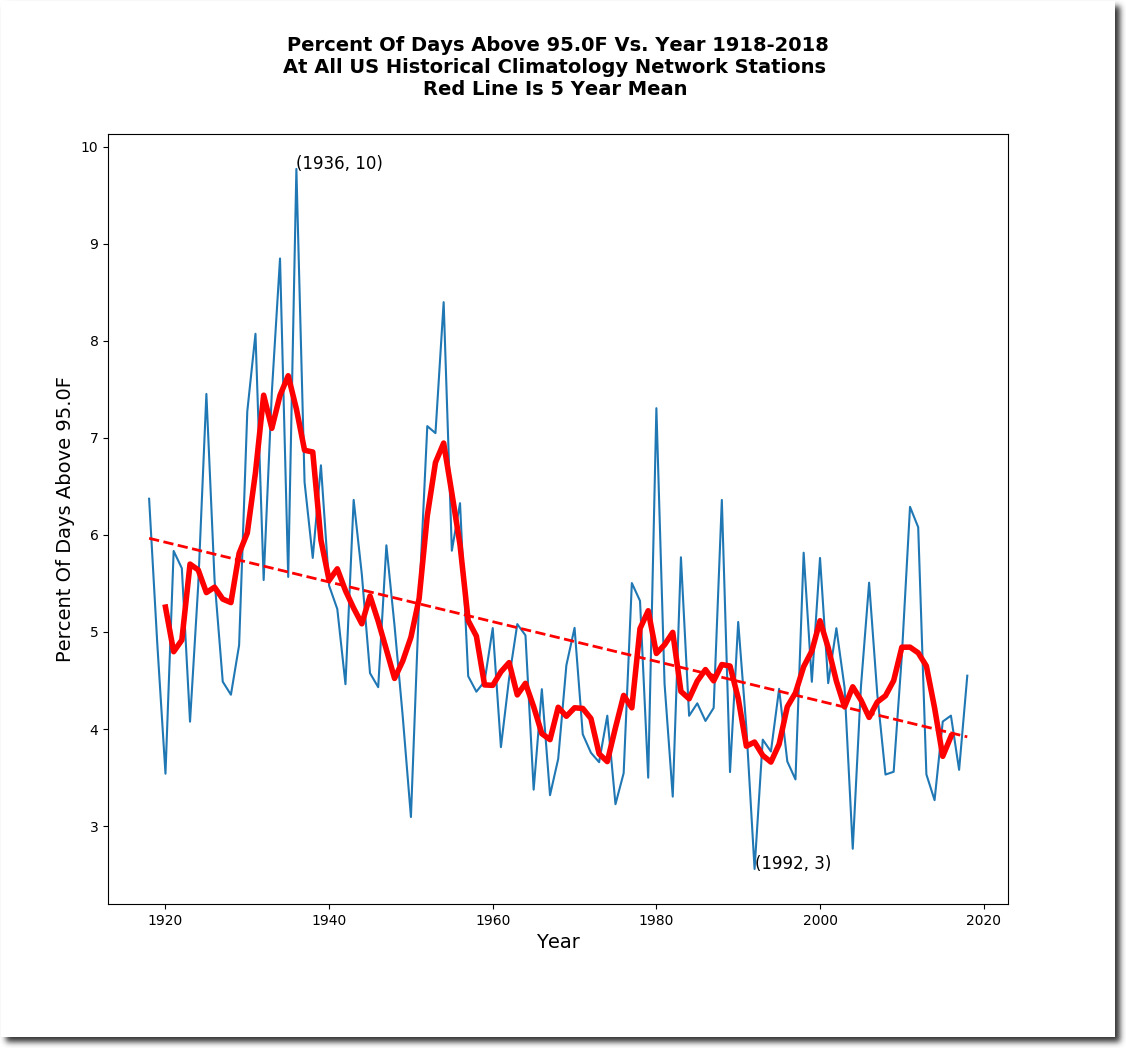
The percent of the US reaching 95 degrees sometime during the year has plummeted, with recent years being the lowest on record.
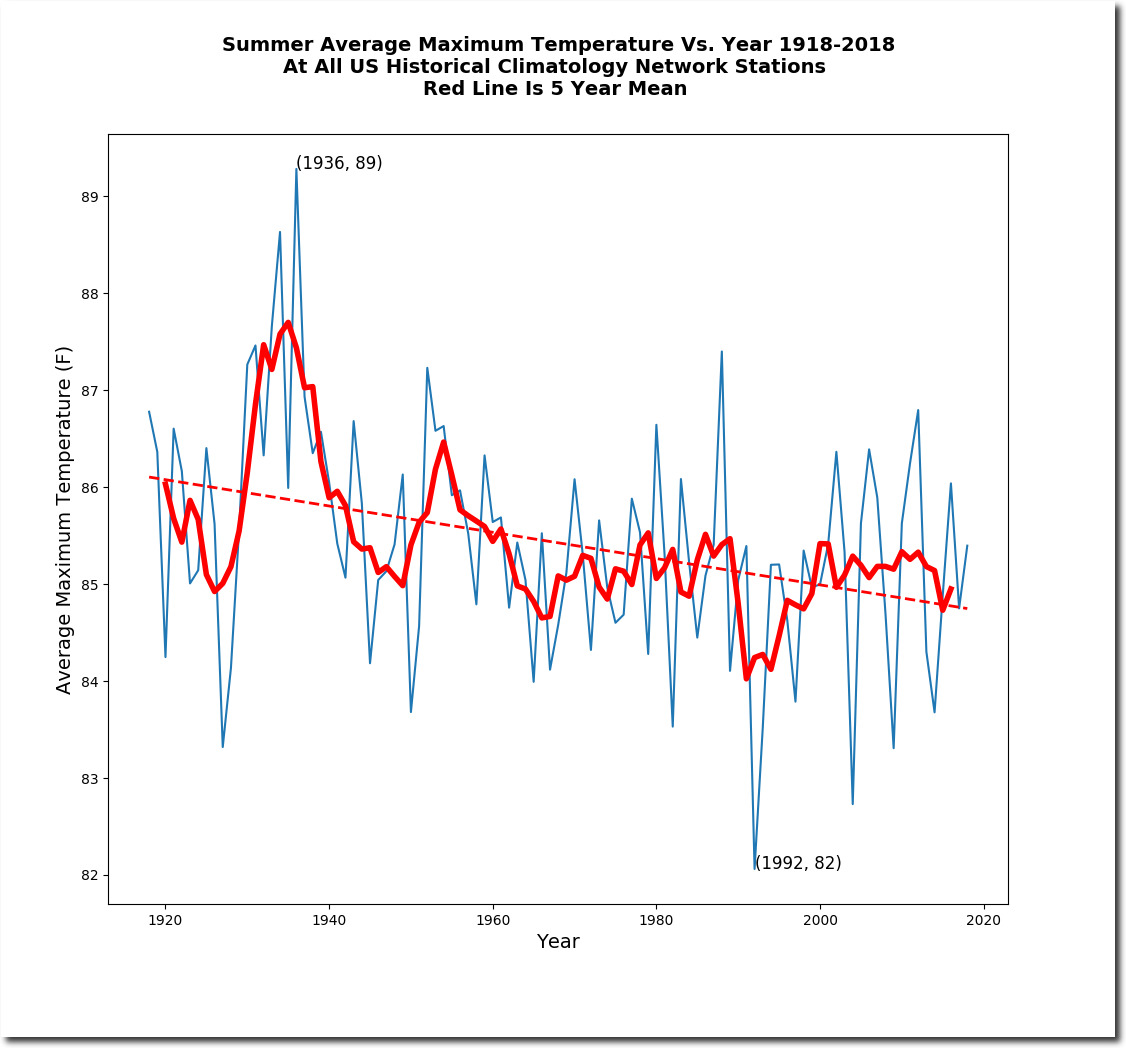
The average summer maximum temperature has plummeted over the past century.
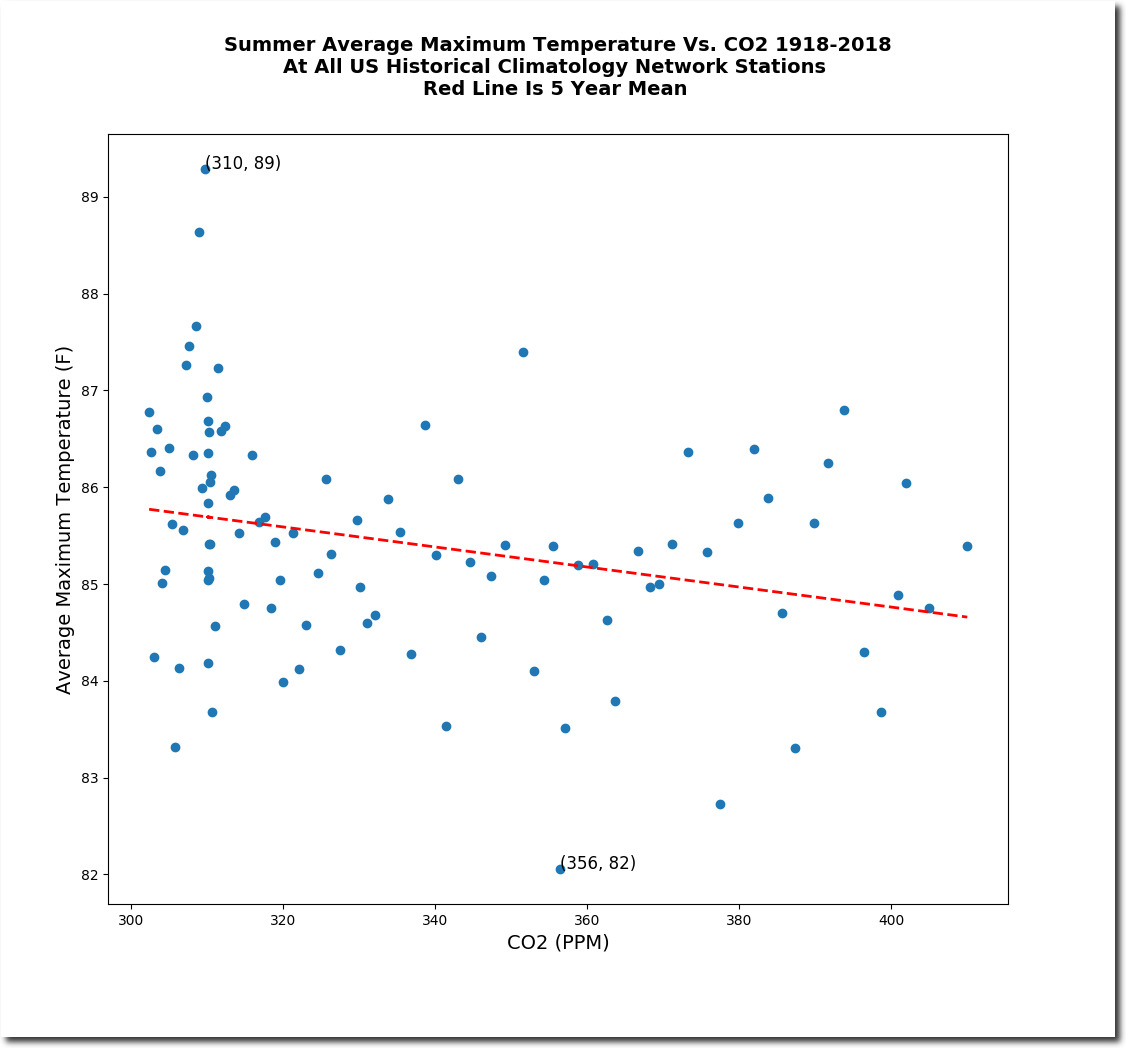
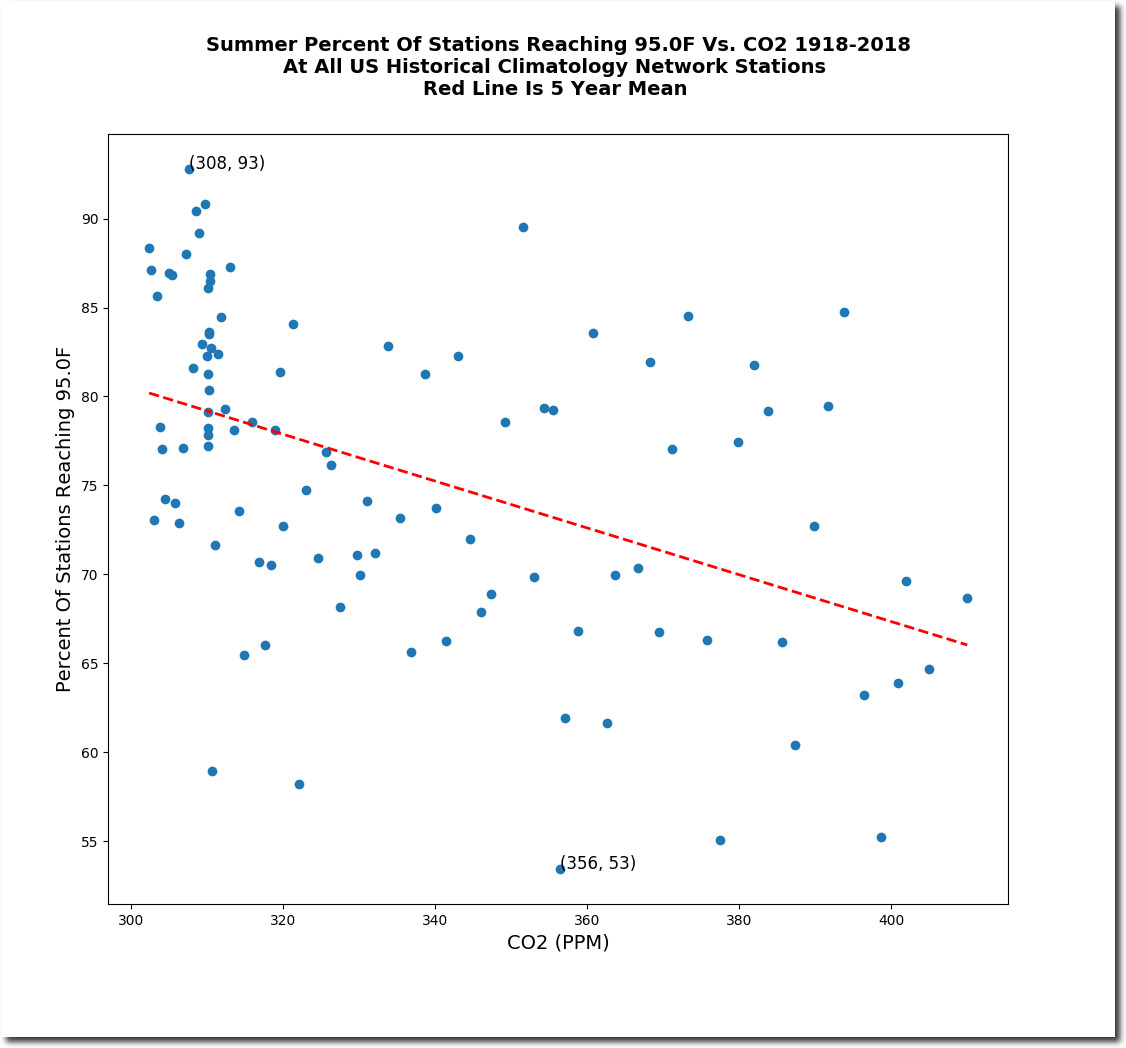
As atmospheric CO2 has increased, US summer temperatures have declined.
As atmospheric CO2 has increased, the frequency of hot days in the US has declined.
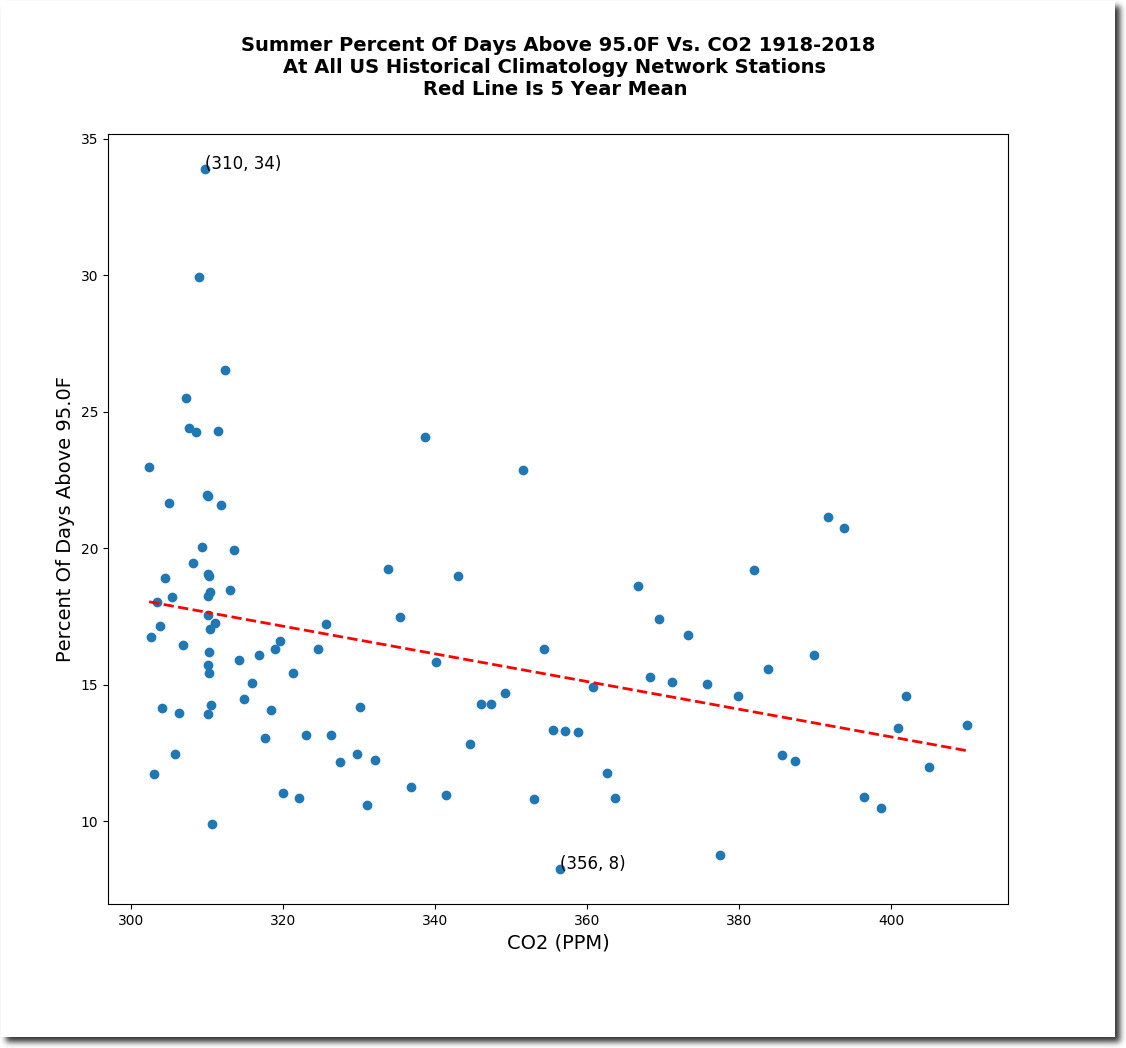
As atmospheric CO2 has increased, the percentage of the US reaching 95 degrees has declined.
Their fraud is centered around hiding data prior to 1960.
Not hard to see why they are doing this.
They blame the hot weather prior to 1960 on farmers in the Oklahoma Panhandle, and use that as an excuse to hide it.
Over timescales shorter than a decade, the 1930s Dust Bowl remains the peak period for extreme heat in the United States for a variety of reasons, including exceptionally dry springs coupled with poor land management practices during that era.
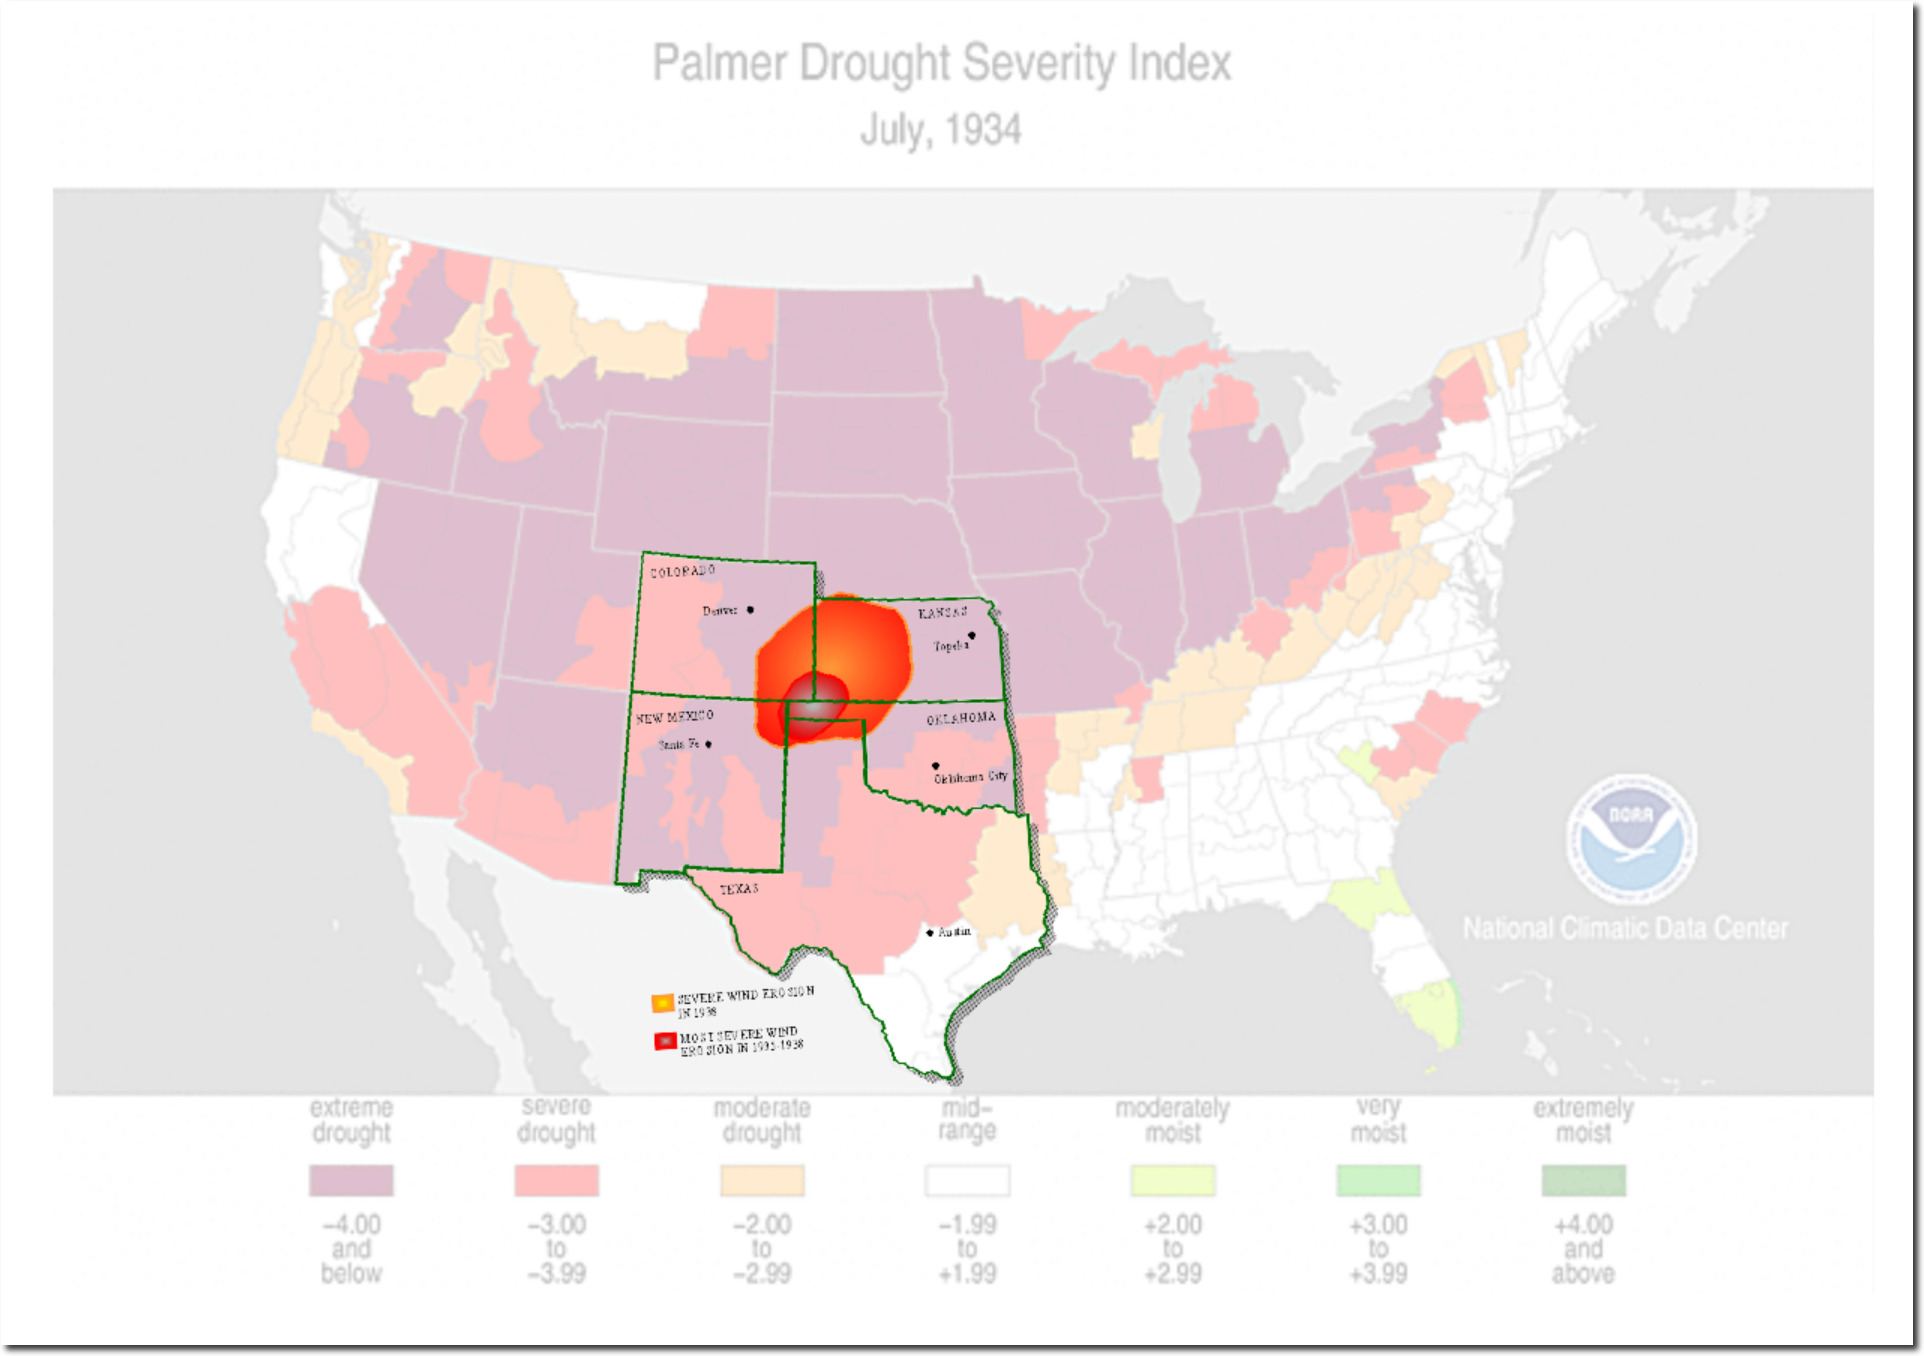
To get a feel of how dishonest this is, compare the area of the Dust Bowl to the area of the 1934 drought.
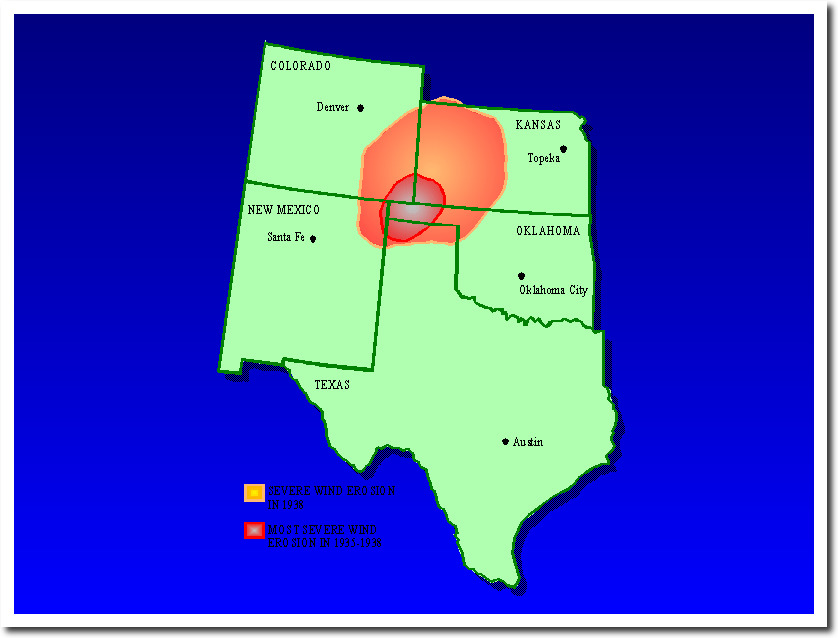
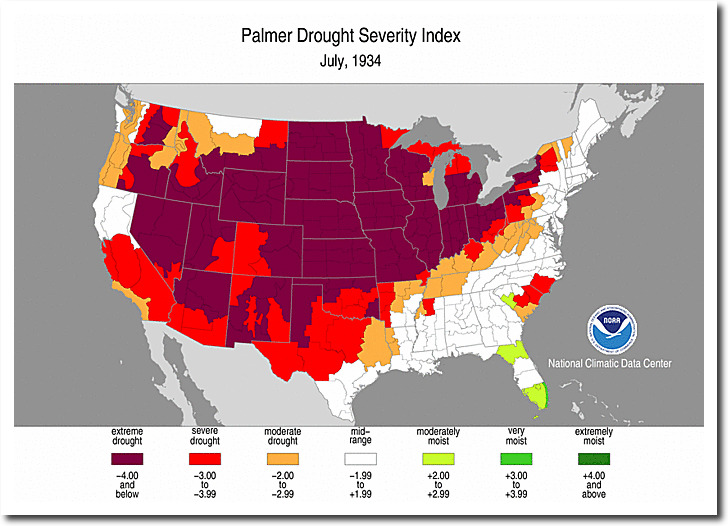
I overlaid the Dust Bowl region on the drought map, to show how dishonest their attempt to blame farmers is.
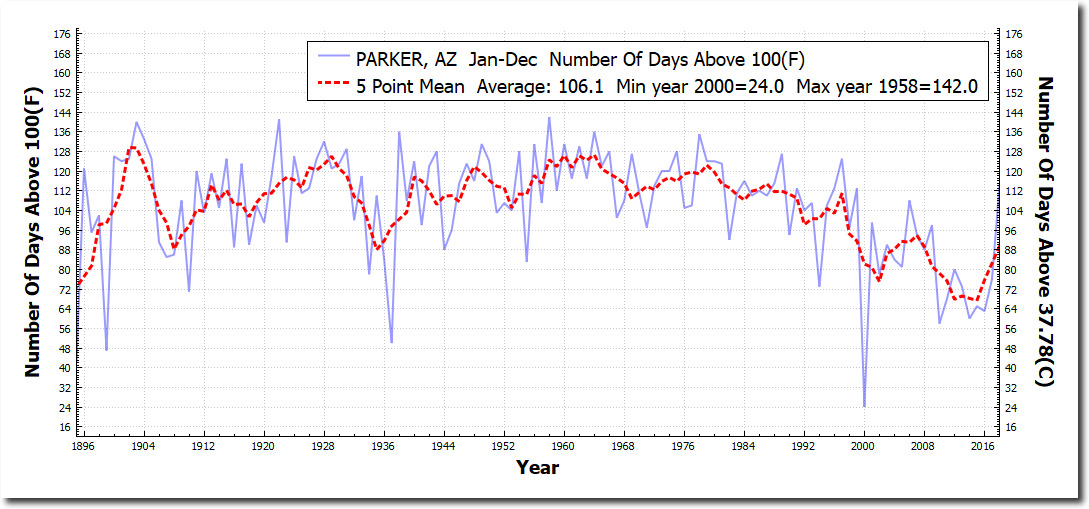
Then they claim that the frequency of 100 degree days is increasing in Arizona due to climate change.
In the bleakest scenario of unchecked climate change, Phoenix could have as many as 150 days per year above 100 degrees Fahrenheit by the end of the century
This is another trivial to disprove lie. Outside of the urban heat island of Phoenix, the frequency of 100 degree days in Arizona is plummeting.
I sat with Hayhoe and Mann at the opening of Naomi Oreske’s propaganda movie in 2015, Merchants of Doubt. Katharine says she won’t debate me and has me blocked on Twitter -because I am too sweet and agreeable.
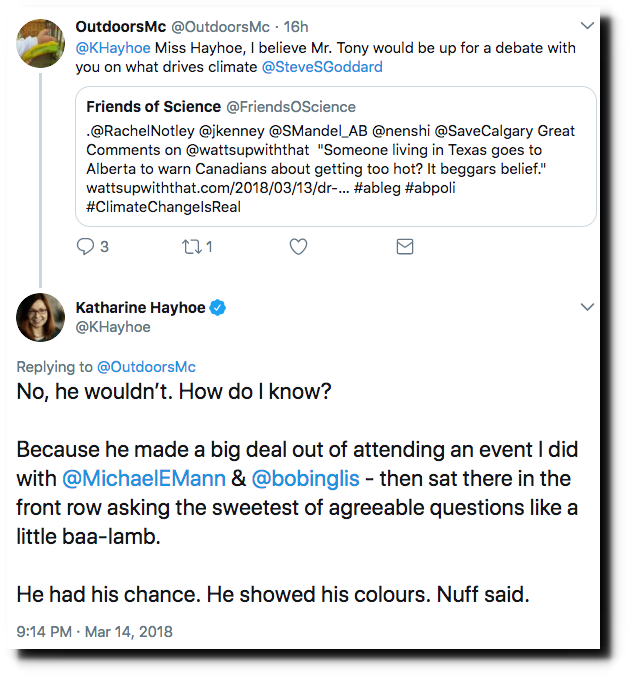
Of course the real reason she won’t debate me is because she knows that I would expose her as a world class liar and fraud.
“We will know our disinformation program is complete, when everything the American public believes is false”
– William Casey CIA Director 1981
They are doing an excellent job.
Leftists now believe that people like Clapper, Brennan and Mueller are their friends, believe that a harmless essential trace gas is the biggest threat in history, believe that bird choppers are good for wildlife, believe that low cost reliable energy threatens their future, and believe that hydroelectric power is green.

And this is just scratching the surface of their carefully manufactured insanity.
Ninety-seven percent of birds sitting on cactus worry about carbon pollution at least zero percent of the time.


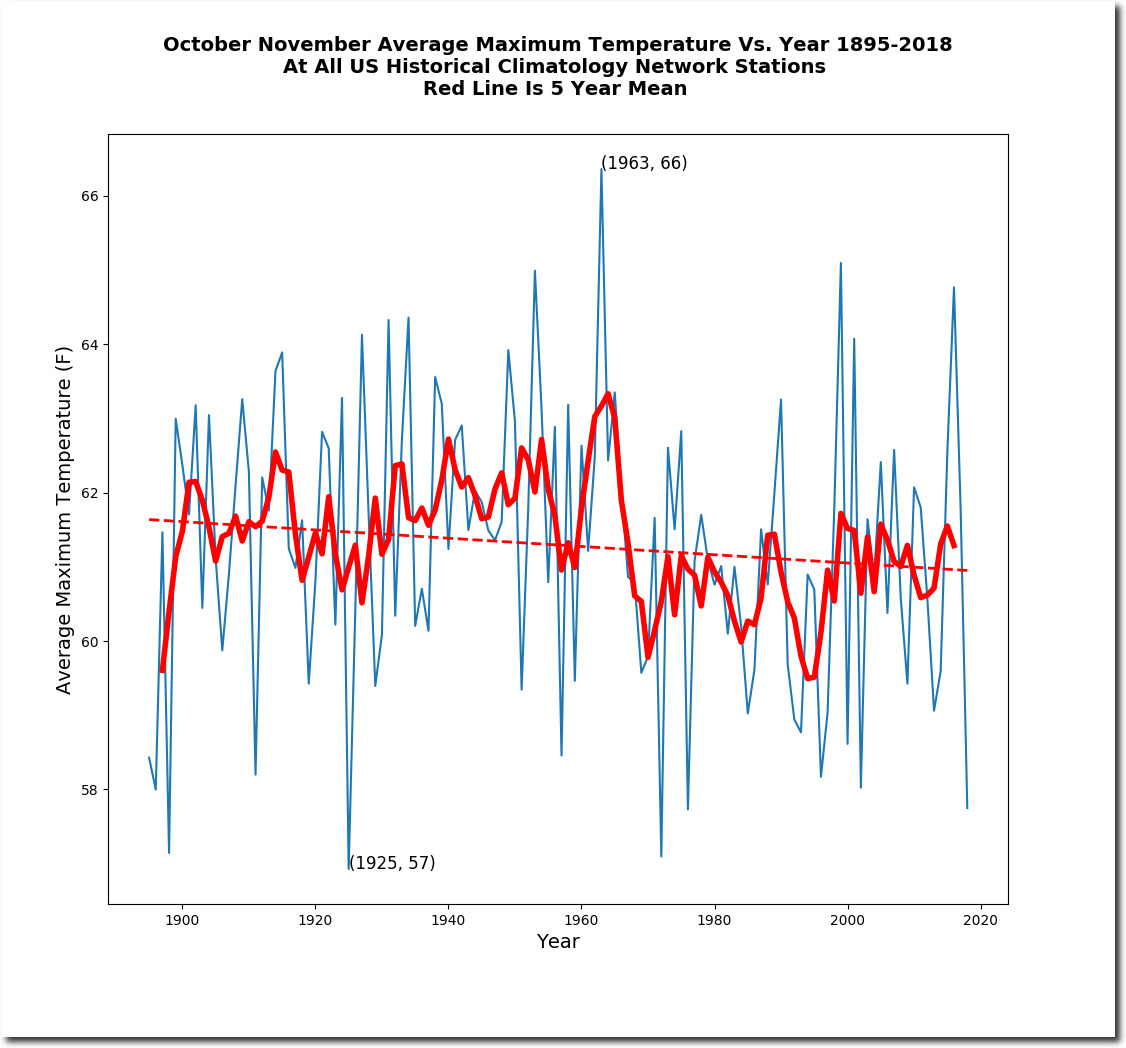
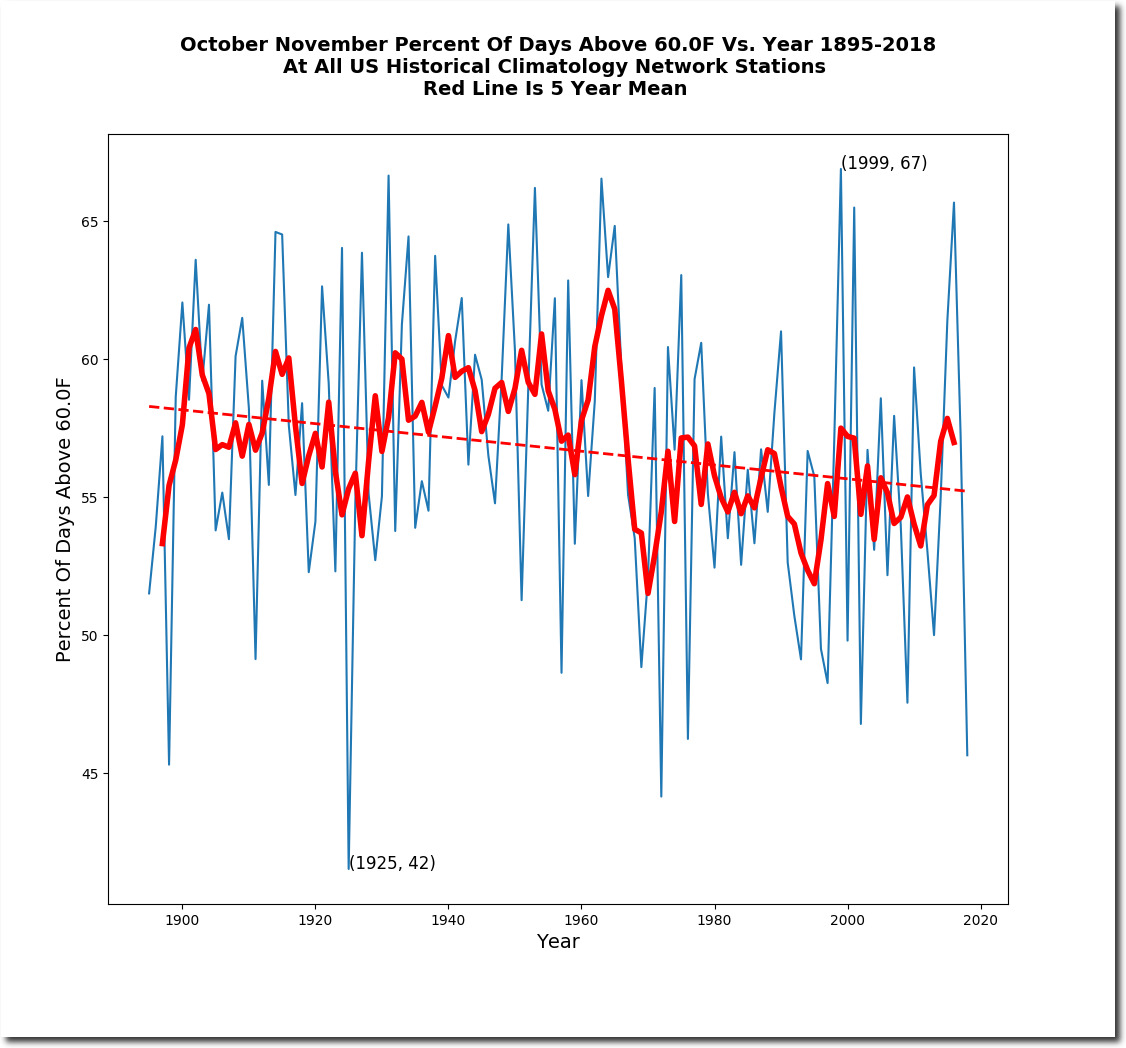
October/November afternoon temperatures in the US have been declining since the 19th century. There was a very sharp drop off in the late 1960’s, and temperatures never recovered. This October/November was fifth coldest on record.
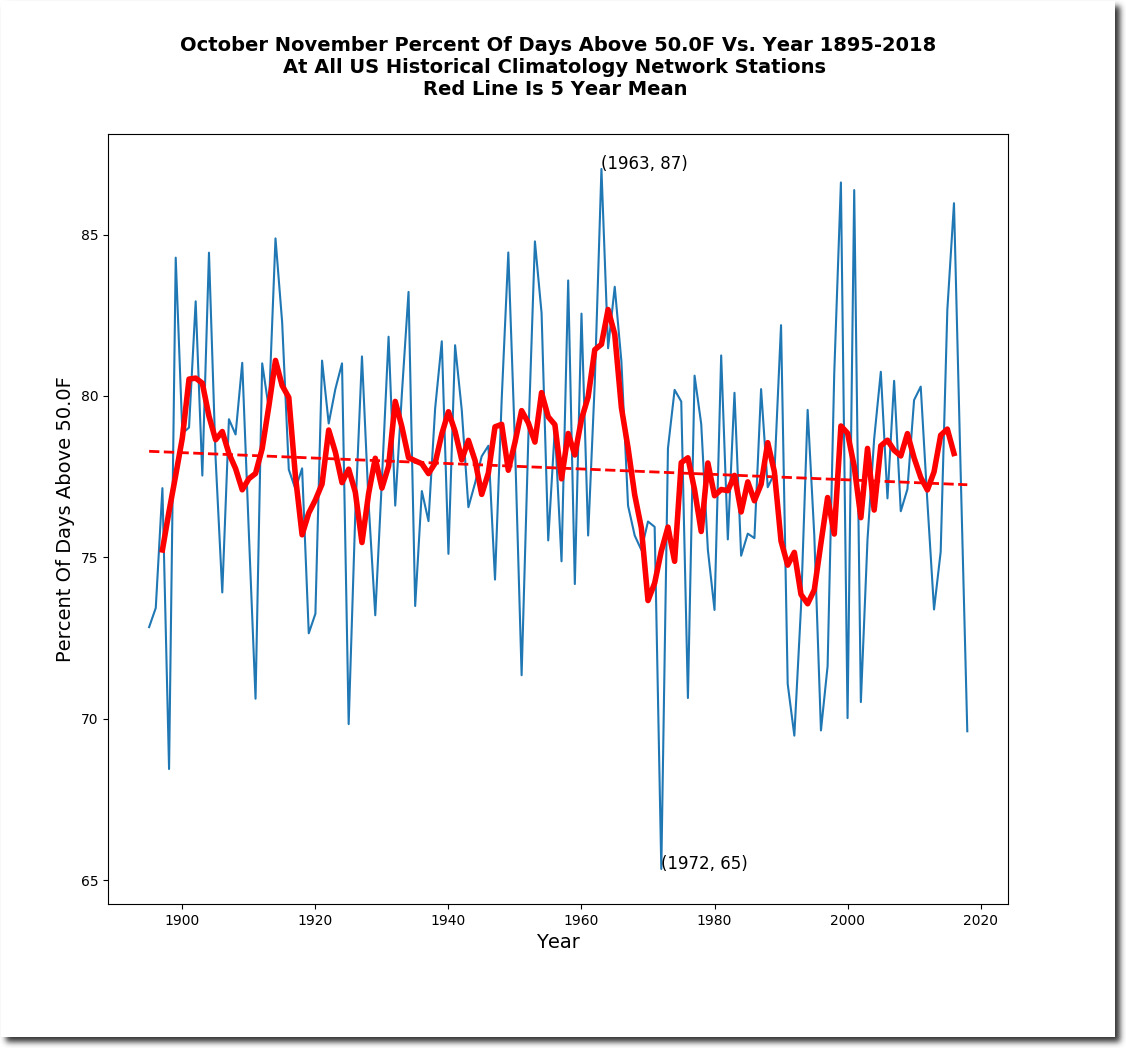
The percentage of days above 50F was fourth lowest on record.
The percentage of days above 55F was fourth lowest on record.

The percentage of days above 60F was fourth lowest on record.
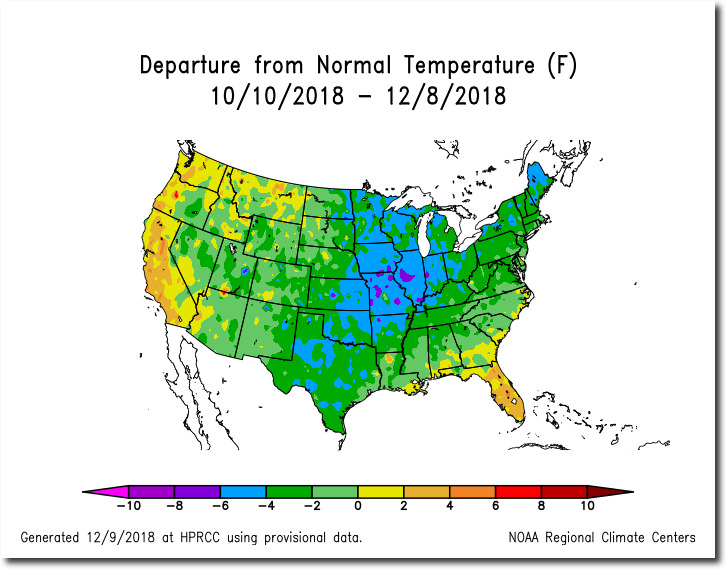
The cold has continued into December, with almost the entire US below normal temperatures.
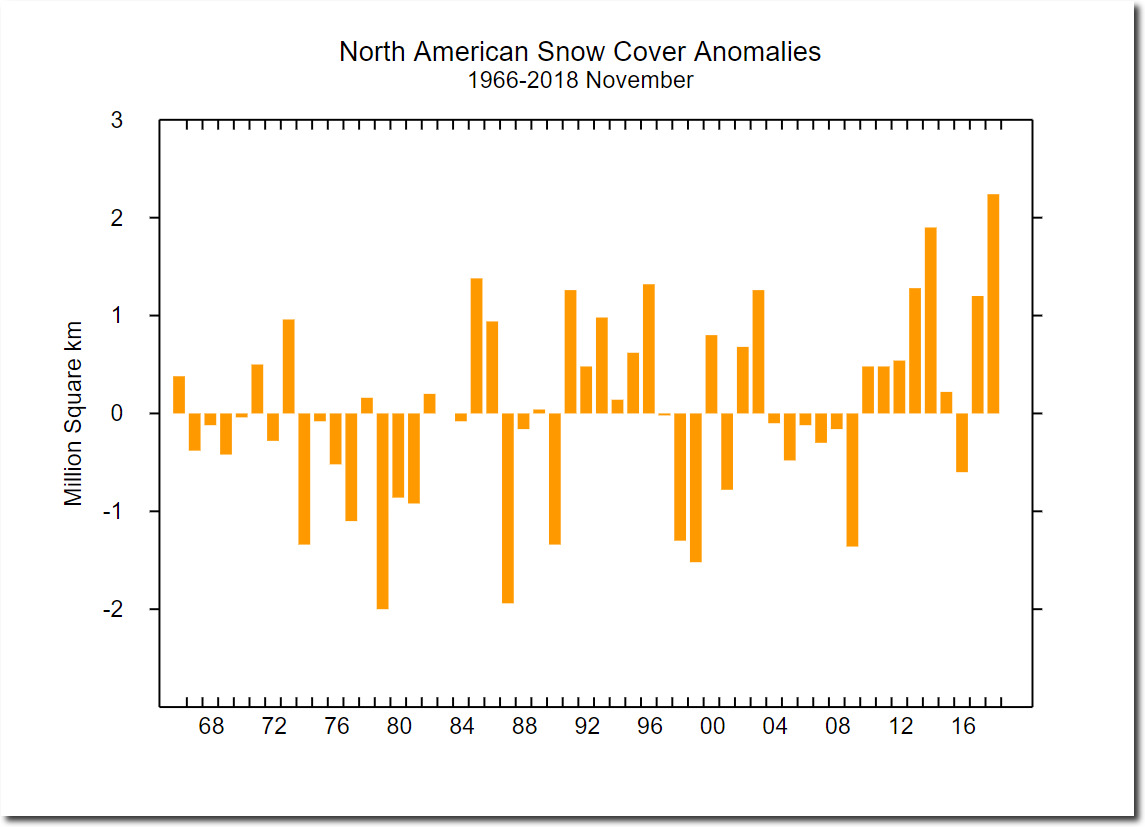
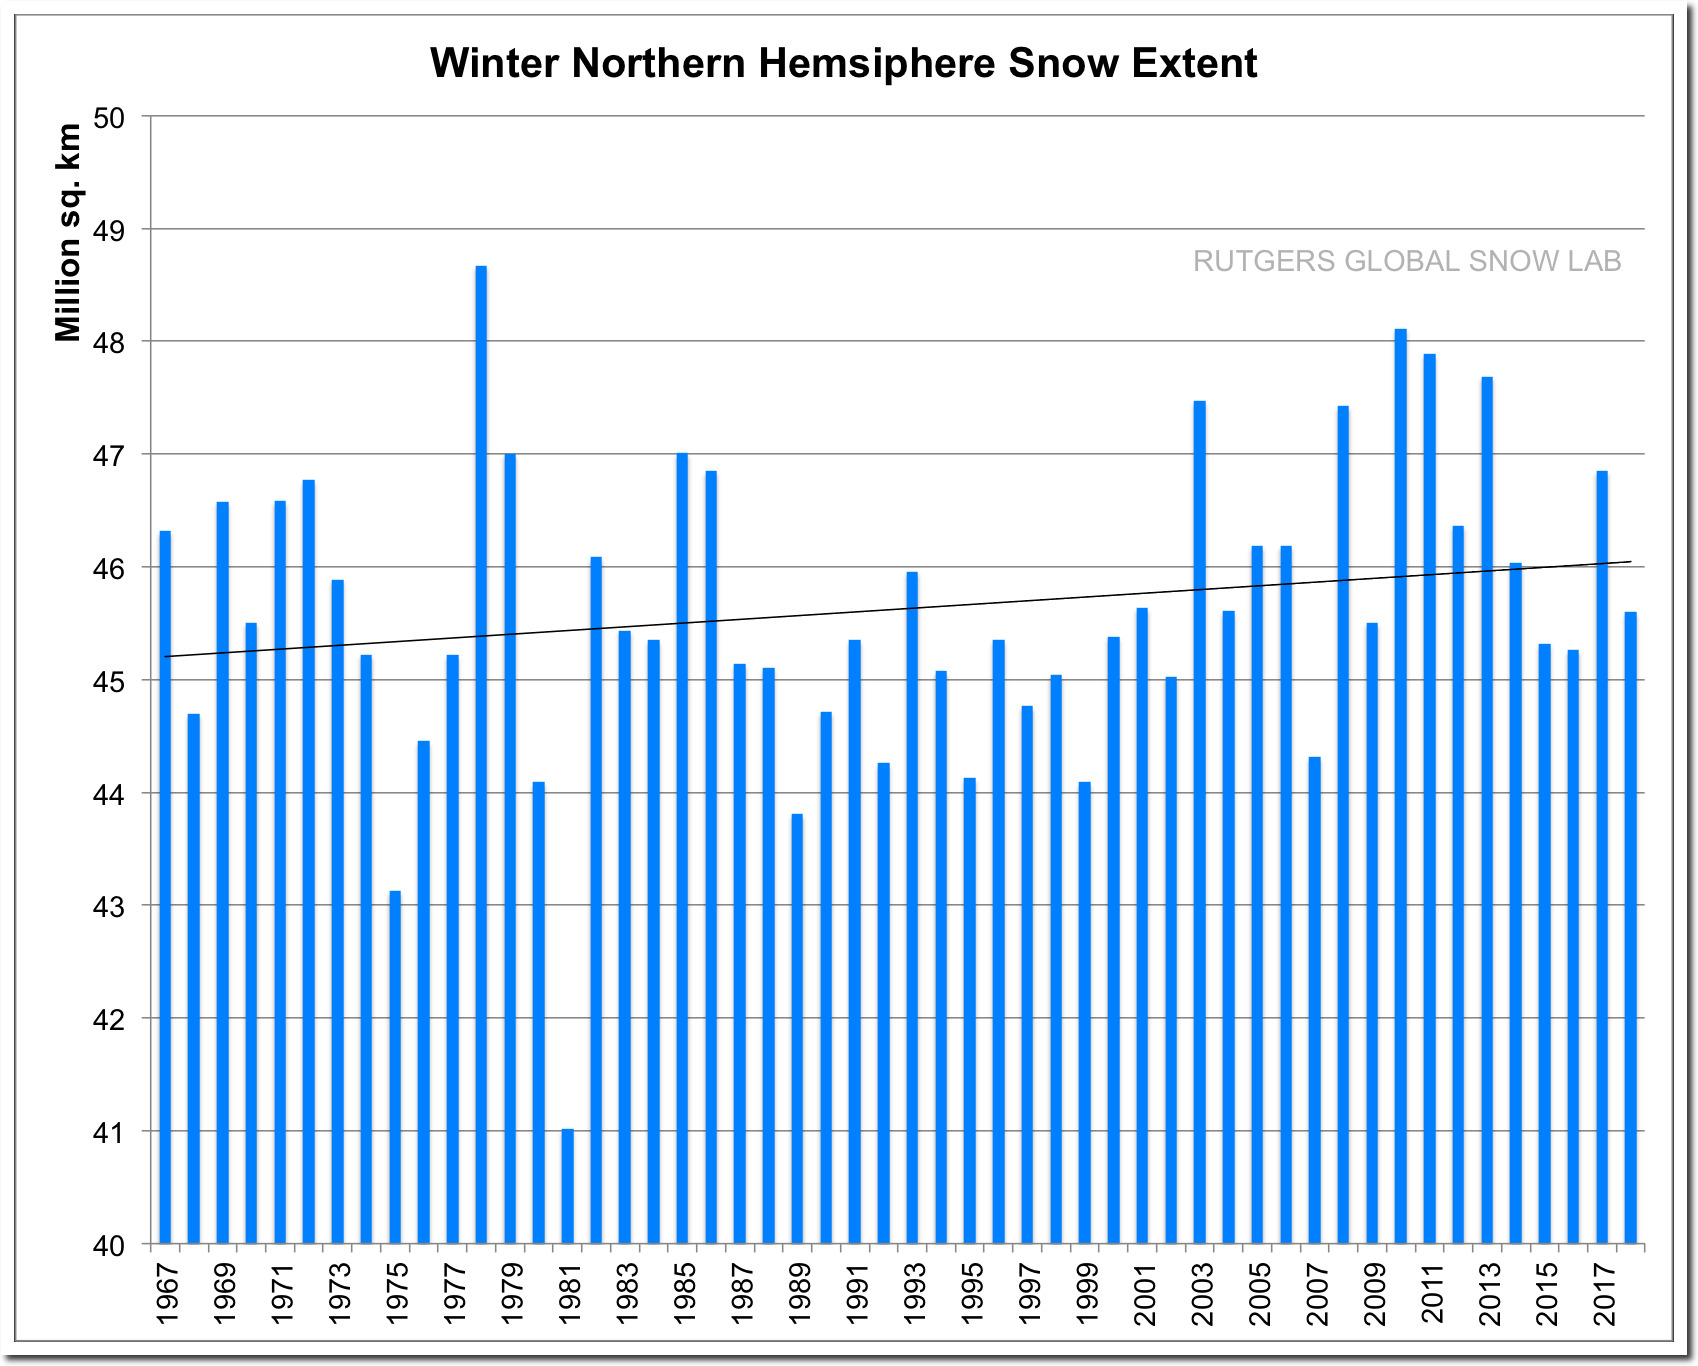
The cold has been accompanied by increased snow extent, with last month being the highest November snow extent on record.
Rutgers University Climate Lab :: Global Snow Lab
Across the northern hemisphere, autumn snow extent has massively increased over the last 60 years – with this year being sixth highest on record.

Rutgers University Climate Lab :: Global Snow Lab
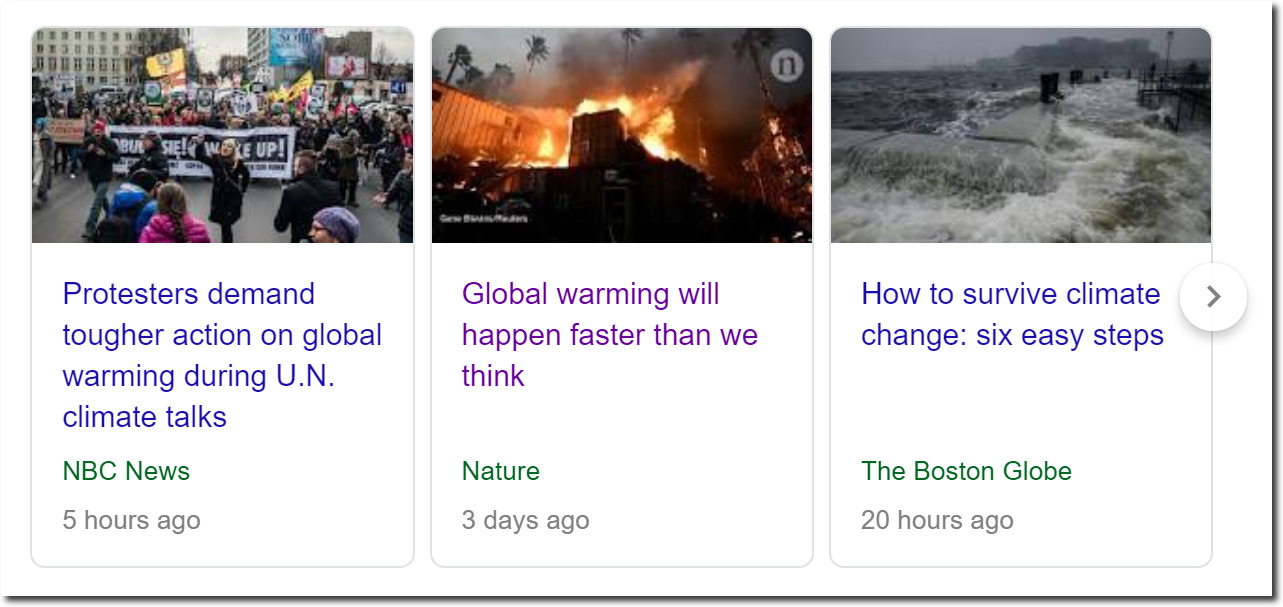
Meanwhile, climate experts say global warming will happen “faster than we think.”
Experts also say global warming killed us 18 years ago.
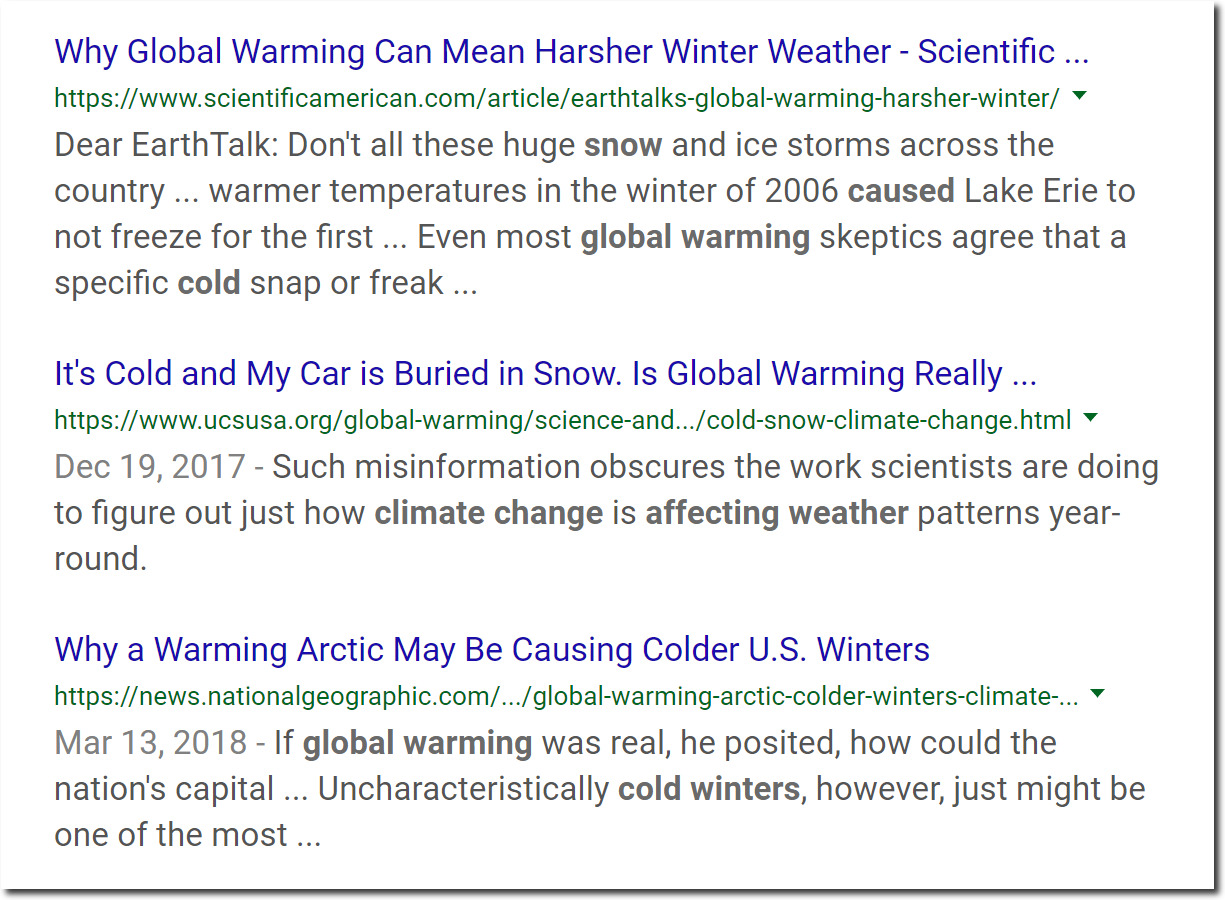
They tell us that snow is a thing of the past, and that the cold and snow is caused by global warming.
Snowfalls are now just a thing of the past – Environment – The Independent
Experts say Britain will be a Siberian climate by 2020.
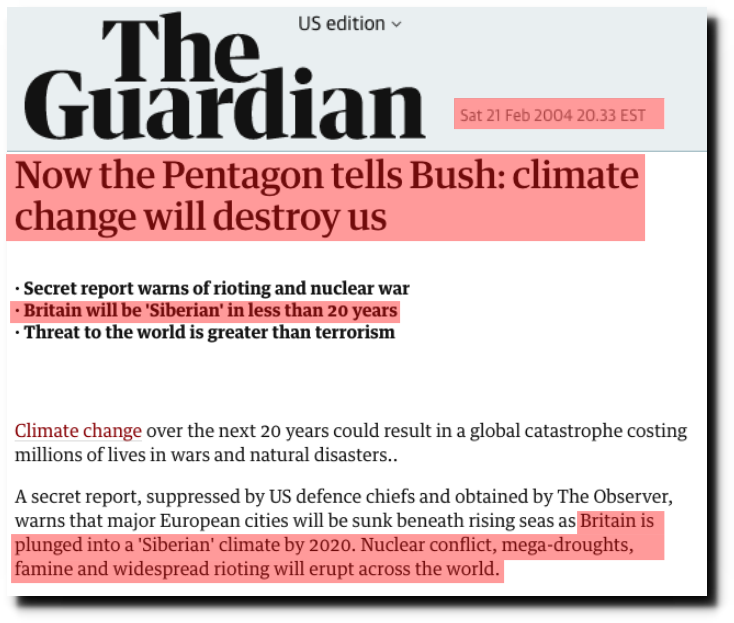
Pentagon tells Bush: climate change will destroy us | Environment | The Guardian
They say the Arctic will be ice-free no later than this year.

The Argus-Press – Google News Archive Search
And that a new ice age will begin as early as one year from now.
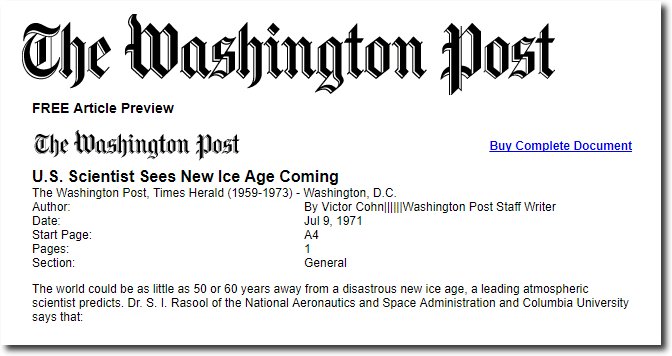
A Chilling Possibility | Science Mission Directorate
Putting this in layman’s terms, a one part per ten thousand increase in CO2 over the past century will cause the climate to become very hot, cold, snow free, snow covered, ice free, ice covered and trigger a new ice age and a Siberian climate – all as we are burning up. And of course, you are a racist if you disagree with any of these conclusions.
Two-bit climate fraudster Michael Mann sees himself as Gandhi, saving the world from the axis of evil, and that he belongs in the anals of history.


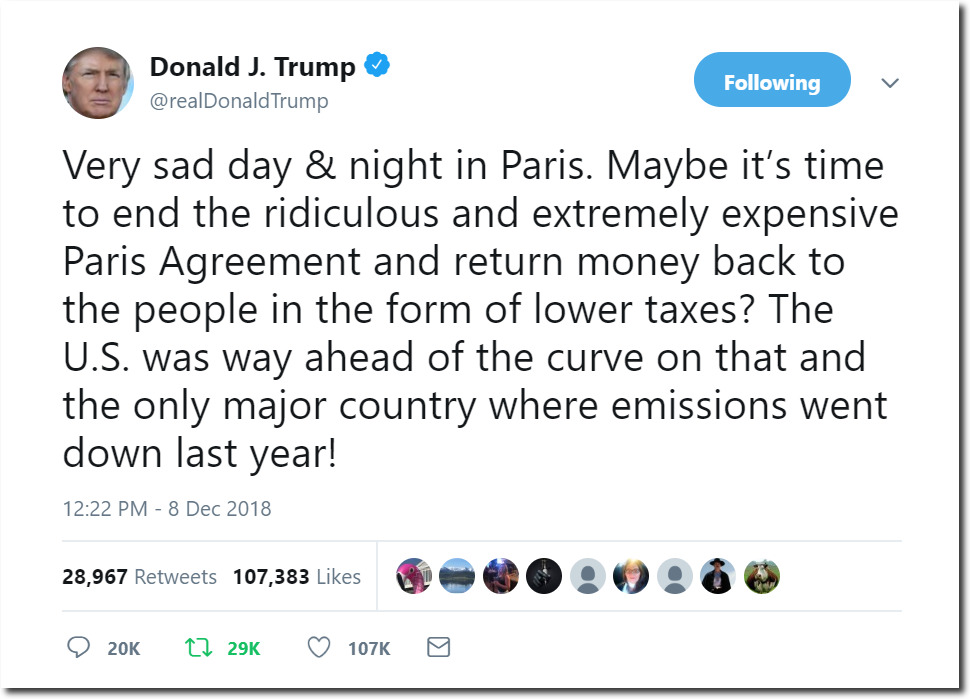
Donald Trump is in the oil business, just as much as Michael Mann is in the science business.
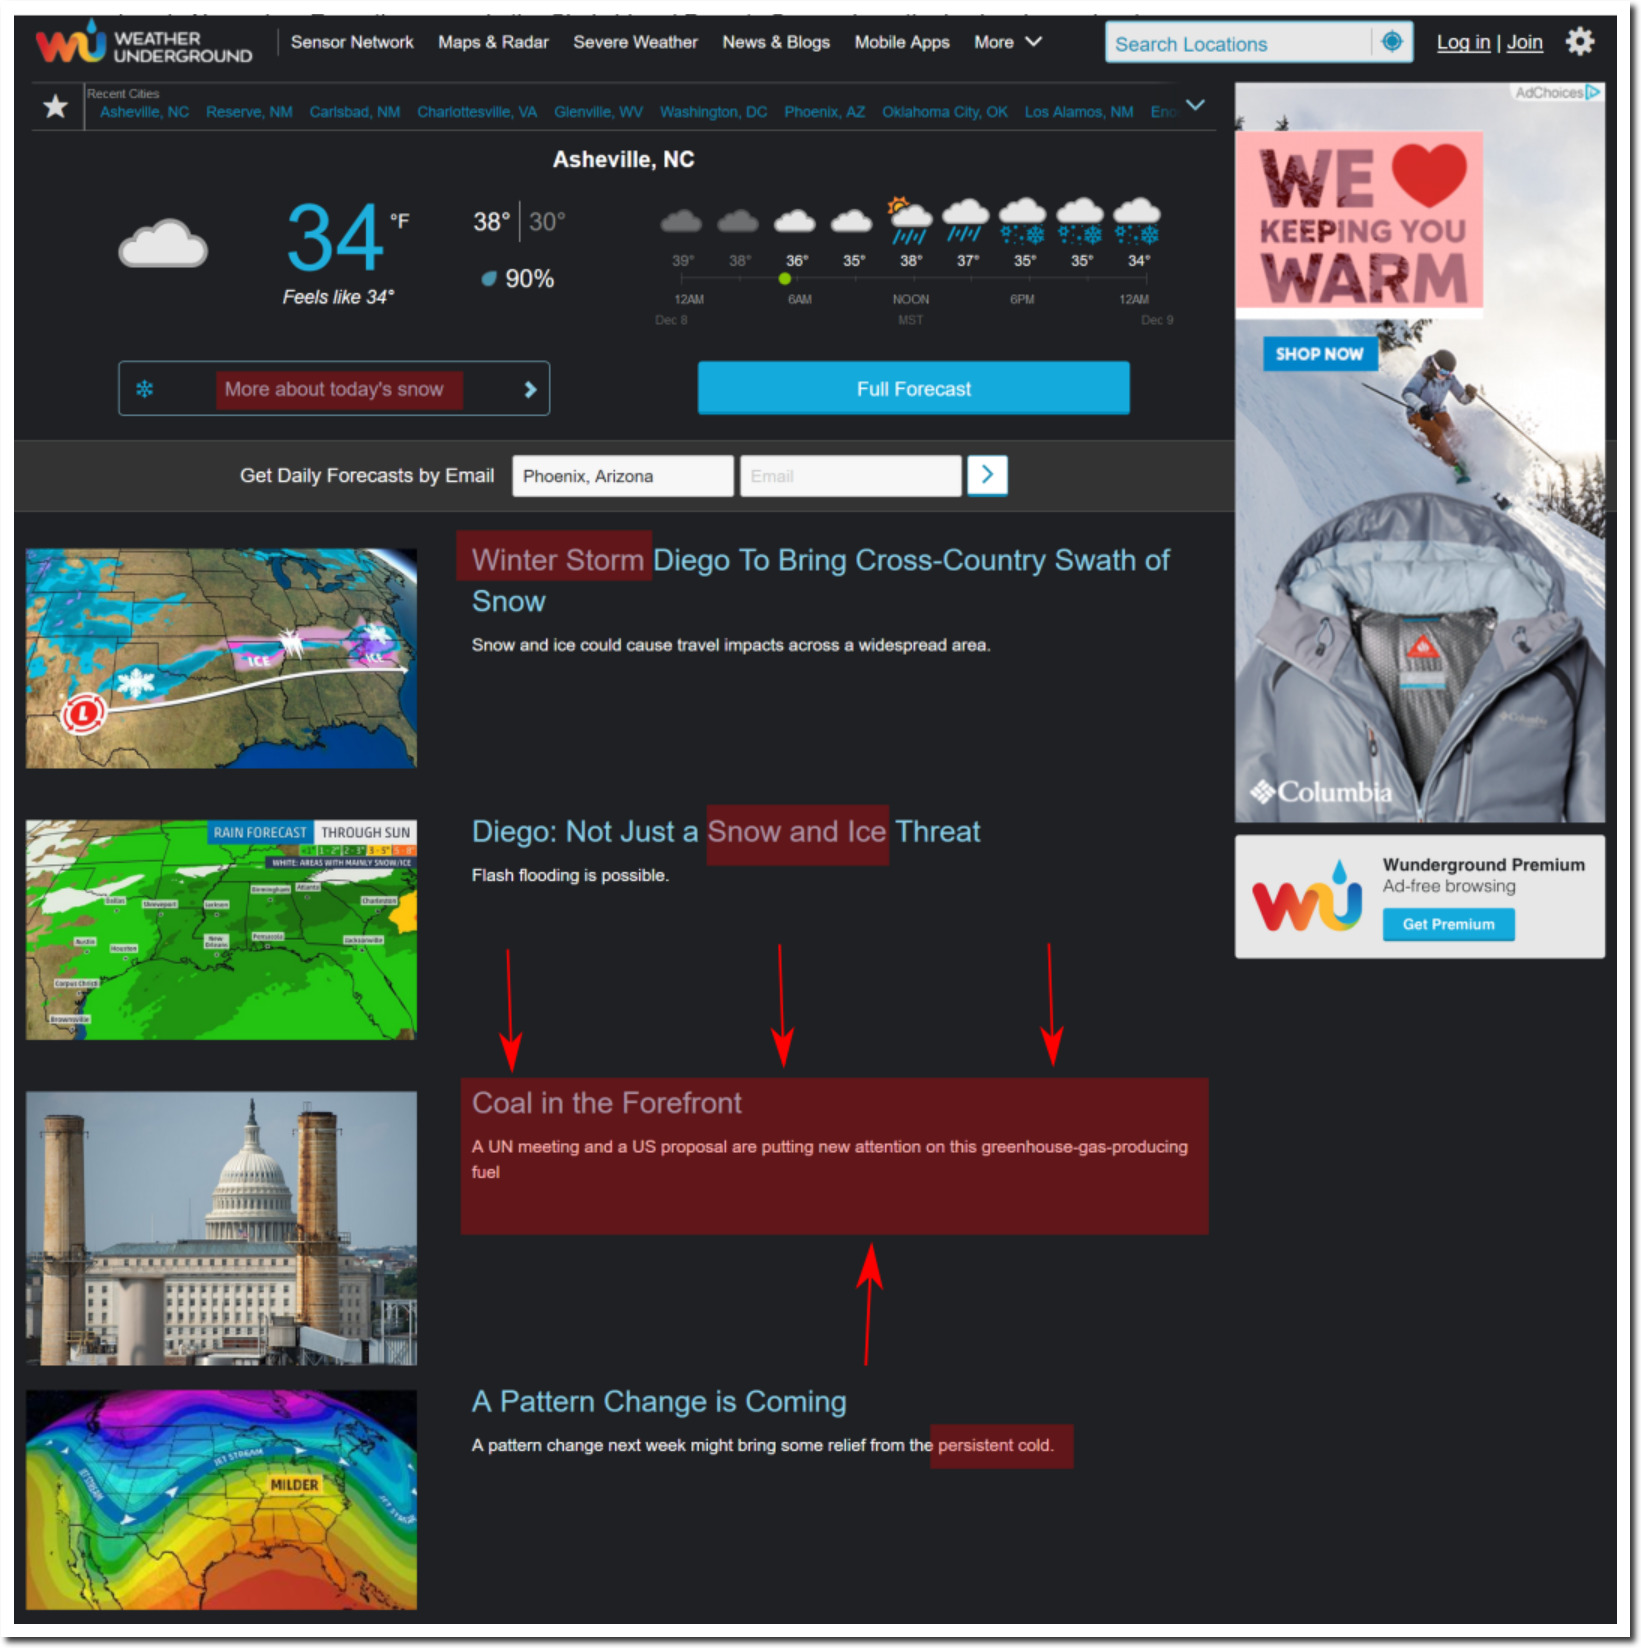
The front page of “Weather Underground” – named after Bill Ayers’ 1960s terrorist organization, which tried to murder US Navy personnel and their wives.
The stories are : snow, winter storm, snow and ice, persistent cold, and of course the mandatory article about global warming and green energy.
Weather Forecast & Reports – Long Range & Local | Weather Underground
Here is the story :

Meanwhile, Britain switches their coal back on to avoid freezing in the dark – due to a 100% chance of green energy failure.
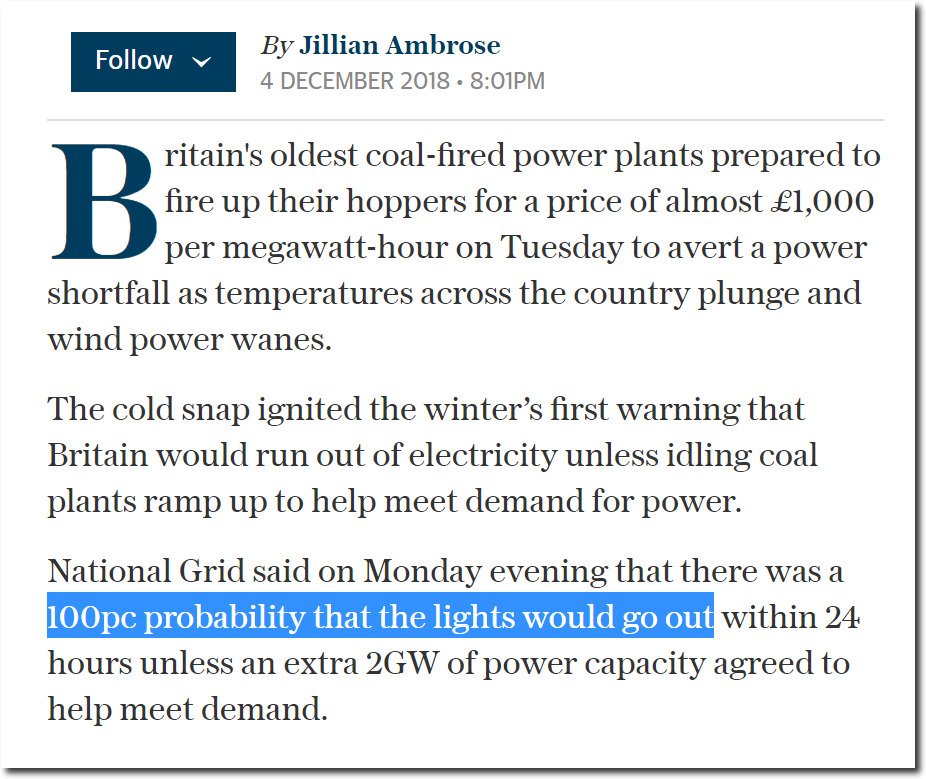
Britain’s oldest coal plants called on to avoid running out of power as cold sets in
h/t Paul Homewood
You really can’t make this stuff up. Climate alarmists, and leftists in general, are completely disconnected from reality. They suffer from a severe form of mental illness, which unfortunately threatens everyone around them too.
No amount of experimentation can ever prove me right. A single experiment can prove me wrong.
- Albert Einstein
Climate models predicted the snow line moving north as a result of increases in greenhouse gases.
The response in snow cover to enhanced greenhouse warming is therefore complicated by projected increases in mid- to high-latitude precipitation, with the response varying by latitude and elevation. Climate models generally display a transition zone, around the present-day ?10°C isotherm, with expected snowfall increases to the north (high latitudes) and decreases to the south (midlatitudes)
If the climate was warming, precipitation falling in the mid-latitudes would fall as rain in places where it used to fall as snow. But the exact opposite is happening – the snow line is moving south.
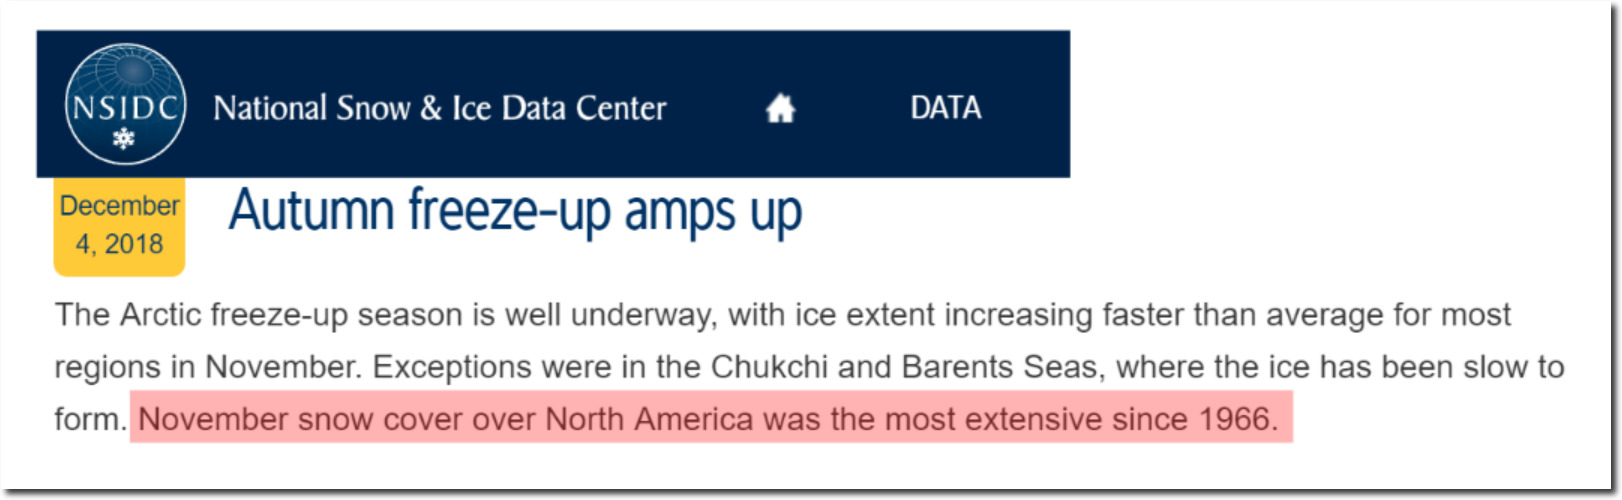
November snow cover over North America was the most extensive since 1966.
Arctic Sea Ice News and Analysis | Sea ice data updated daily with one-day lag
Rutgers University Climate Lab :: Global Snow Lab
Rutgers University Climate Lab :: Global Snow Lab
Climate scientists can tamper with temperature data (and simply make temperature data up) but it is much harder for them to tamper with historical snow data. Climate models don’t work, and they form the basis of climate science. If the climate was warming, the snow line would be moving towards the pole, not away from it. And climate scientists wouldn’t have to cheat.
