The New York Times says satellite images were first used to study sea ice in 1979, and that ice is disappearing due to global warming.
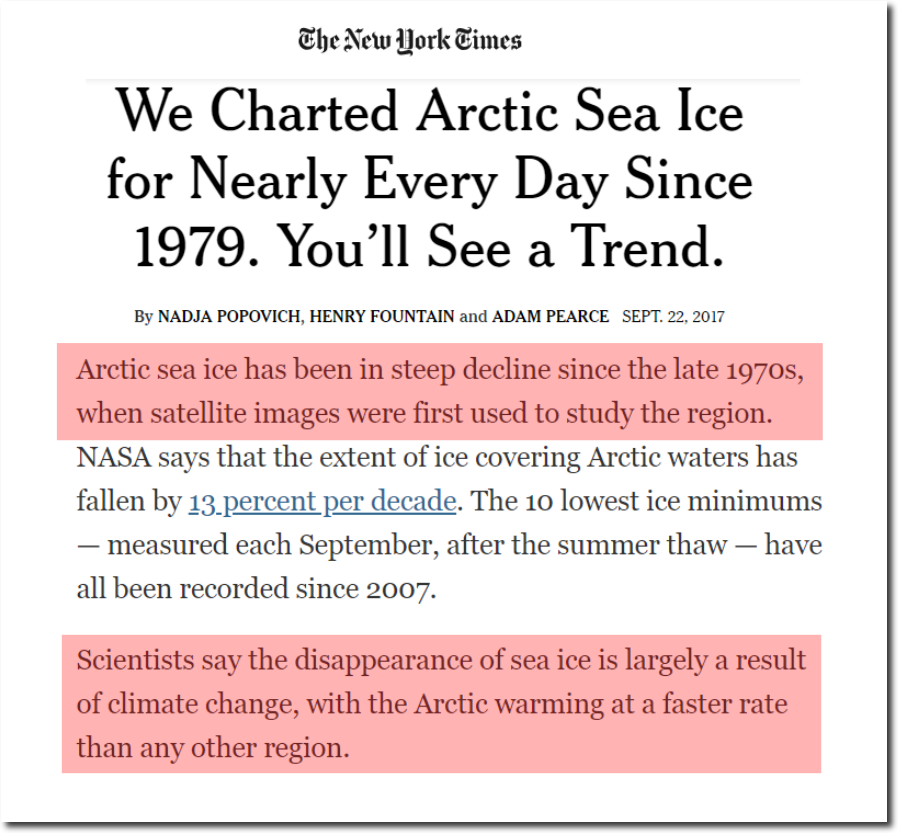
We Charted Arctic Sea Ice for Nearly Every Day Since 1979. You’ll See a Trend. – The New York Times
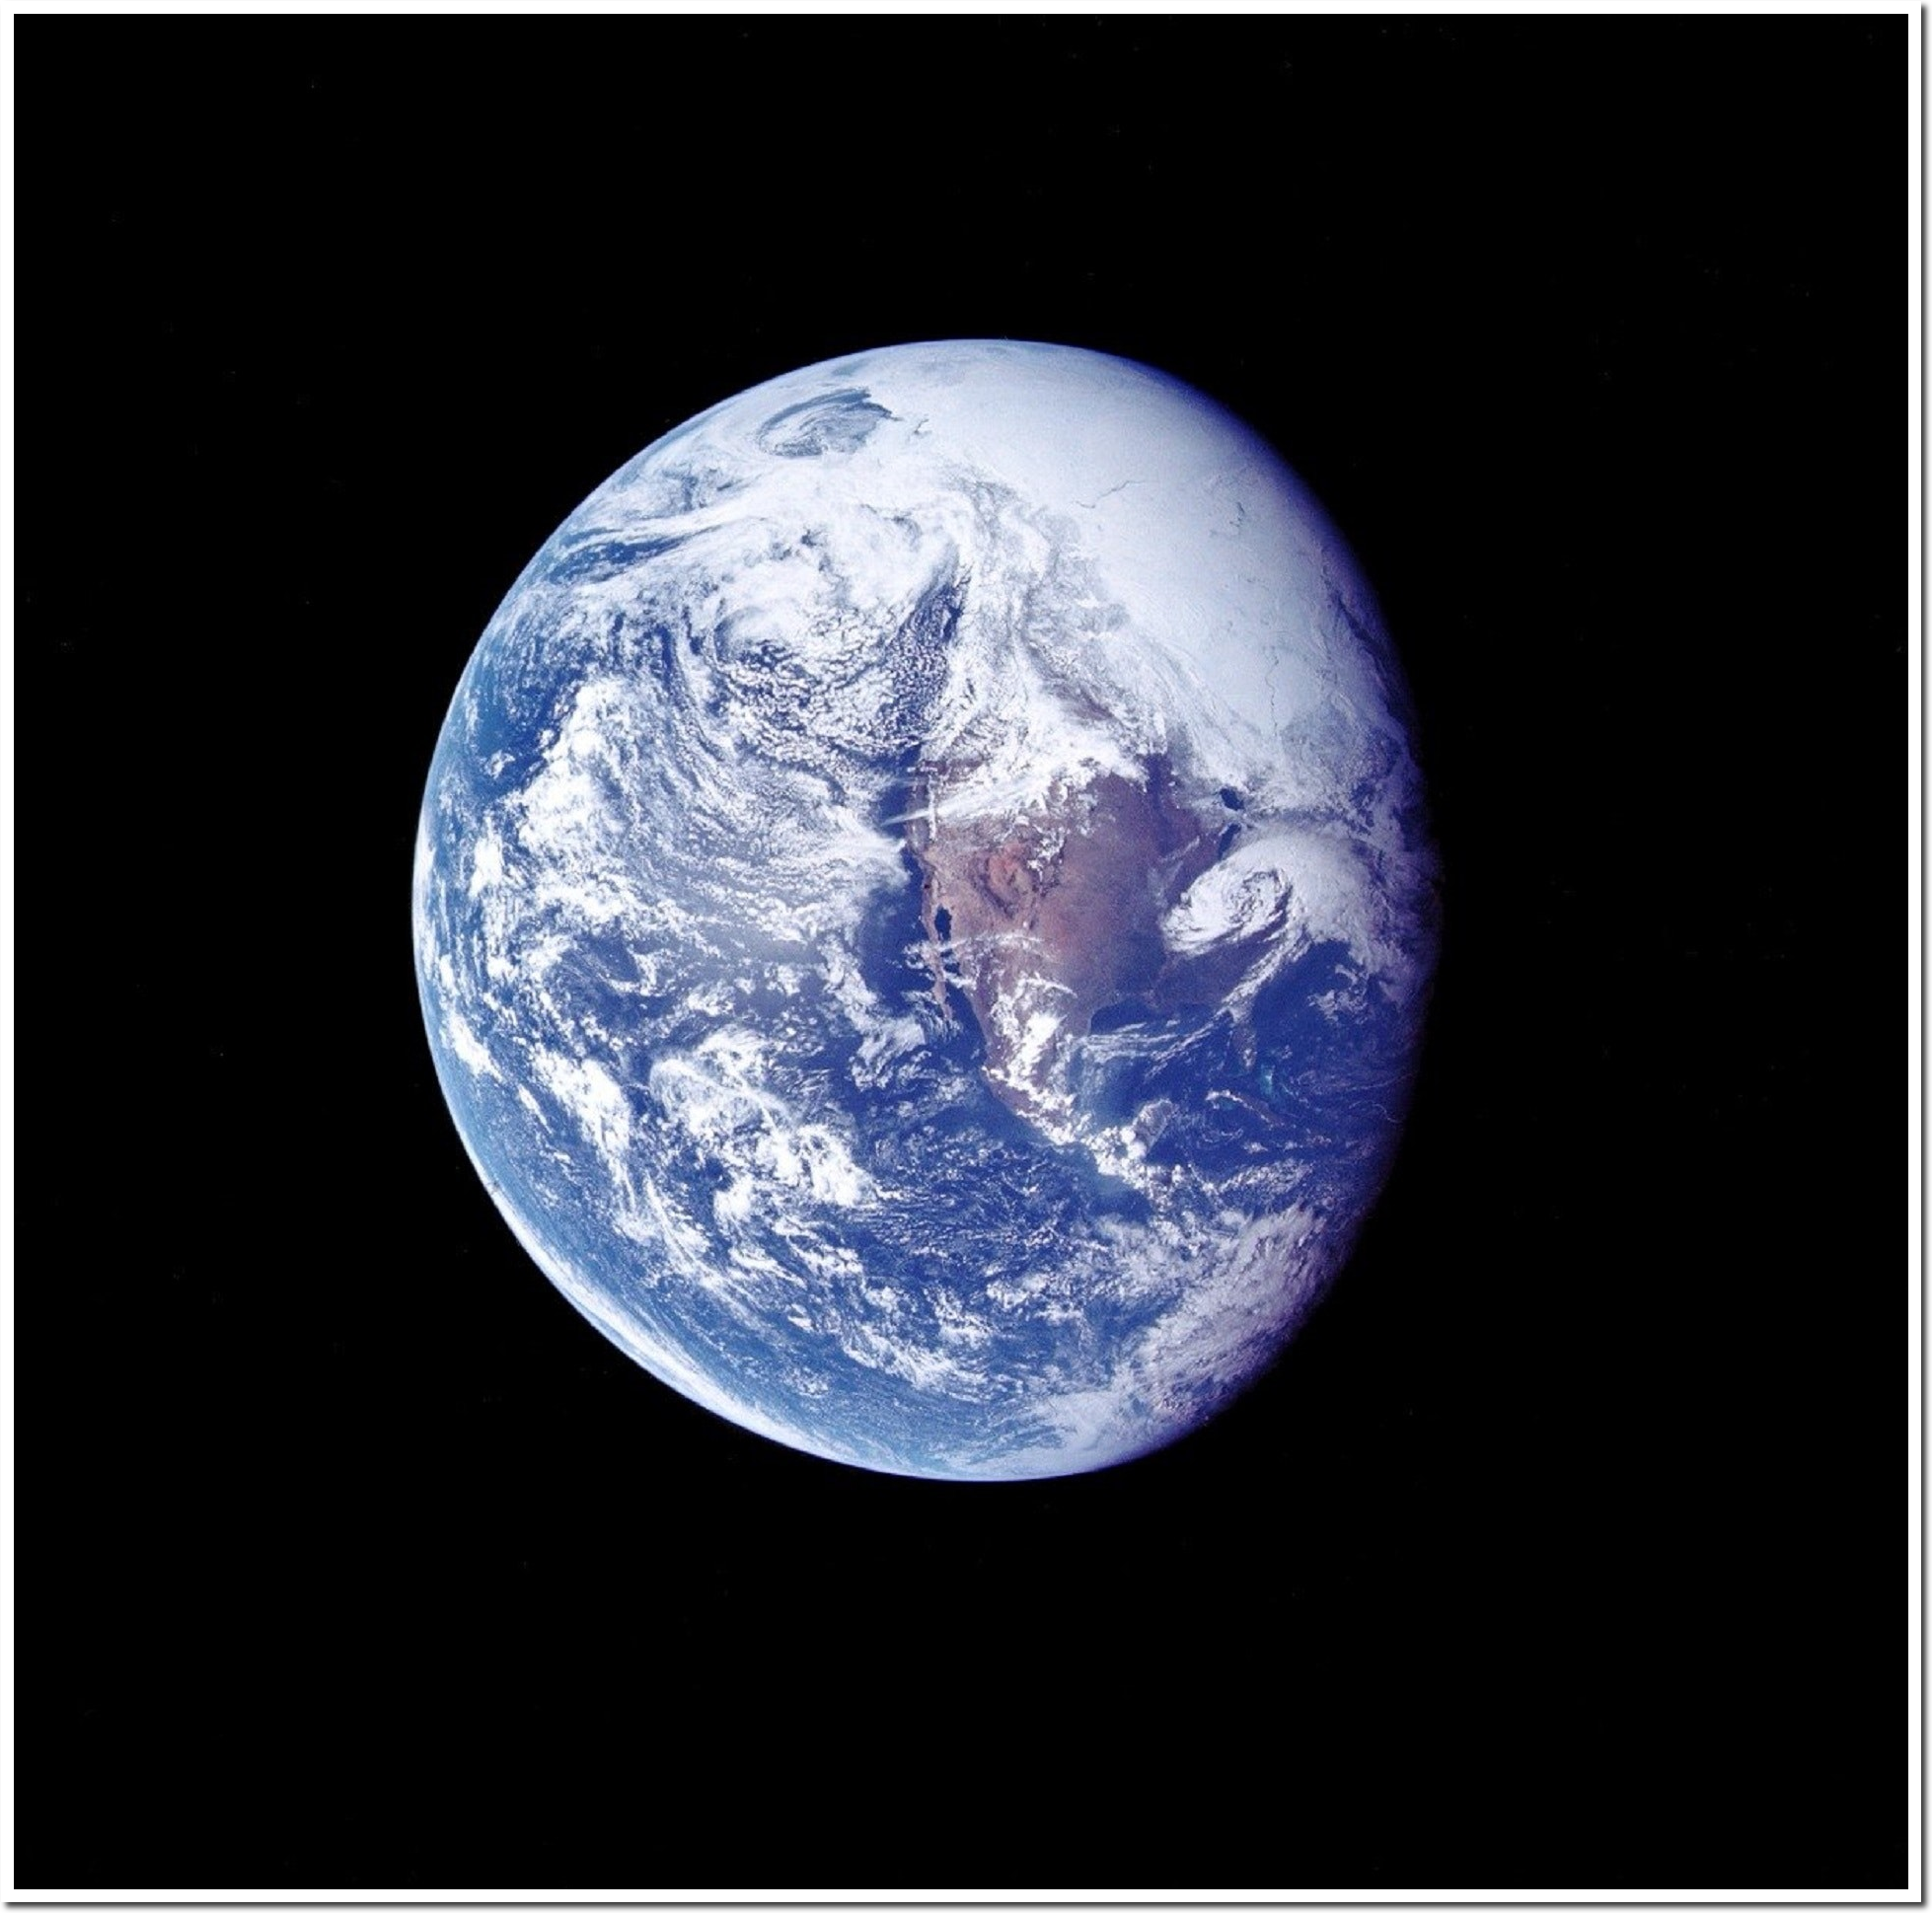
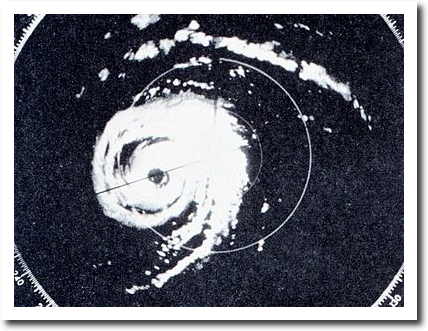
Here is a beautiful photo of Arctic sea ice taken by Apollo 16 in 1972, seven years before 1979.
In 1965, National Geographic published Arctic satellite imagery – fourteen years before the fake New York Times start date of 1979.
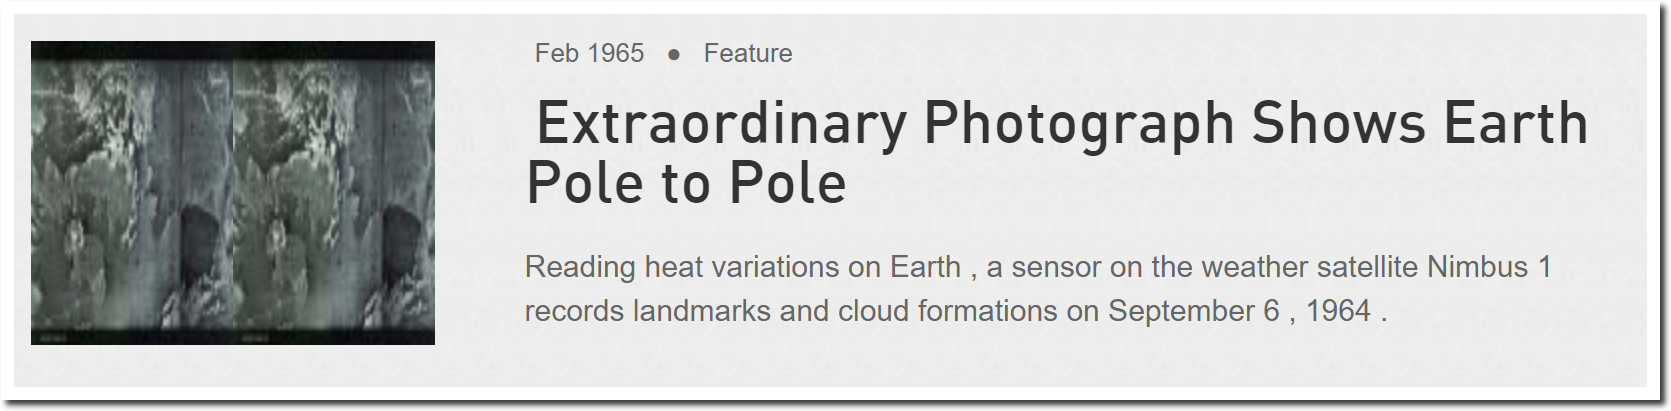
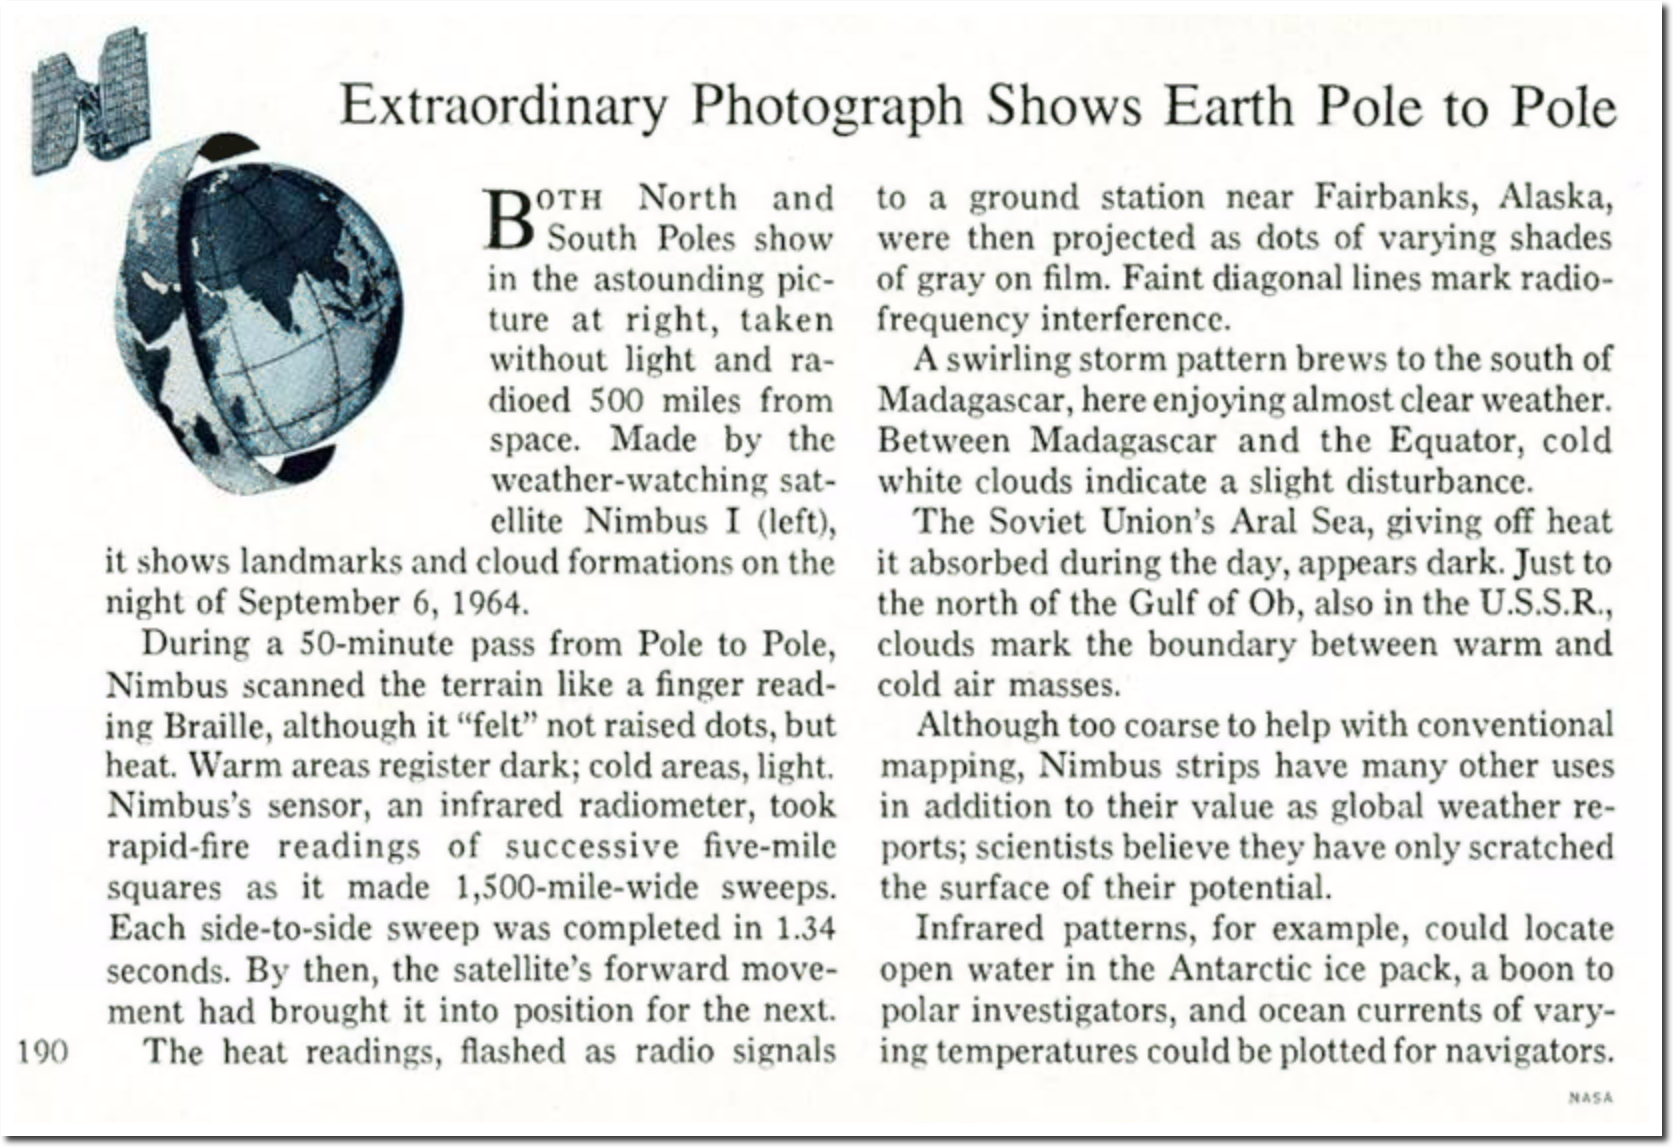
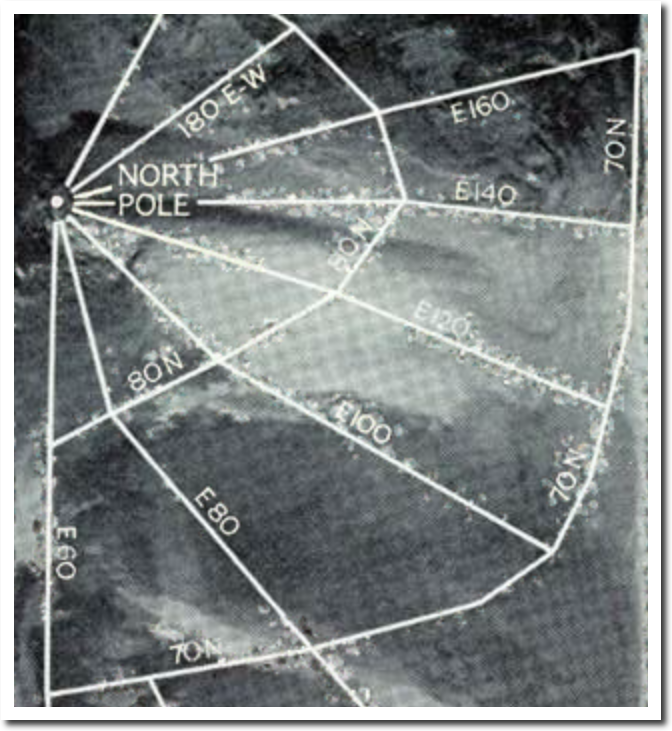
The National Geographic Archive | February 1965 | page 1
Here is a detailed satellite image of Antarctic sea ice from 1976, also published in National Geographic.
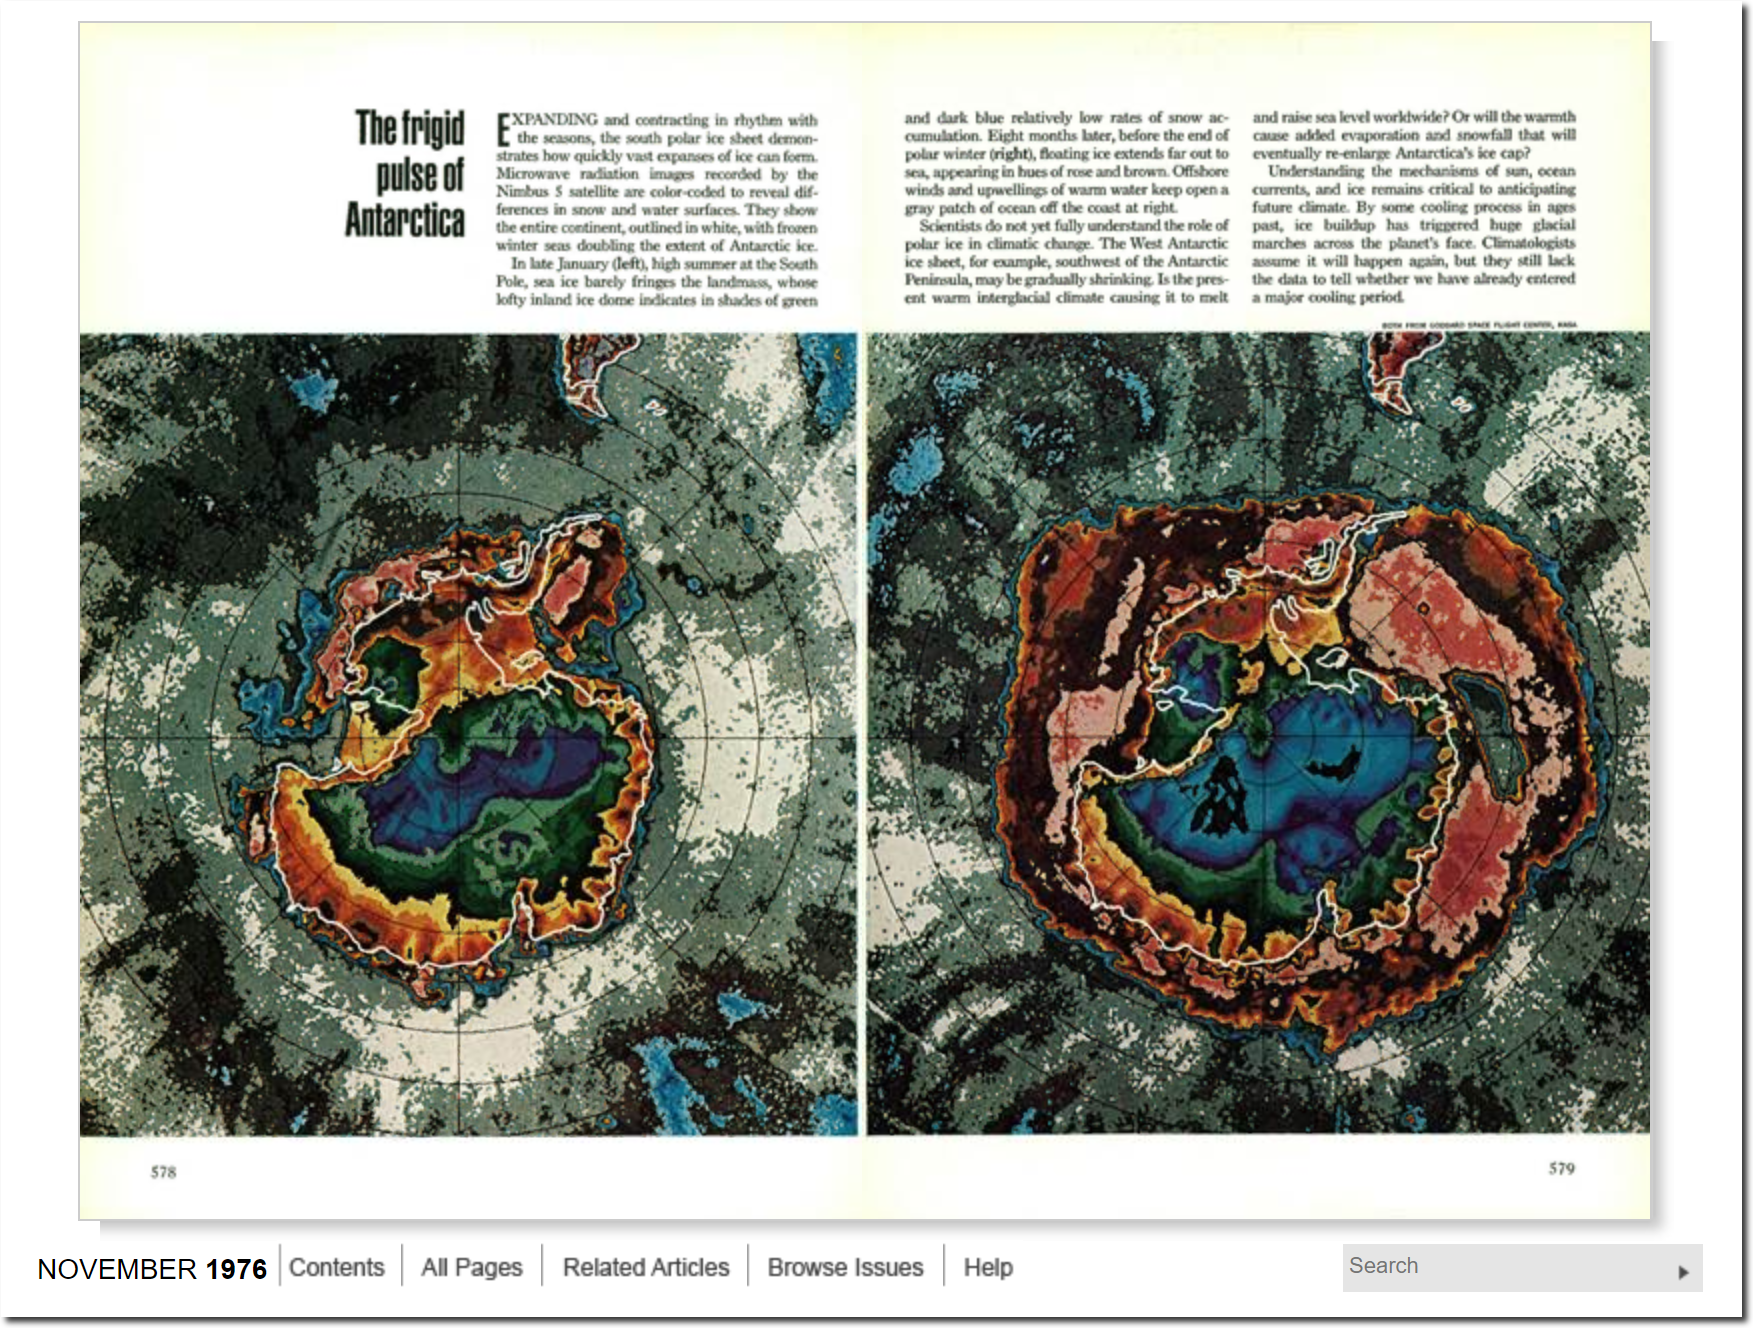
The National Geographic Archive | November 1976 | page 1
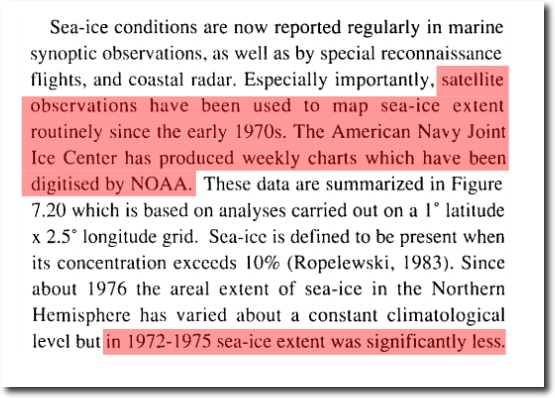
According to the Intergovernmental Panel On Climate Change (1990 IPCC report) – NOAA has sea ice satellite data going back to the early 1970s. You can see why the New York Times cherry picked the 1979 start date, because it was the high point. By starting at the top of the mountain, all directions go down. They lied to their readers about the 1979 start of satellite records, and it is clear why they did that.
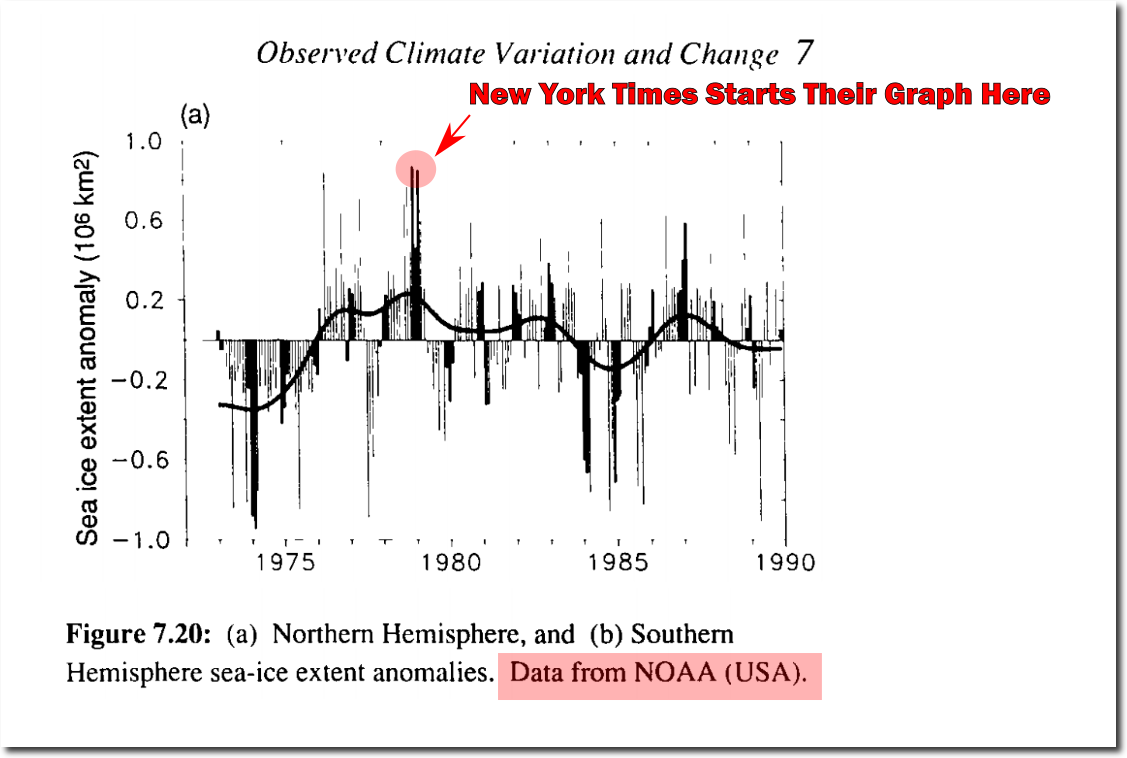
“in 1972-1975 sea-ice extent was significantly less”
1990 IPCC Report
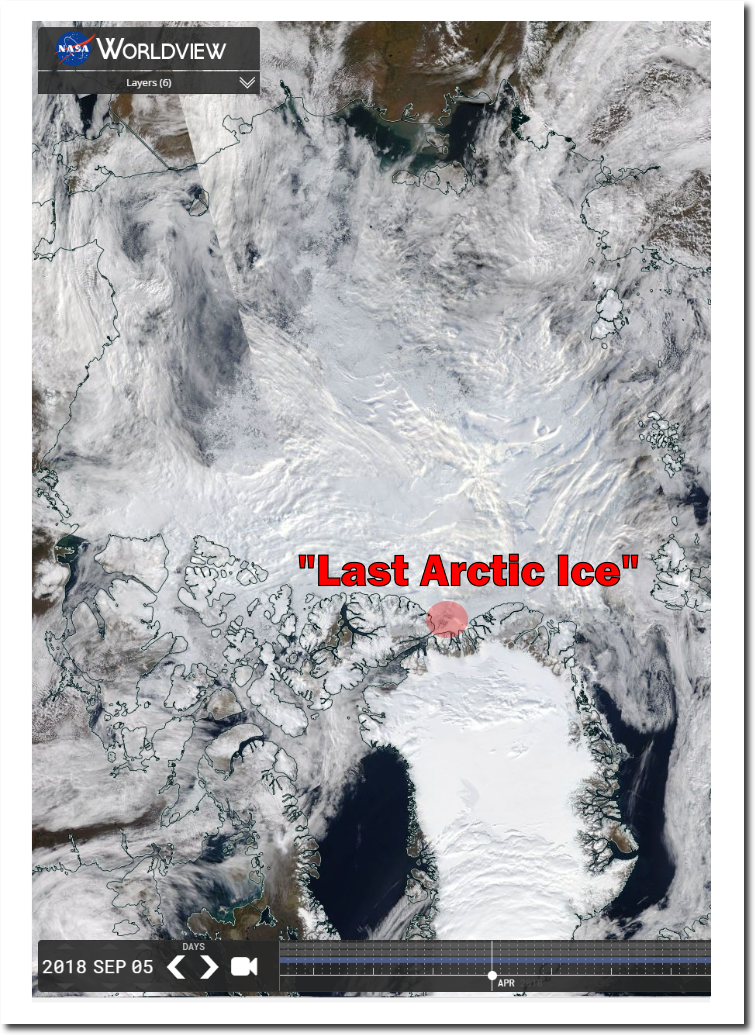
In 1971, National Geographic published a very detailed map of Arctic sea ice. Extent this year is not terribly different from 1971.
1971 2018
At the time, the New York Times was worried about expanding Arctic ice and a new ice age.
U.S. and Soviet Press Studies of a Colder Arctic – The New York Times
Forty-nine of the world’s leading climate scientists sent a letter to President Nixon warning of a new ice age within a century.
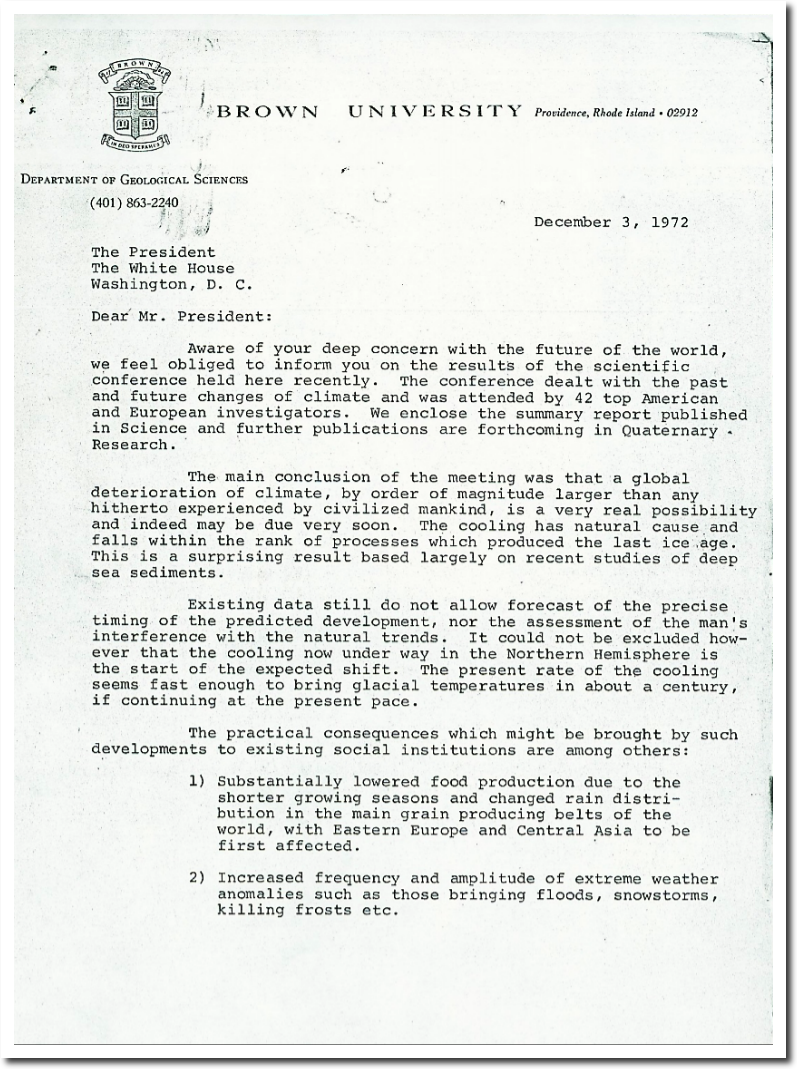
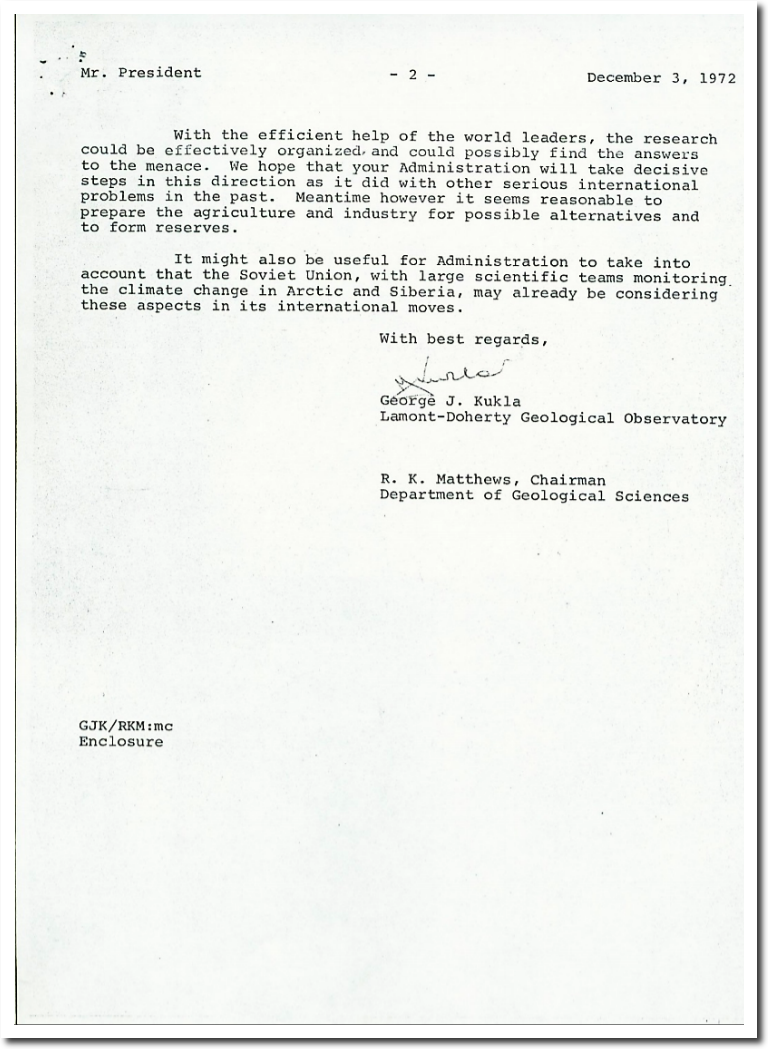
THE ROLE OF NOAA’S CLIMATE PREDICTION CENTER IN THE DEVELOPMENT OF CLIMATE SERVICES
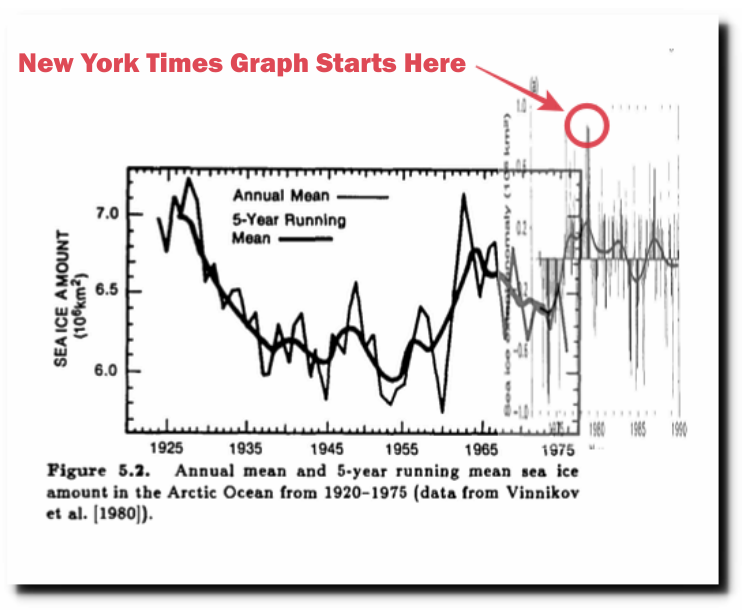
This 1985 DOE climate change report had Arctic sea ice data back to 1925, which showed little ice from the 1930s to the 1950s.

Projecting the climatic effects of increasing carbon dioxide (Technical Report) | SciTech Connect
If we combine the 1985 DOE graph with the 1990 IPCC graph, it becomes even more apparent why the New York Times cherry picked the 1979 start date. It was the century high point in Arctic ice extent.
In 1958, the ice was disappearing rapidly, and the New York Times predicted the Arctic would be ice-free soon.

The Changing Face of the Arctic; The Changing Face of the Arctic – The New York Times
But three years later, there was unanimous consensus for global cooling, as reported by the New York Times.

January 30, 1961 – NYTimes
The polar ice cap expanded 12% by 1975, after shrinking 12% before 1958. Icelandic ports were blocked with ice for the first time in the 20th century. The New York Times doesn’t want their readers to know about this.
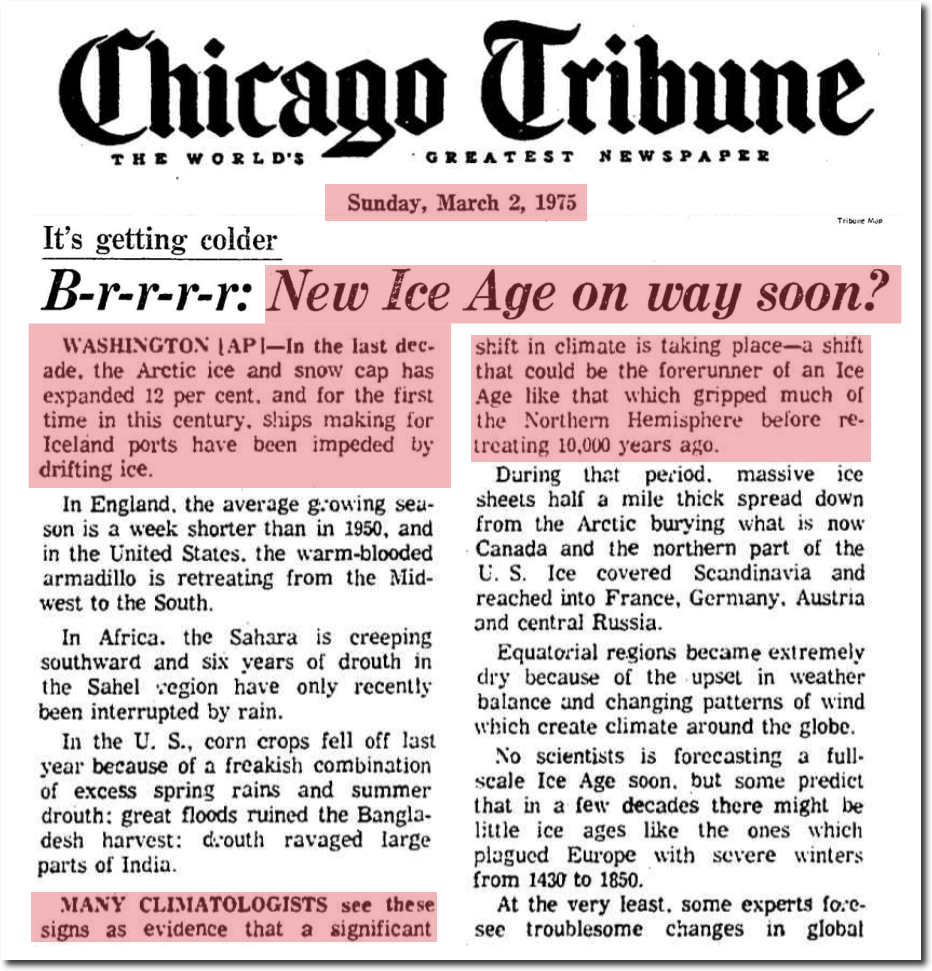
March 2, 1975 – B-r-r-r-r: New Ice Age on way soon? | Chicago Tribune Archive
Looking at a graph of Icelandic temperatures, it again becomes clear why the New York Times cherry-picked their start date of 1979 – it was the coldest year on record in Iceland and the highest ice extent. Temperatures are no warmer in Iceland now than the were in the 1940s.
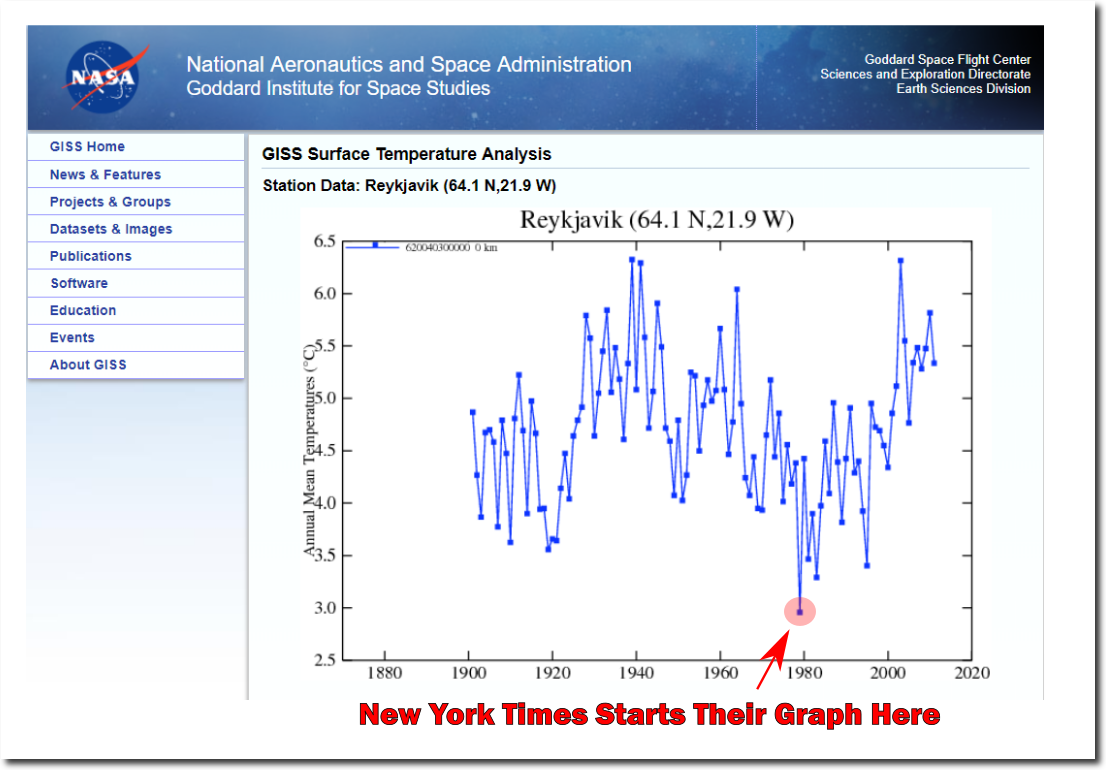
Data.GISS: GISS Surface Temperature Analysis
From the 1920s through the 1950s, the Arctic was having a meltdown.
https://docs.lib.noaa.gov/rescue/mwr/050/mwr-050-11-0589a.pdf
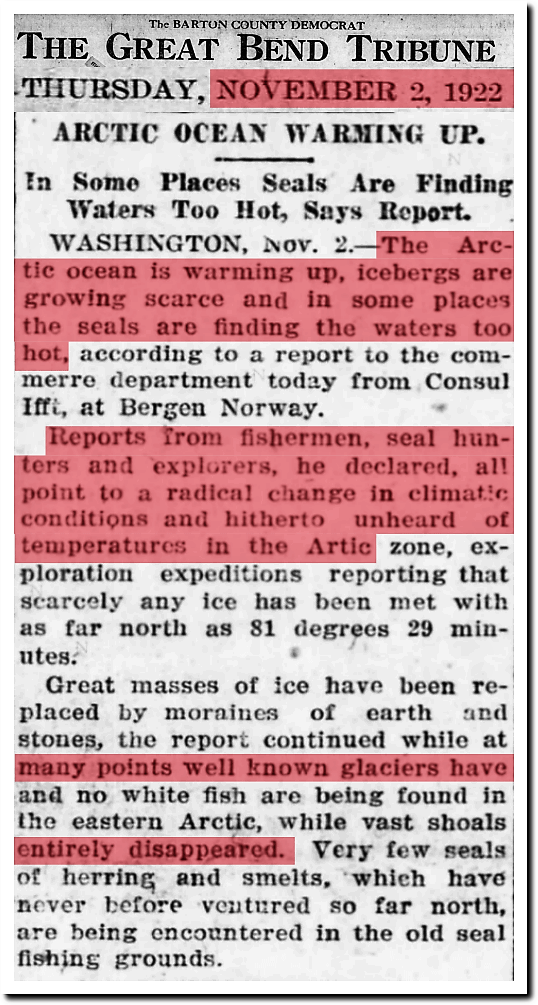
2 Nov 1922, Page 1 – Great Bend Tribune at Newspapers.com

17 Dec 1939, Page 15 – Harrisburg Sunday Courier
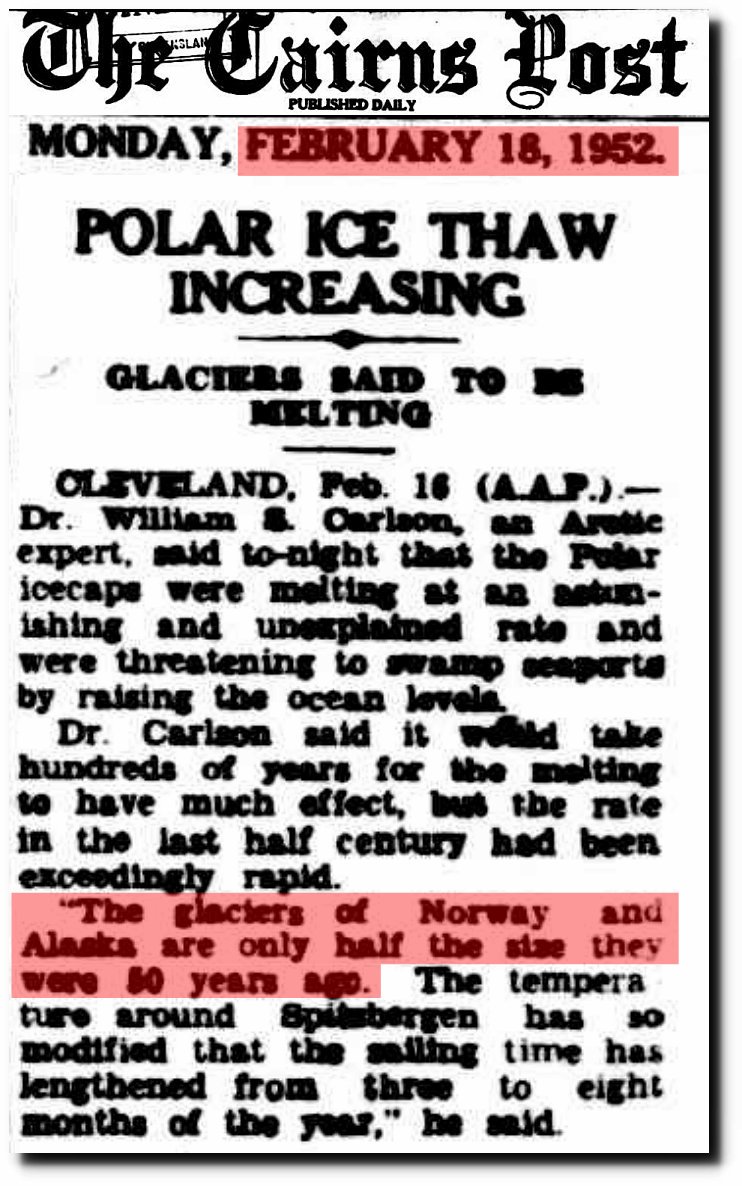
18 Feb 1952 – POLAR ICE THAW INCREASING
Actual scientists understand that these swings in Arctic temperature sea ice are controlled by ocean currents, not CO2. If the New York Times was an actual newspaper, they would have reported on this.
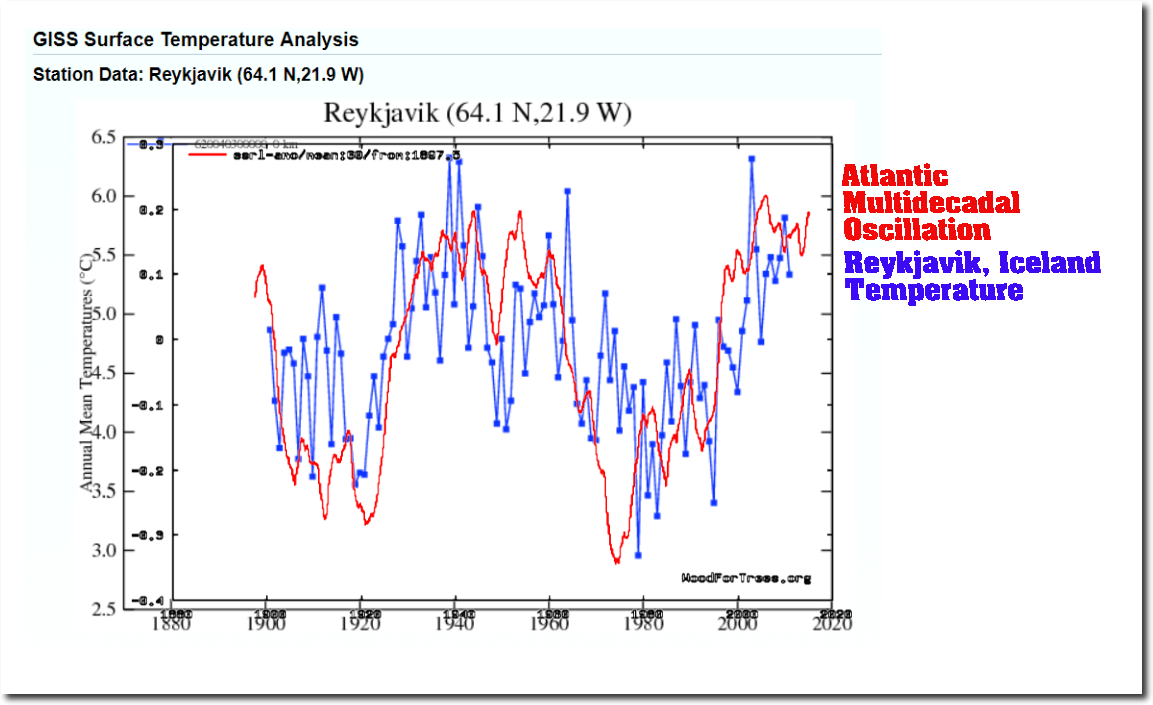
Reykjavik GISS V2 AMO
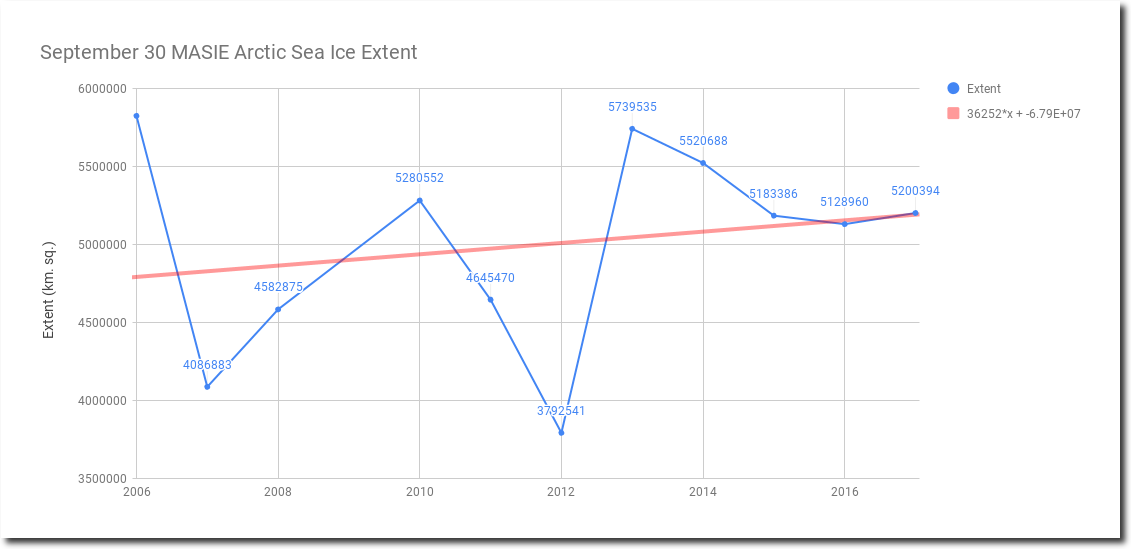
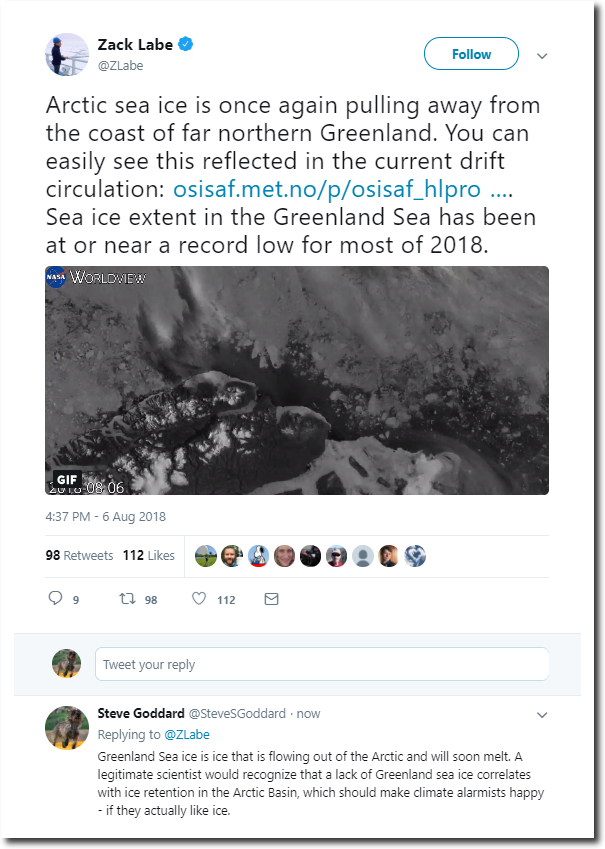
NOAA data shows September 30 Arctic sea ice extent trending upwards since the start of MASIE records in 2006. This year will continue the upwards trend. The New York Times claim that summer sea is is declining is patently false.
masie_4km_allyears_extent_sqkm.csv
It is not surprising that end of summer sea ice extent is increasing. Summers have been running consistently below normal temperatures in the Arctic for years. That is the only time the ice can melt.

Ocean and Ice Services | Danmarks Meteorologiske Institut
According to the our top experts, the Arctic was supposed to be ice-free by now, but instead sea ice is increasing.

The Argus-Press – Google News Archive Search
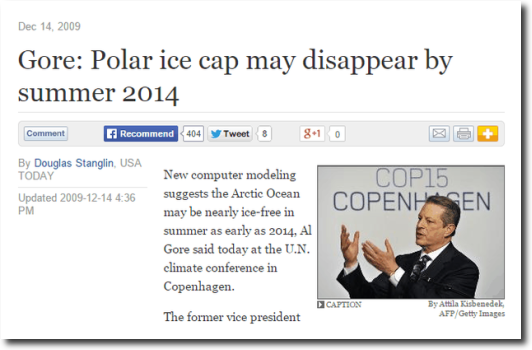
Gore: Polar ice cap may disappear by summer 2014
Star-News – Google News Archive Search
BBC NEWS | UK | Swimmer aims to kayak to N Pole
North Pole could be ice free in 2008 | New Scientist
Scientists: ‘Arctic Is Screaming,’ Global Warming May Have Passed Tipping Point | Fox News
The New York Times is hiding data, cheating with their graphs, lying about history, lying about the future, lying about science, contradicting themselves, ignoring history, ignoring the past failures of climate scientists, and intentionally defrauding their readers about Arctic sea ice. This appears to be standard operating procedure for New York Times journalists.


