
Without ever getting access to Hillary’s server, and without ever talking to Julian Assange, the deep state has determined that Russia did it!

Seth Rich was not available for comment.
Without ever getting access to Hillary’s server, and without ever talking to Julian Assange, the deep state has determined that Russia did it!
Seth Rich was not available for comment.
On this day in 1936, it was 112 degrees in Iowa, 113 degrees in Illinois, Indiana and Kentucky, 112 degrees in Wisconsin, 110 degrees in Minnesota, 109 degrees in Michigan, and 112 degrees in Missouri. Weather this hot is completely incomprehensible now.
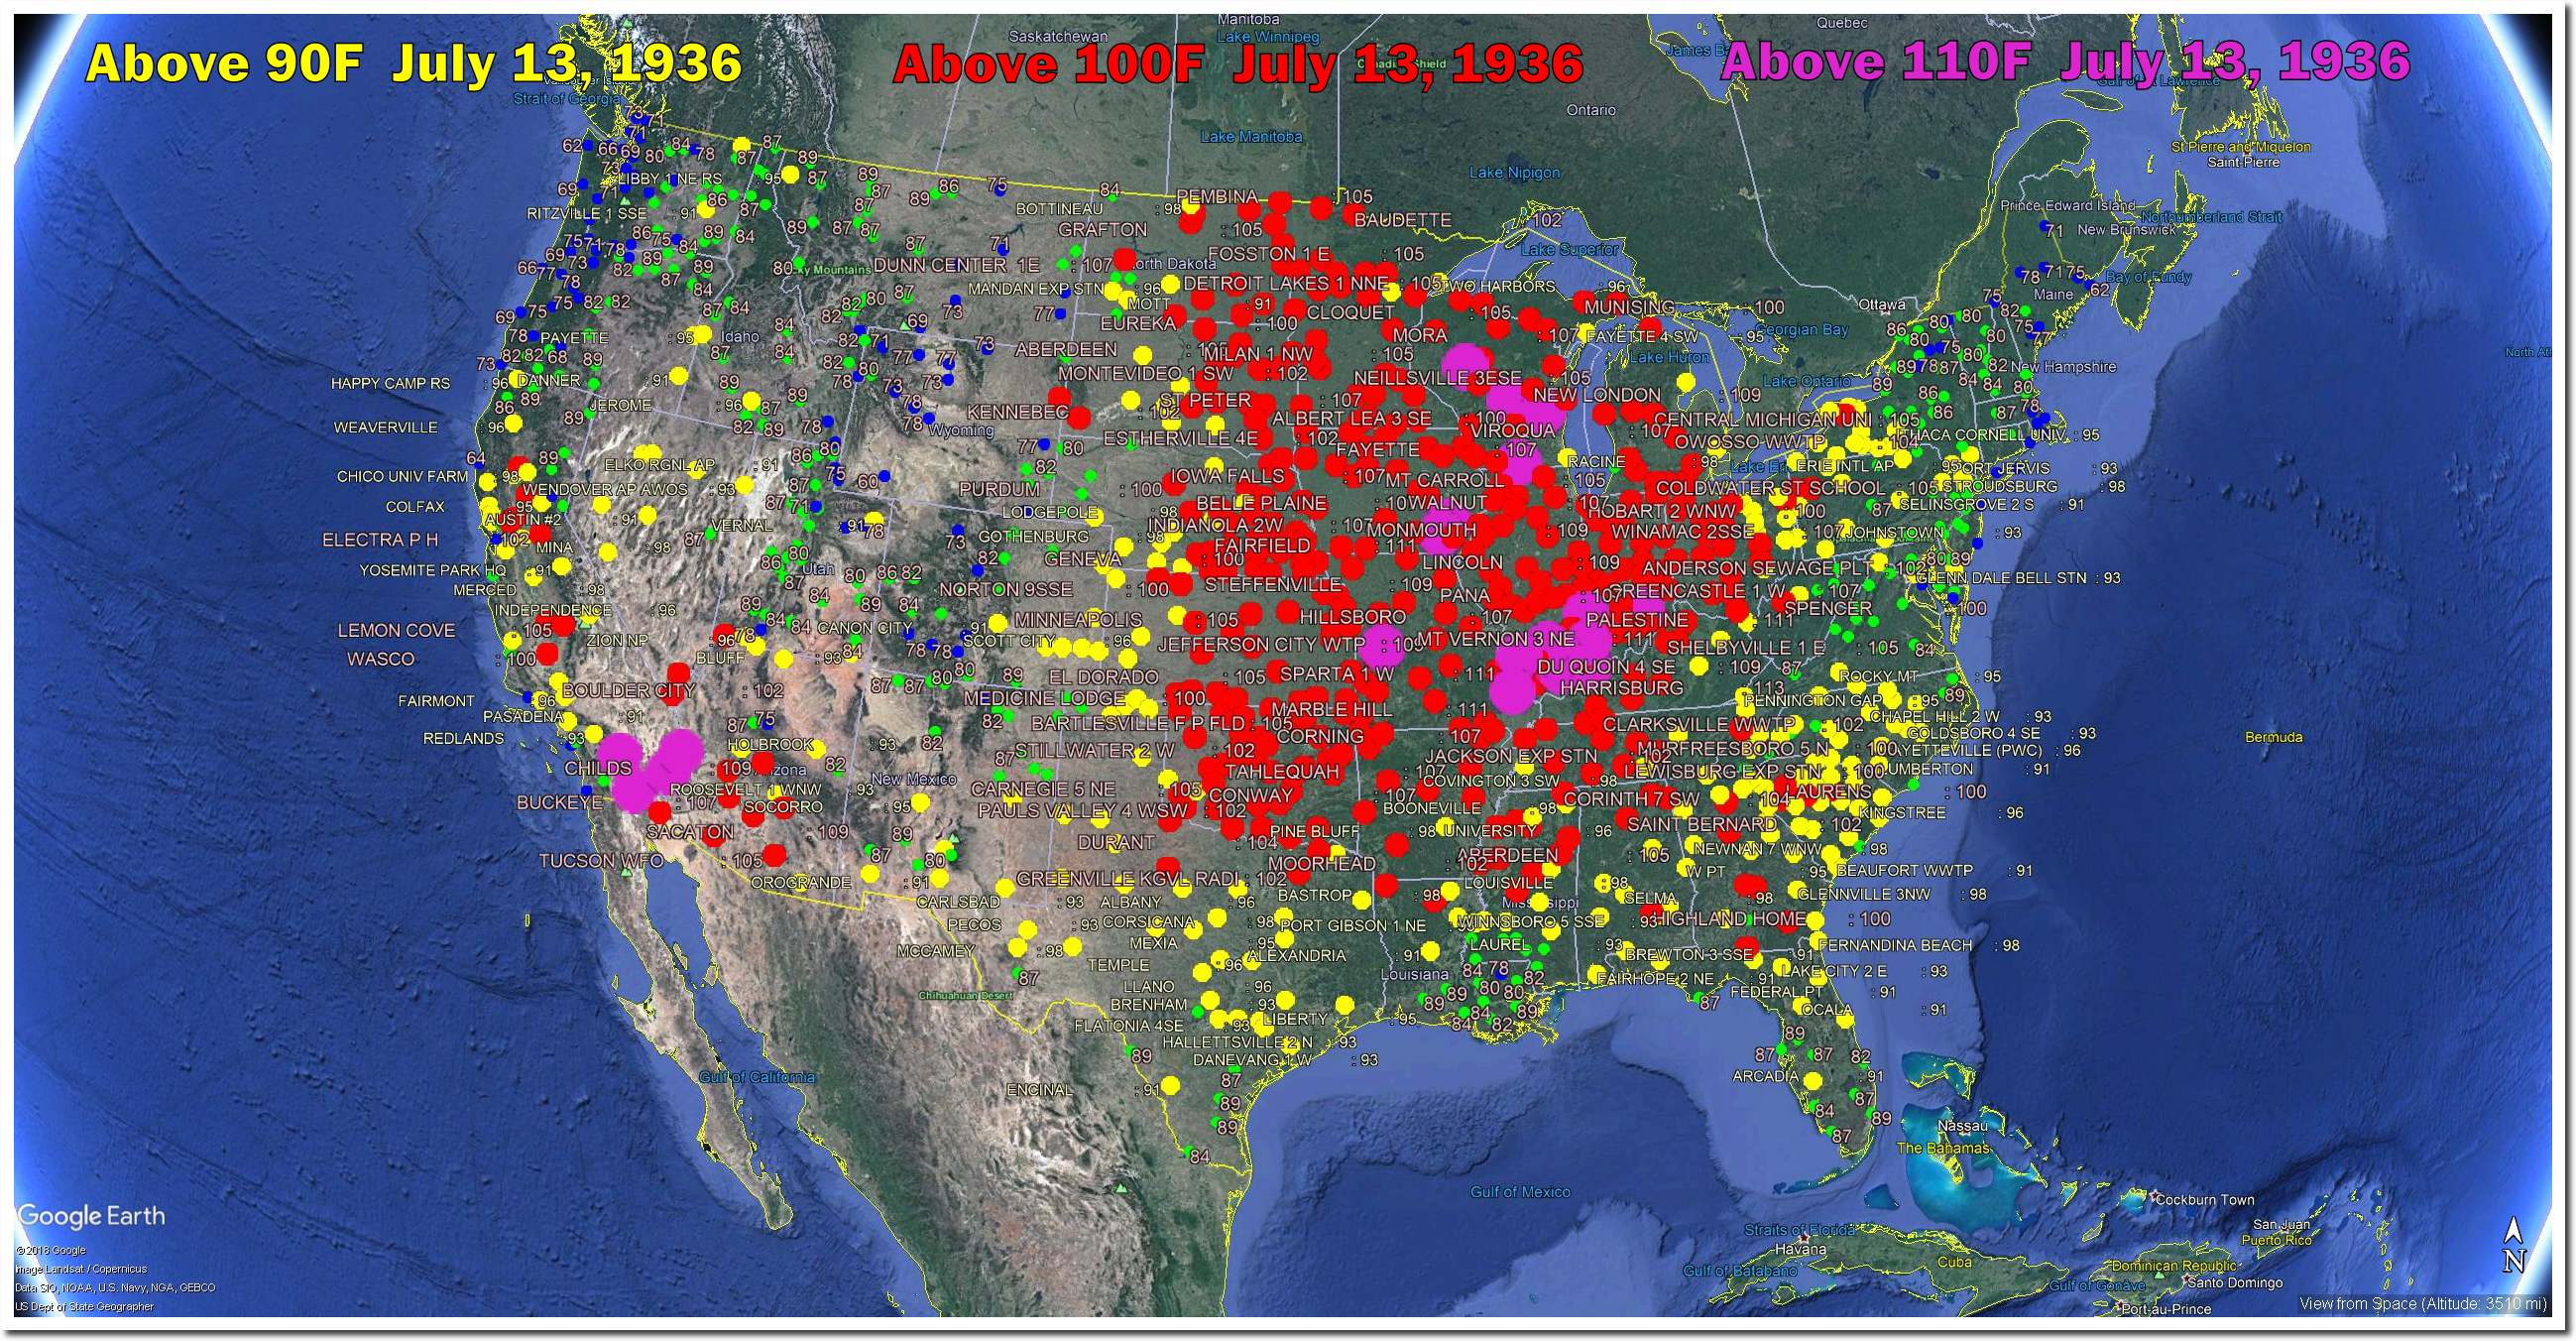
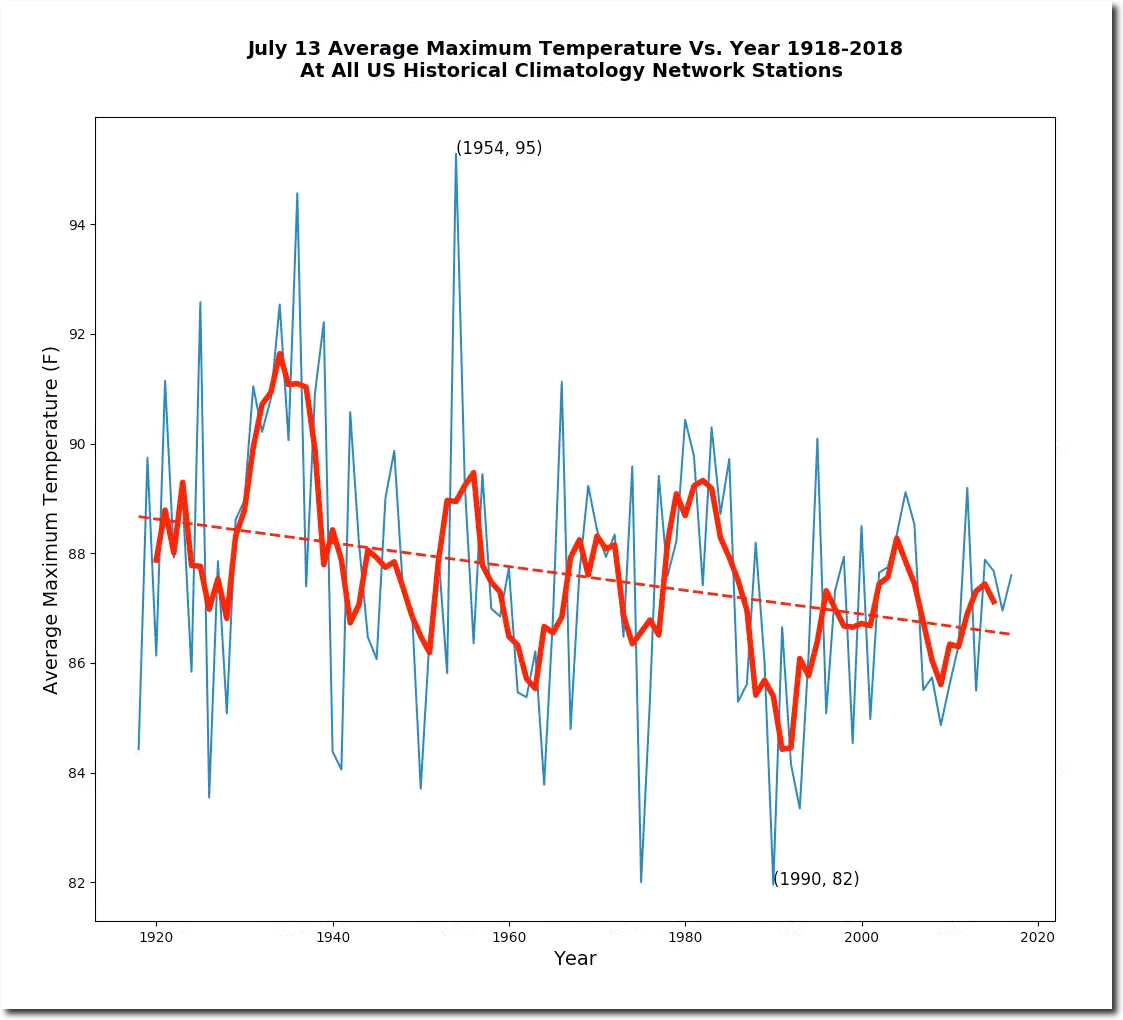
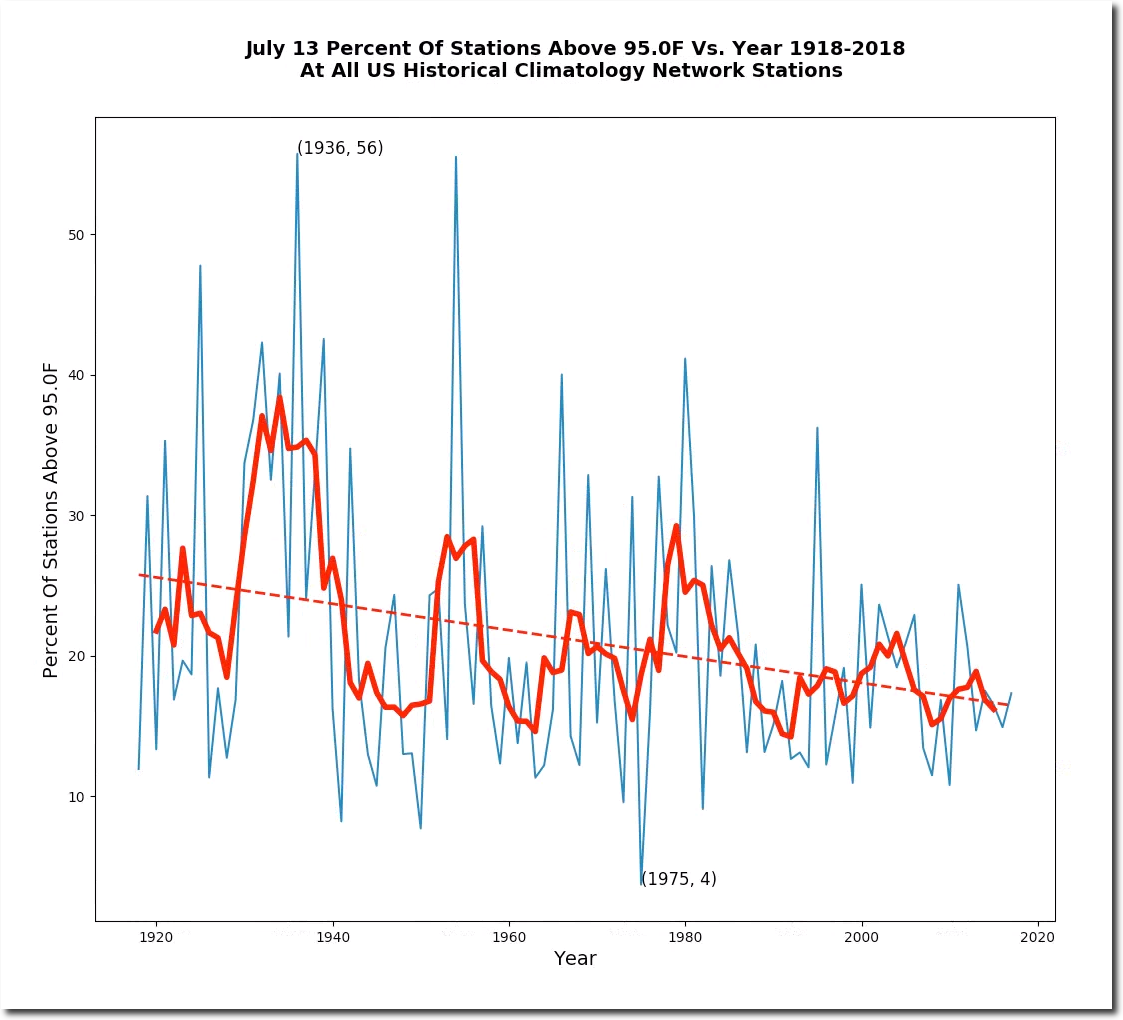
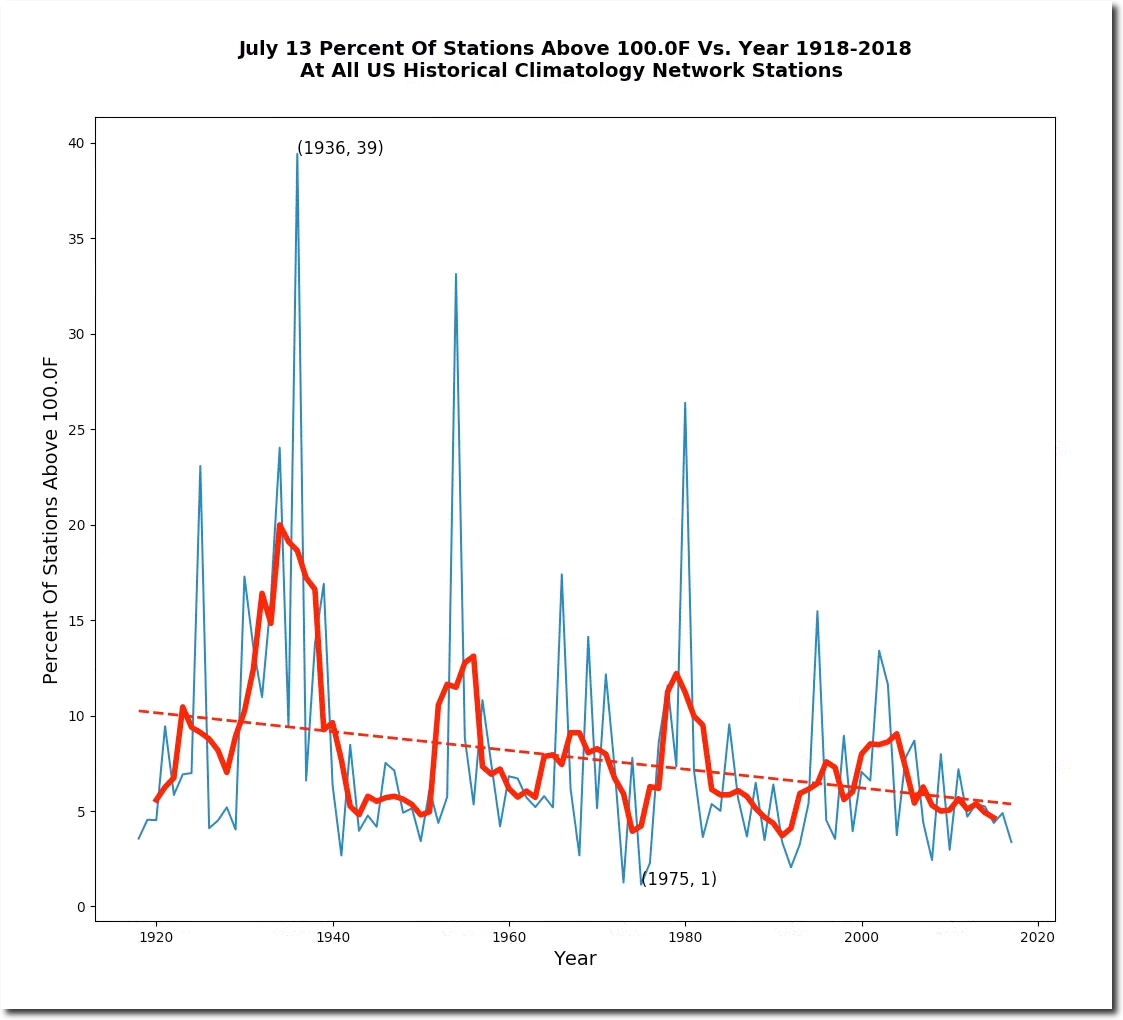
July 13th afternoon temperatures have been plummeting in the US for a century.
Sea ice extent is normal at both poles.
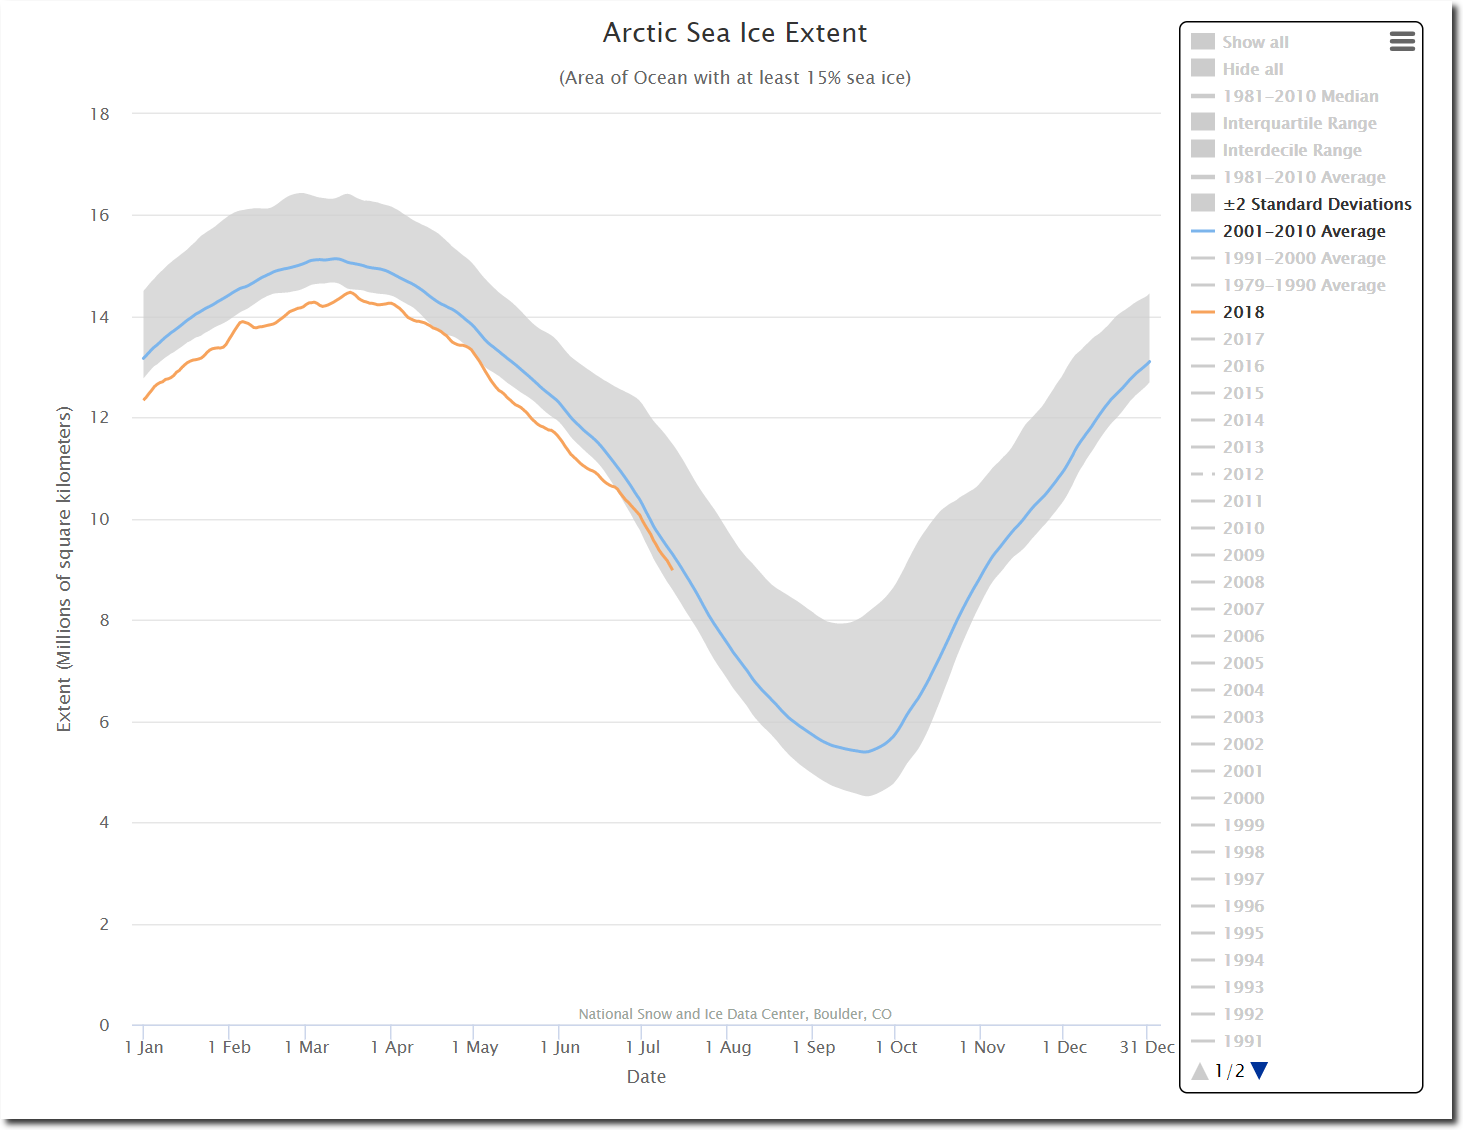

Charctic Interactive Sea Ice Graph | Arctic Sea Ice News and Analysis
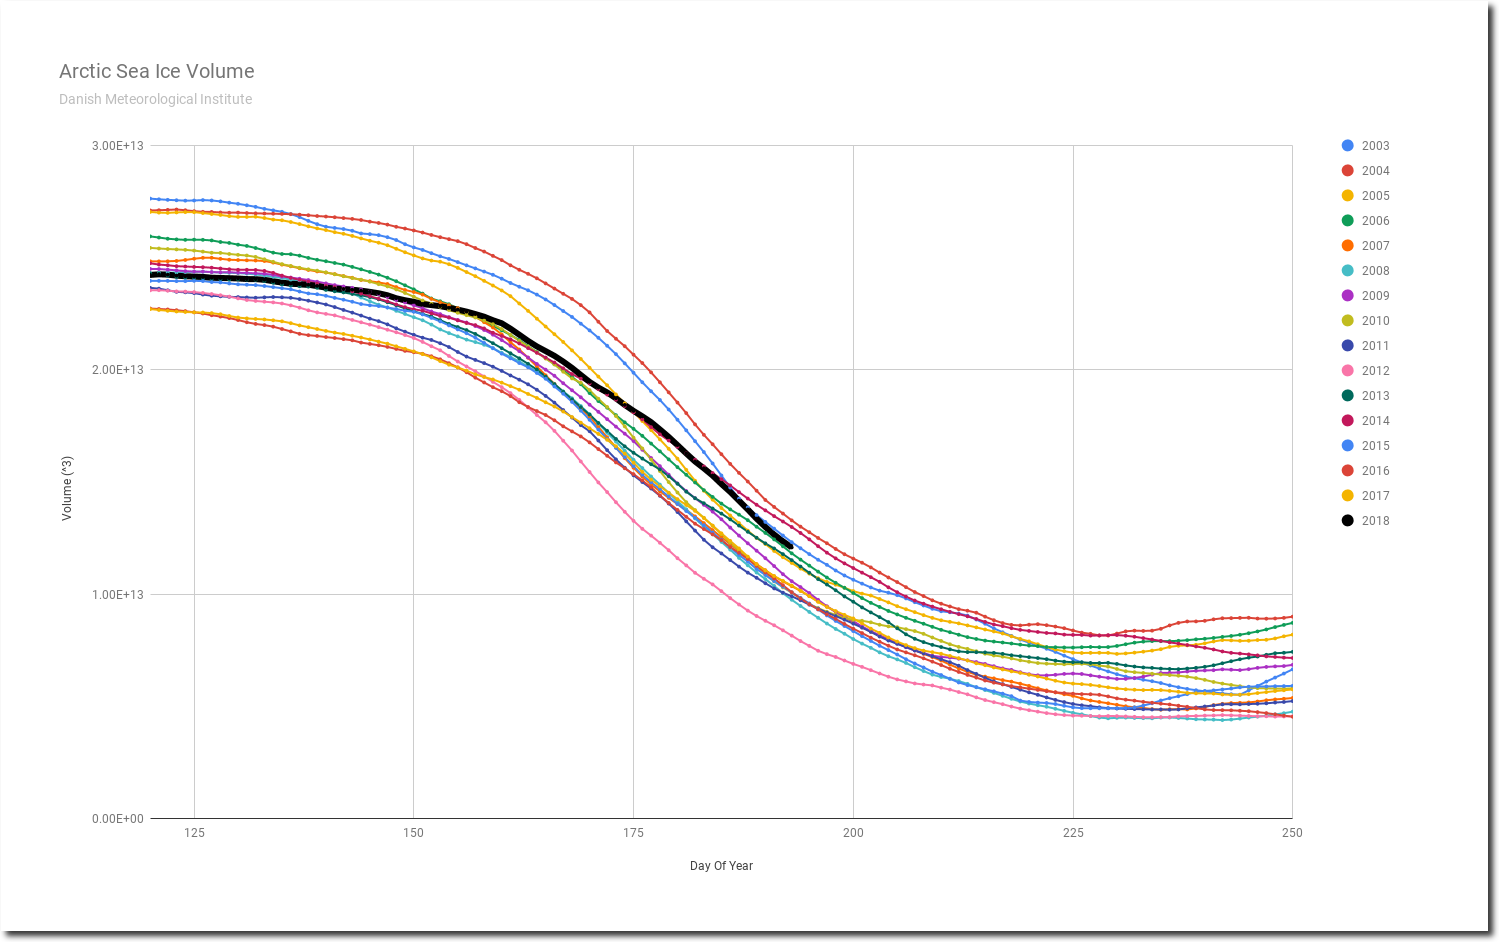
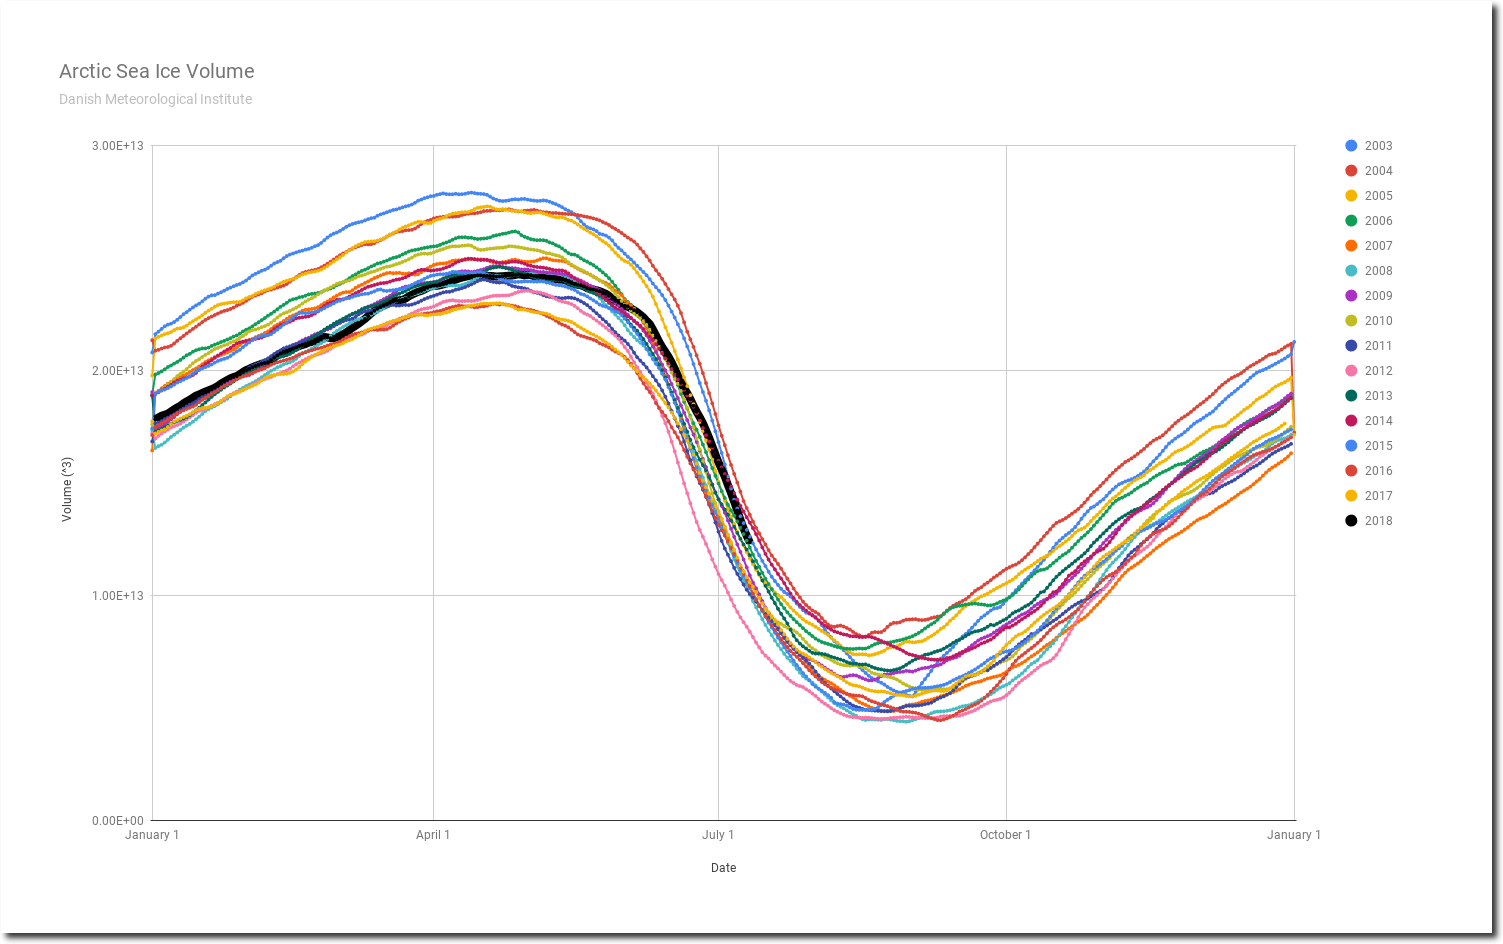
Arctic sea ice volume is fourth highest since 2003, with the melt season quickly winding down.

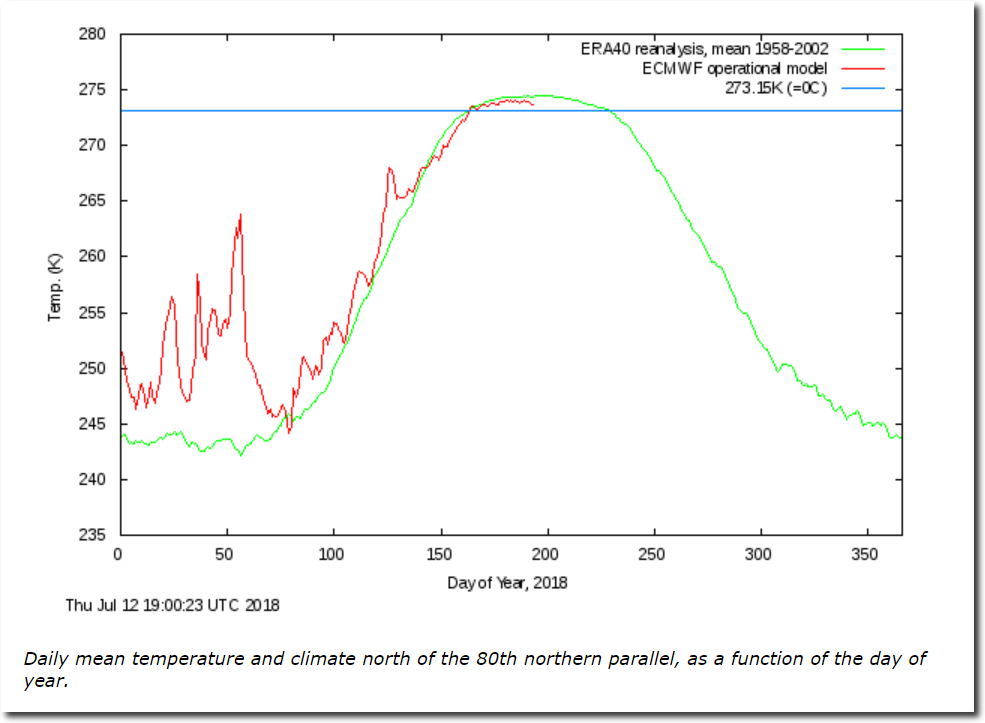
Temperatures near the North pole are well below normal and have been all summer.
Ocean and Ice Services | Danmarks Meteorologiske Institut
Sea surface temperatures around both the Antarctic and Greenland ice sheets are below normal.
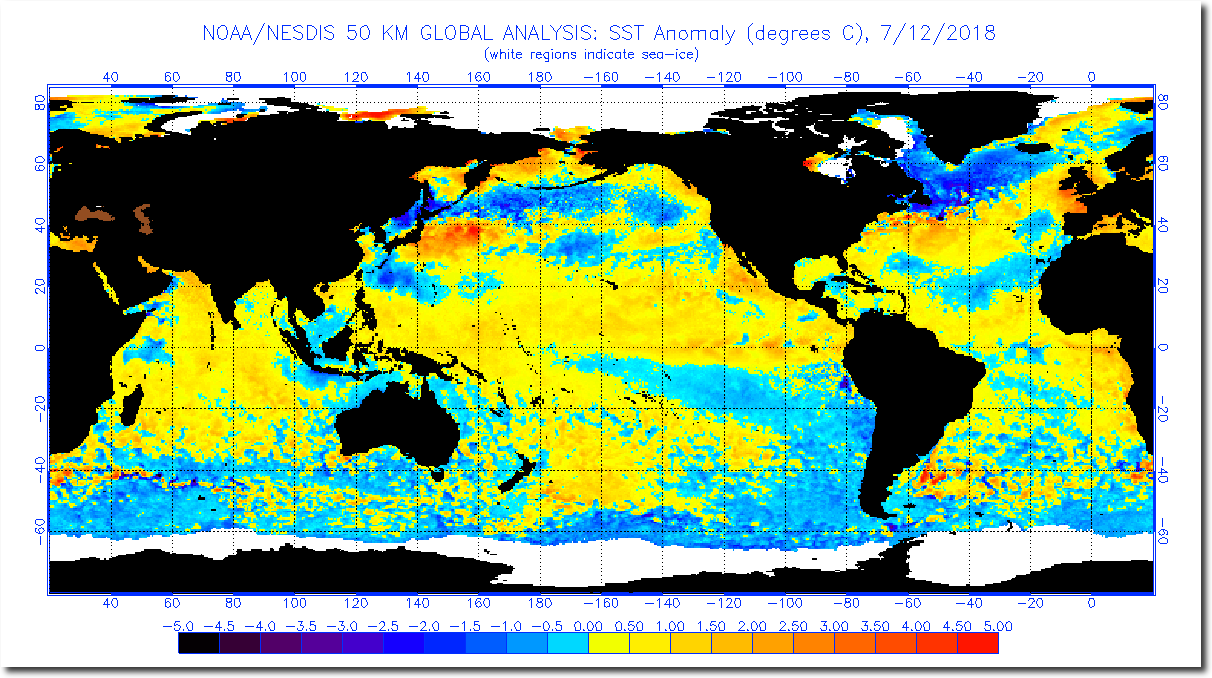
anomnight.7.12.2018.gif (1174×640)
Greenland’s surface has gained a near record amount of ice for the second straight year.
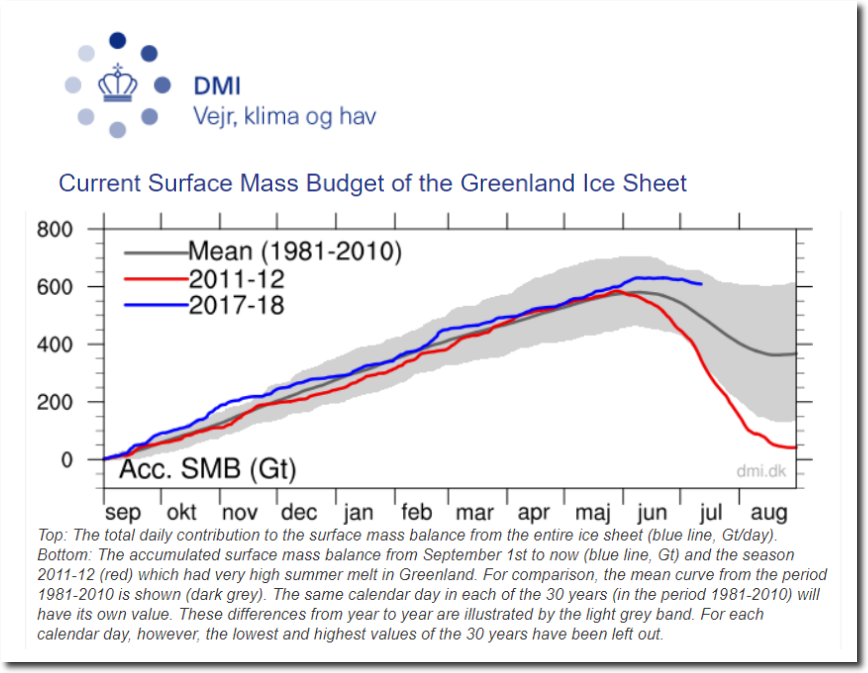
Greenland Ice Sheet Surface Mass Budget: DMI
Both the Antarctic and Greenland ice sheets are gaining ice.
Greenland Ice Sheet’s 2017 weigh-in suggests a small increase in ice mass | NOAA Climate.gov
NASA Study: Mass Gains of Antarctic Ice Sheet Greater than Losses | NASA
Both the Northern Sea Route and Northwest Passage are blocked by thick ice.
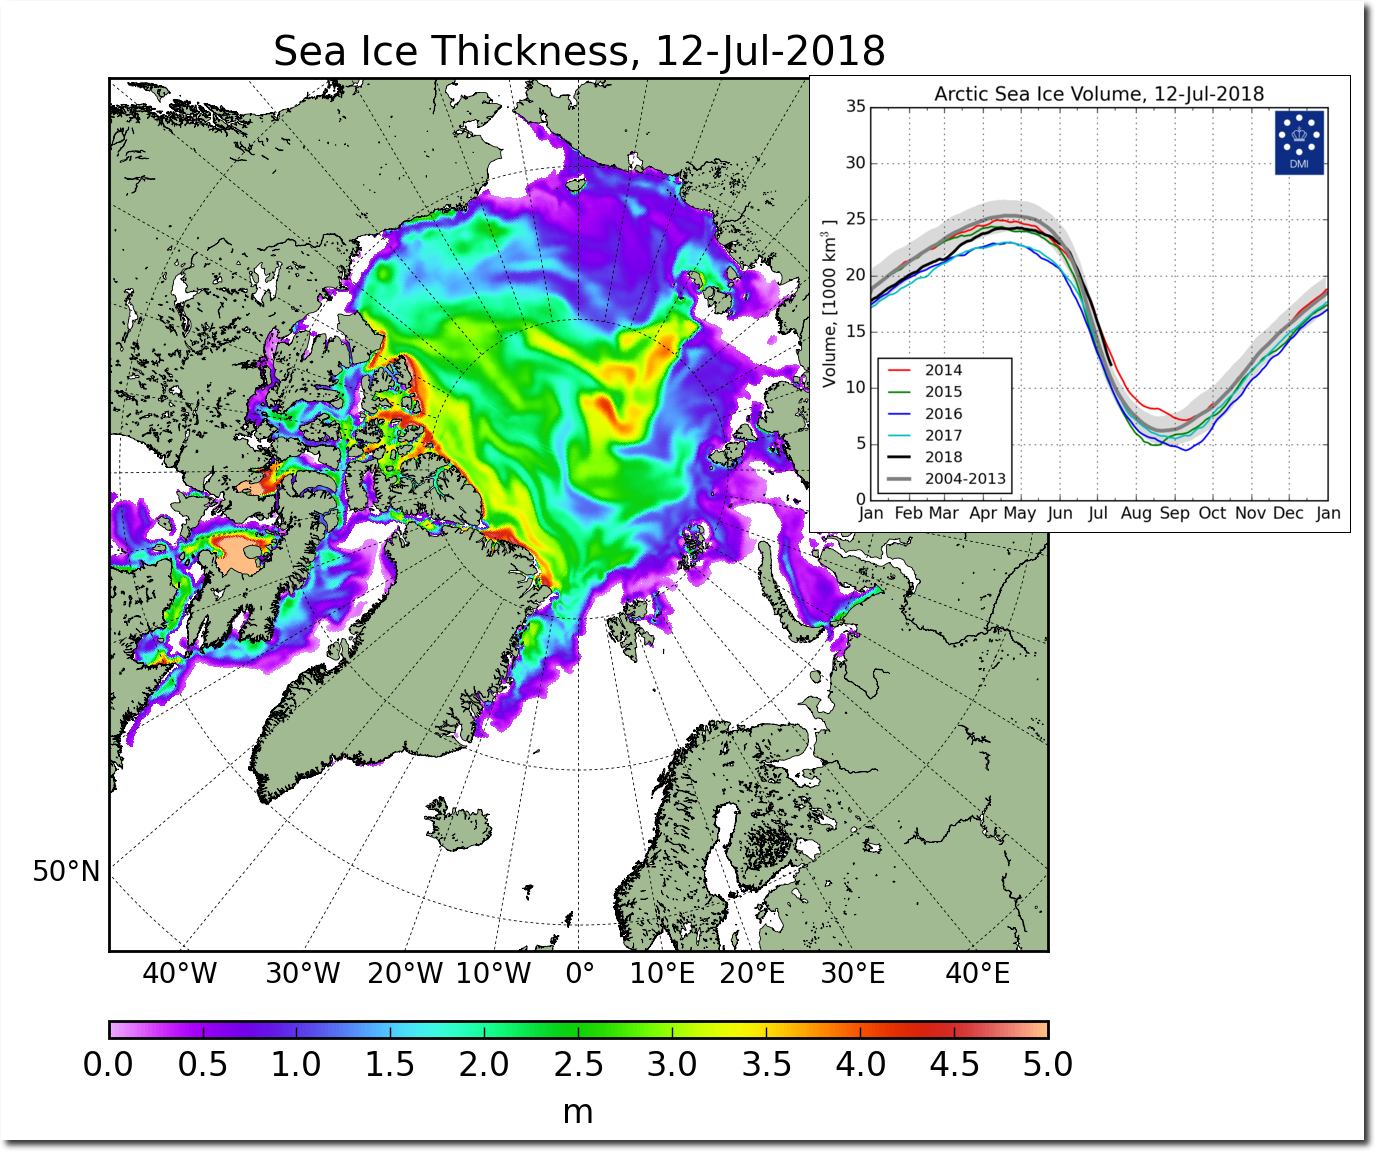
FullSize_CICE_combine_thick_SM_EN_20180712.png (1337×1113)
All of the Democrats leading prophets have failed.
The Argus-Press – Google News Archive Search
Gore: Polar ice cap may disappear by summer 2014
The polar melting scam has completely collapsed and predictions failed. Climate scientists, Democrats and the press have reacted quite predictably – by simply ramping up their lies, like they do about everything else.
Arctic sea ice volume melt rates have started to slow, with ice volume 4th highest since 2003.

Temperatures near the pole have been below normal almost every day this summer.
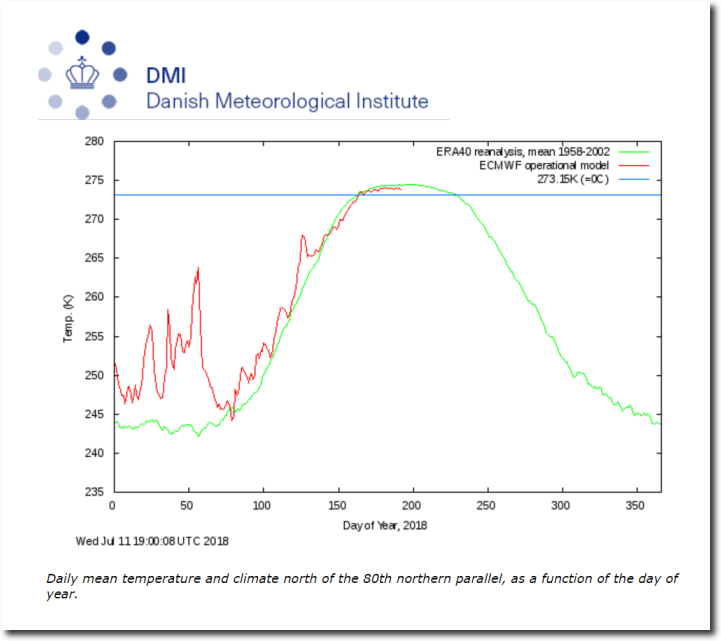
Ocean and Ice Services | Danmarks Meteorologiske Institut
Time is running out for the Democrats’ prophet, who predicted ice-free no later than 2018.

The Argus-Press – Google News Archive Search
He has a lot of work to do in the next couple of weeks, including melting the thick ice blocking the Northern Sea Route and Northwest Passages.

FullSize_CICE_combine_thick_SM_EN_20180711.png (1337×1113)
The Northwest Passage was open in 1903, but perhaps not this year.

According to NASA, 1904 was the coldest year on record. In the world of climate science, ice melts when it is cold and freezes when it is hot.

Meanwhile, climate scientists and the press continue their usual barrage of lies.

The usual fake news sources are reporting on Trump protesters in London, which reminded me of fifteen years ago.

I was in London during Bush’s 2003 visit. There were about six stoners holding signs in front of Buckingham Palace, and CNN reported it as a massive protest. Later CNN reported that tens of thousands of protesters were in Trafalgar Square. I was in Trafalgar Square (which isn’t big enough to hold more than a couple of thousand people) during the protest. There were also a couple of hundred of marchers surrounded by a line of police marching down Oxford Street.
There was a big event however that week. England won the Rugby World Cup, and the pubs were full to the brim at 8am in cold, pouring rain. About half a million people lined up on Whitehall for the parade when the team returned from Australia. People were singing and partying all night long in Leicester Square. CNN must have gotten that confused with their imaginary protesters.
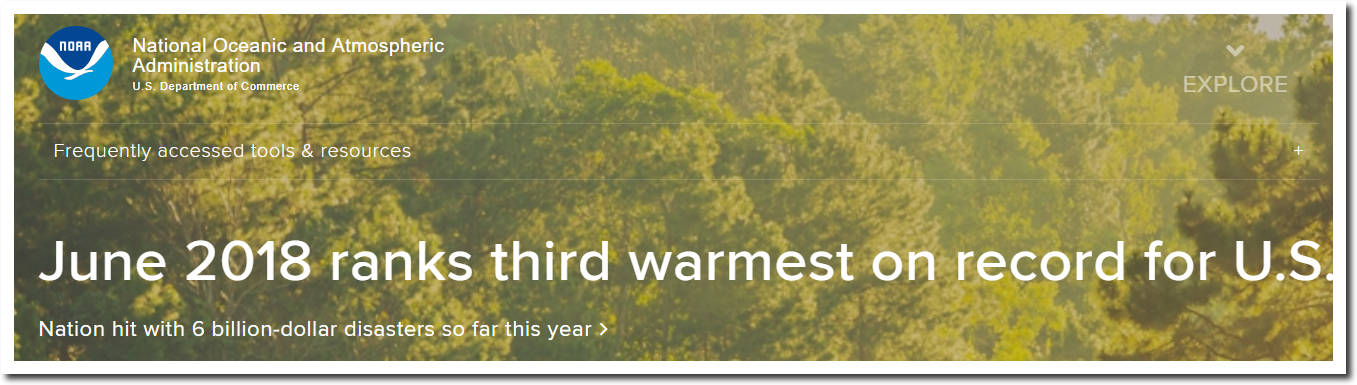
The NOAA web site says June. 2018 was third warmest on record in the US.
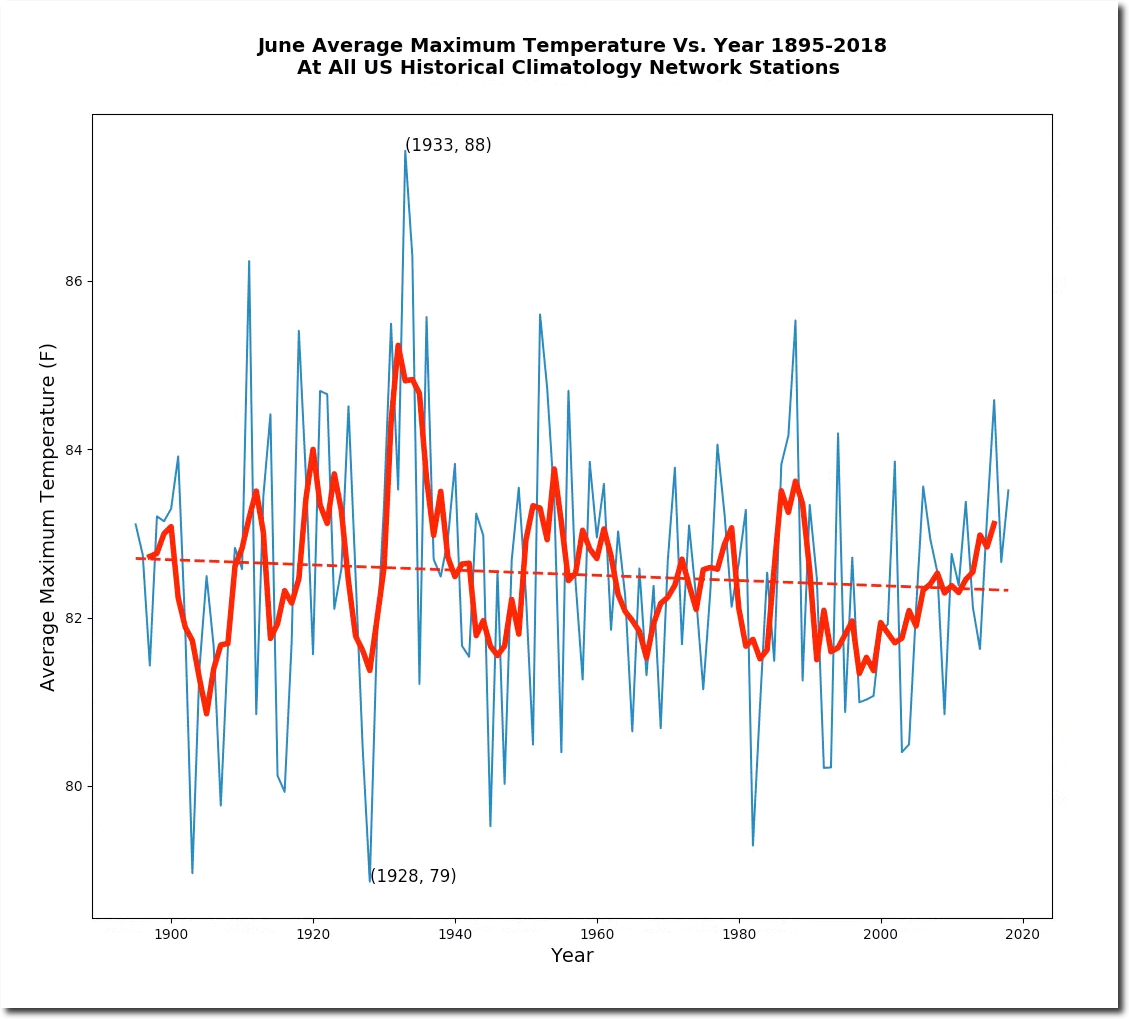
The un-tampered NOAA data shows that afternoon temperatures were 30th warmest, and not much above average.
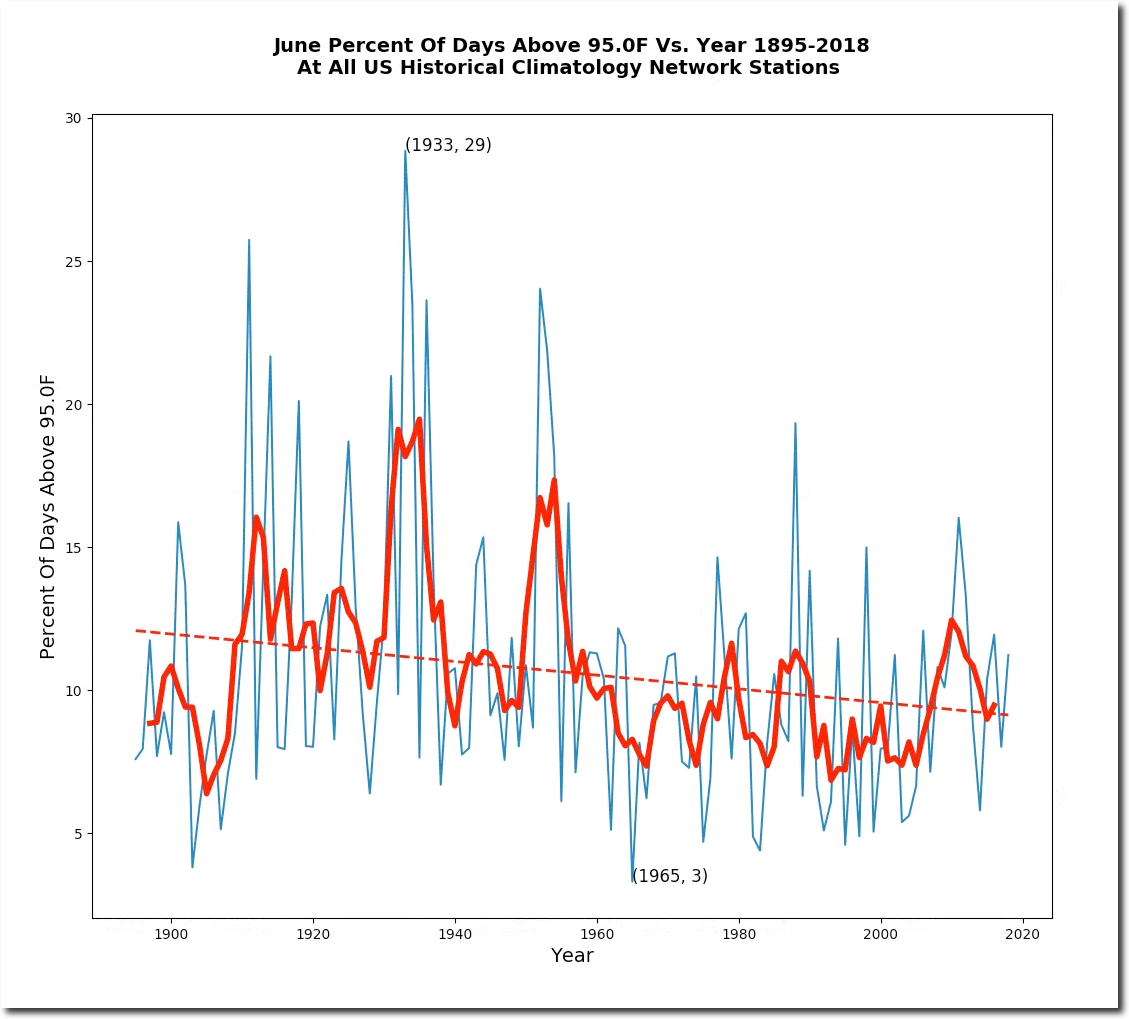
The percent of days above 35C (95F) was 46th highest. Pretty close to average.
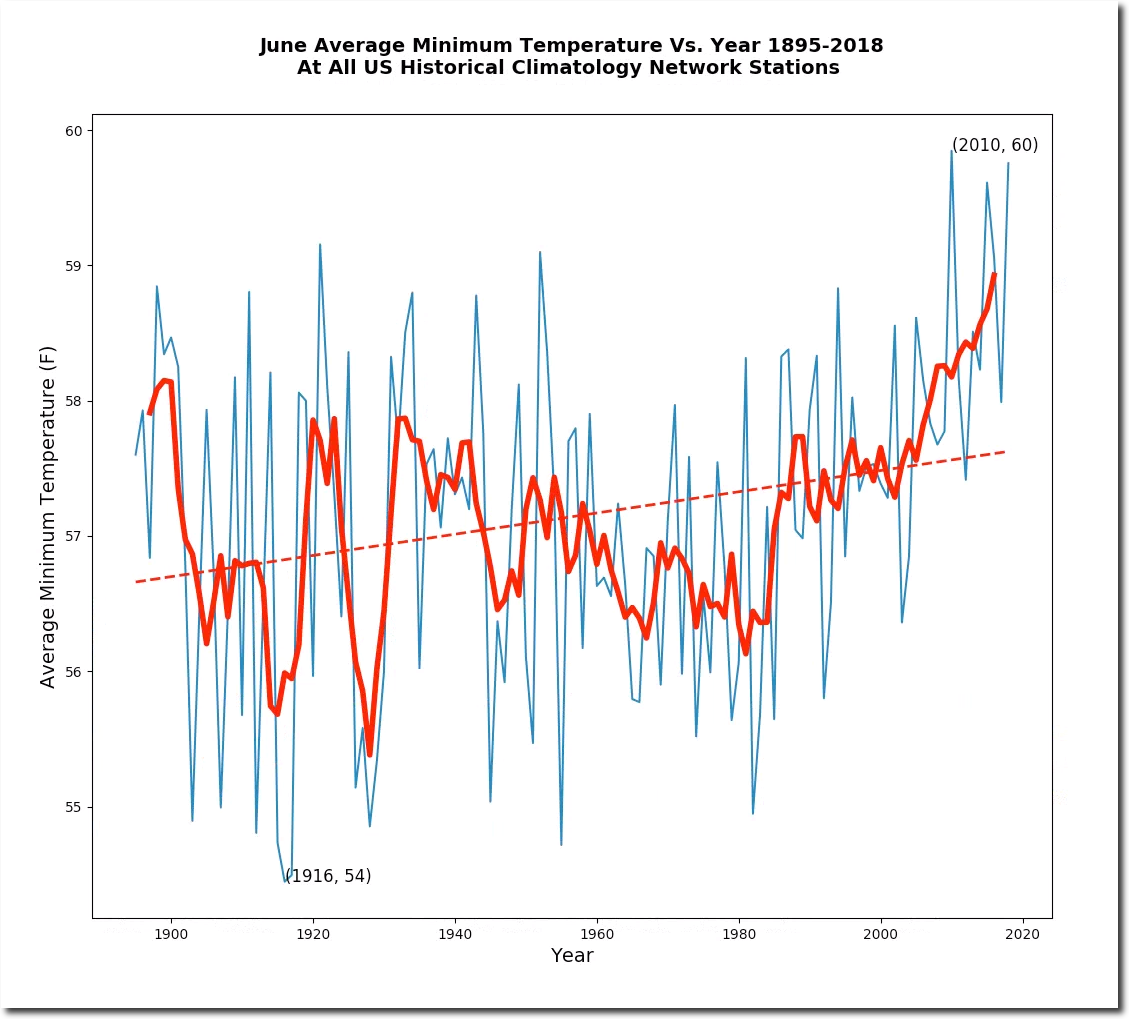
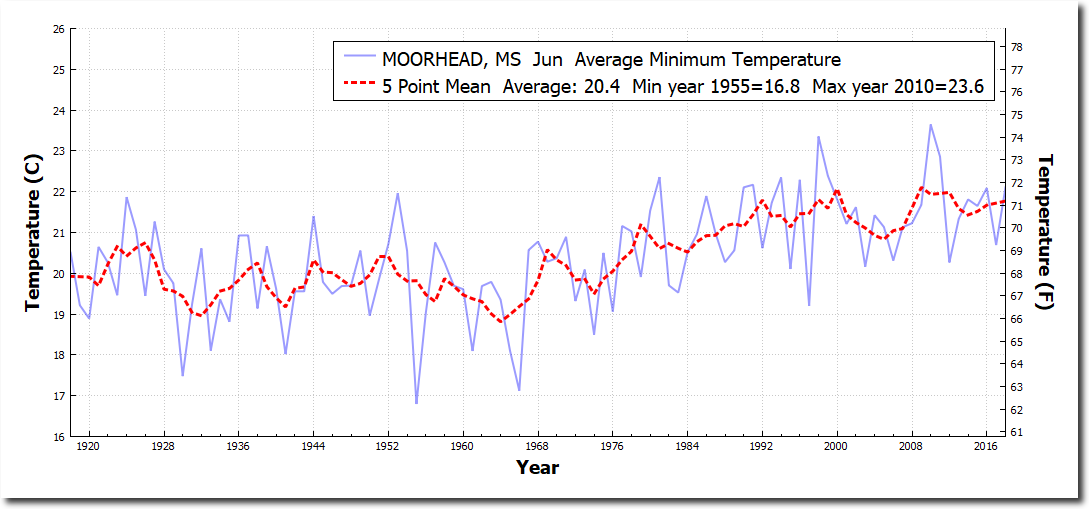
But minimum temperatures (which have been going up rapidly since the year 2000) were second warmest.
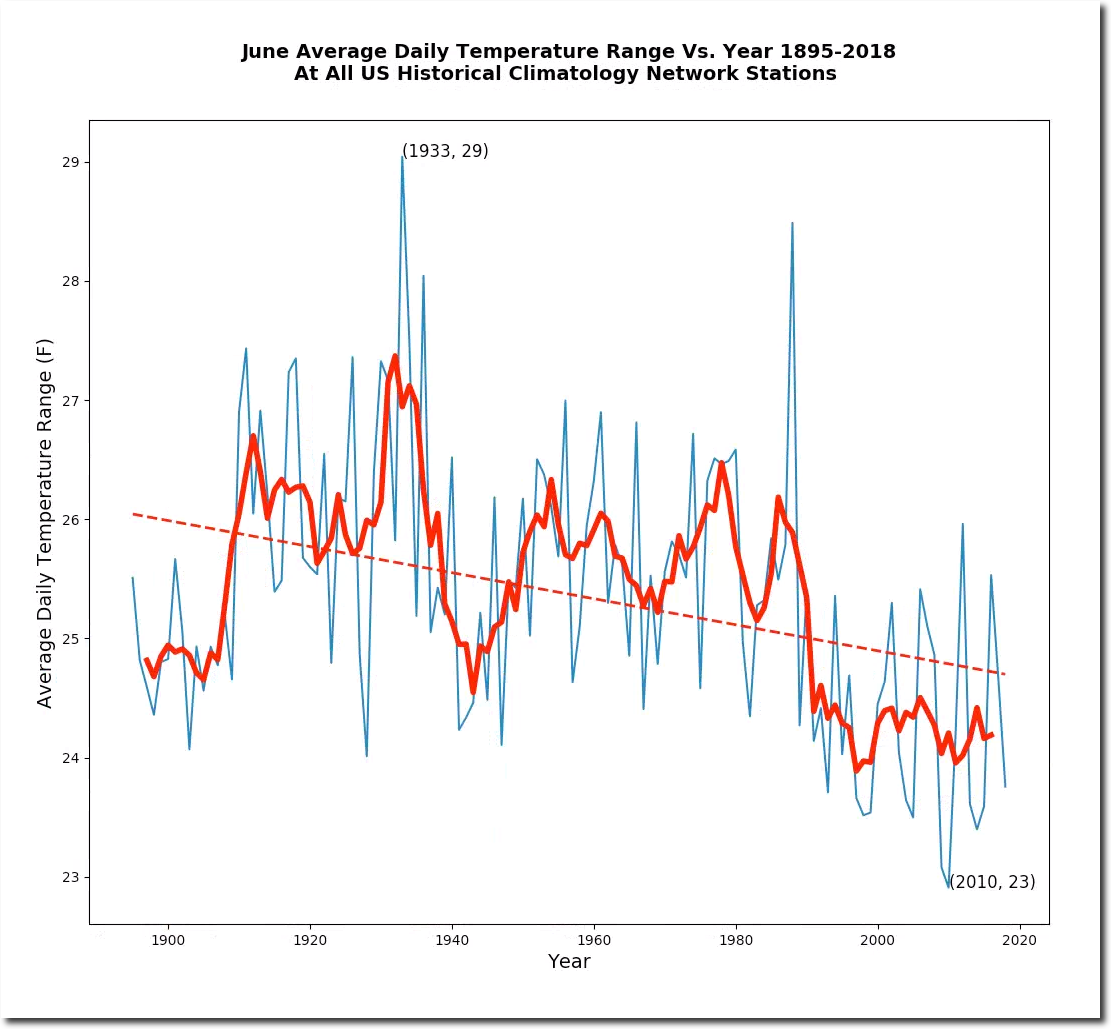
The average daily temperature range plummeted to record lows around the year 1990, and has remained there.
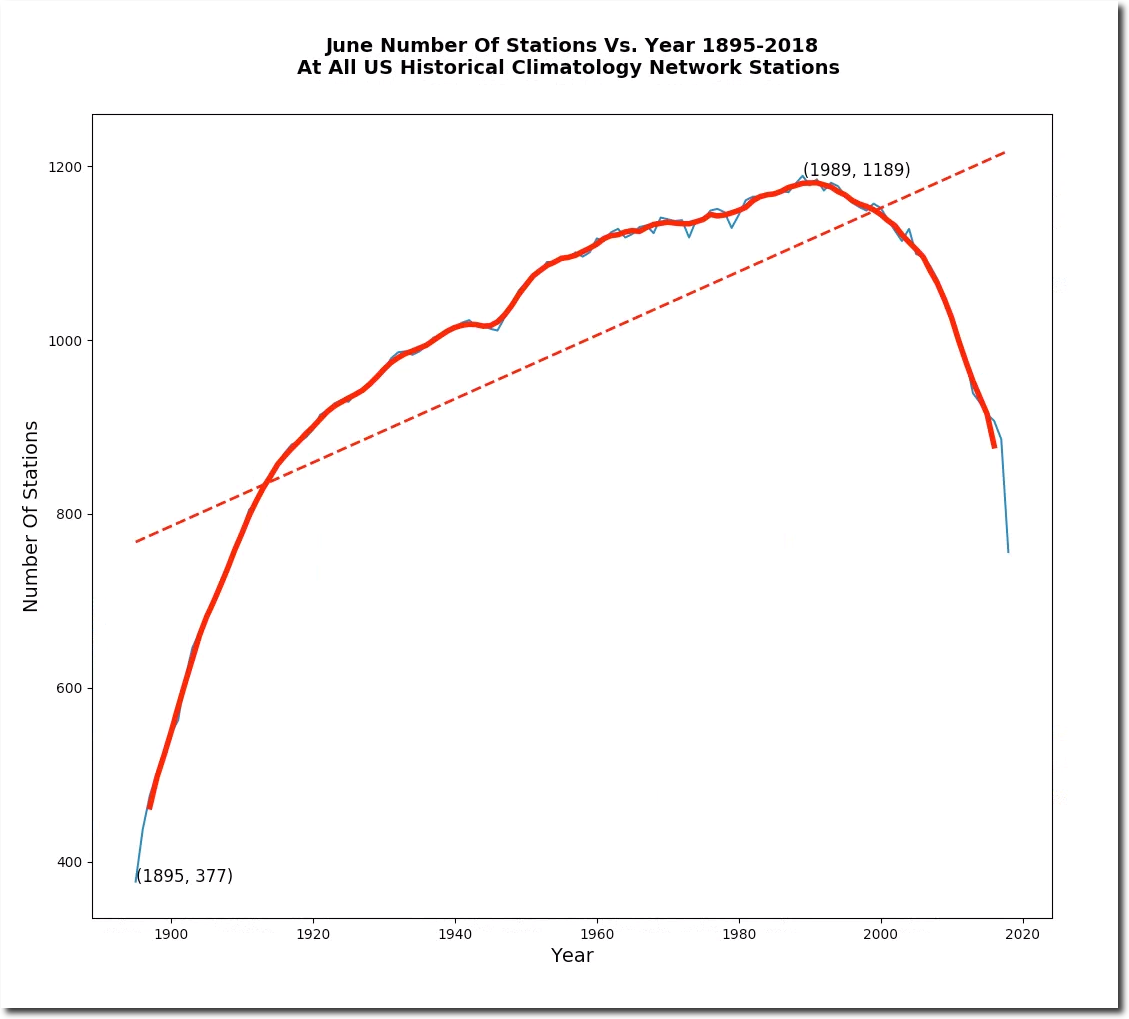
So what is causing minimum temperatures to go up since the year 2000? I don’t know, but since the year 2000, NOAA has lost almost a third of their June station data.
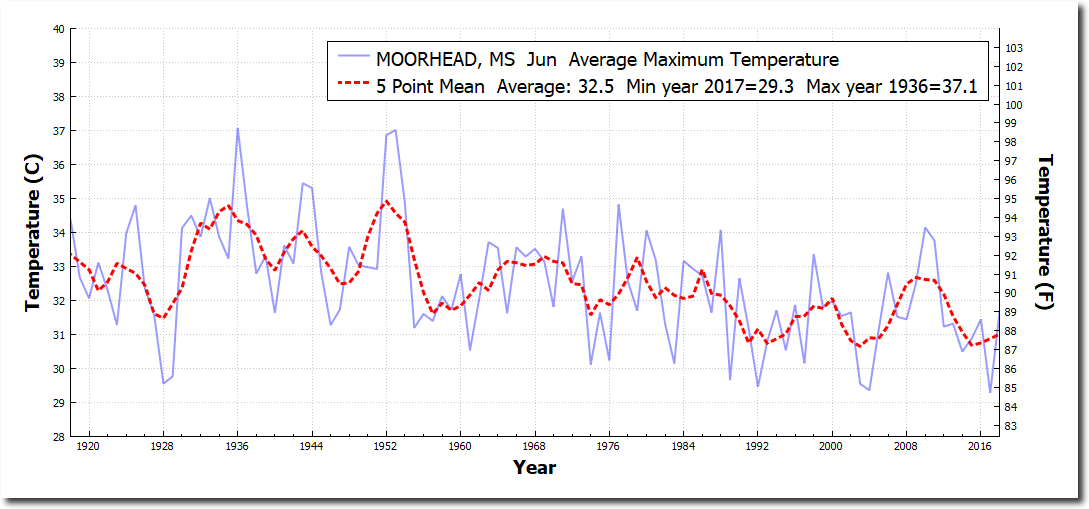
Moorhead, Mississippi is a good example of a station which is showing cooler June afternoons and warmer June nights.
I’ve been using a Nikon P900 for the past two years, and as CO2 has increased so have focal lengths. The P1000 was just announced and comes out in September.


