Sea ice extent is normal at both poles.
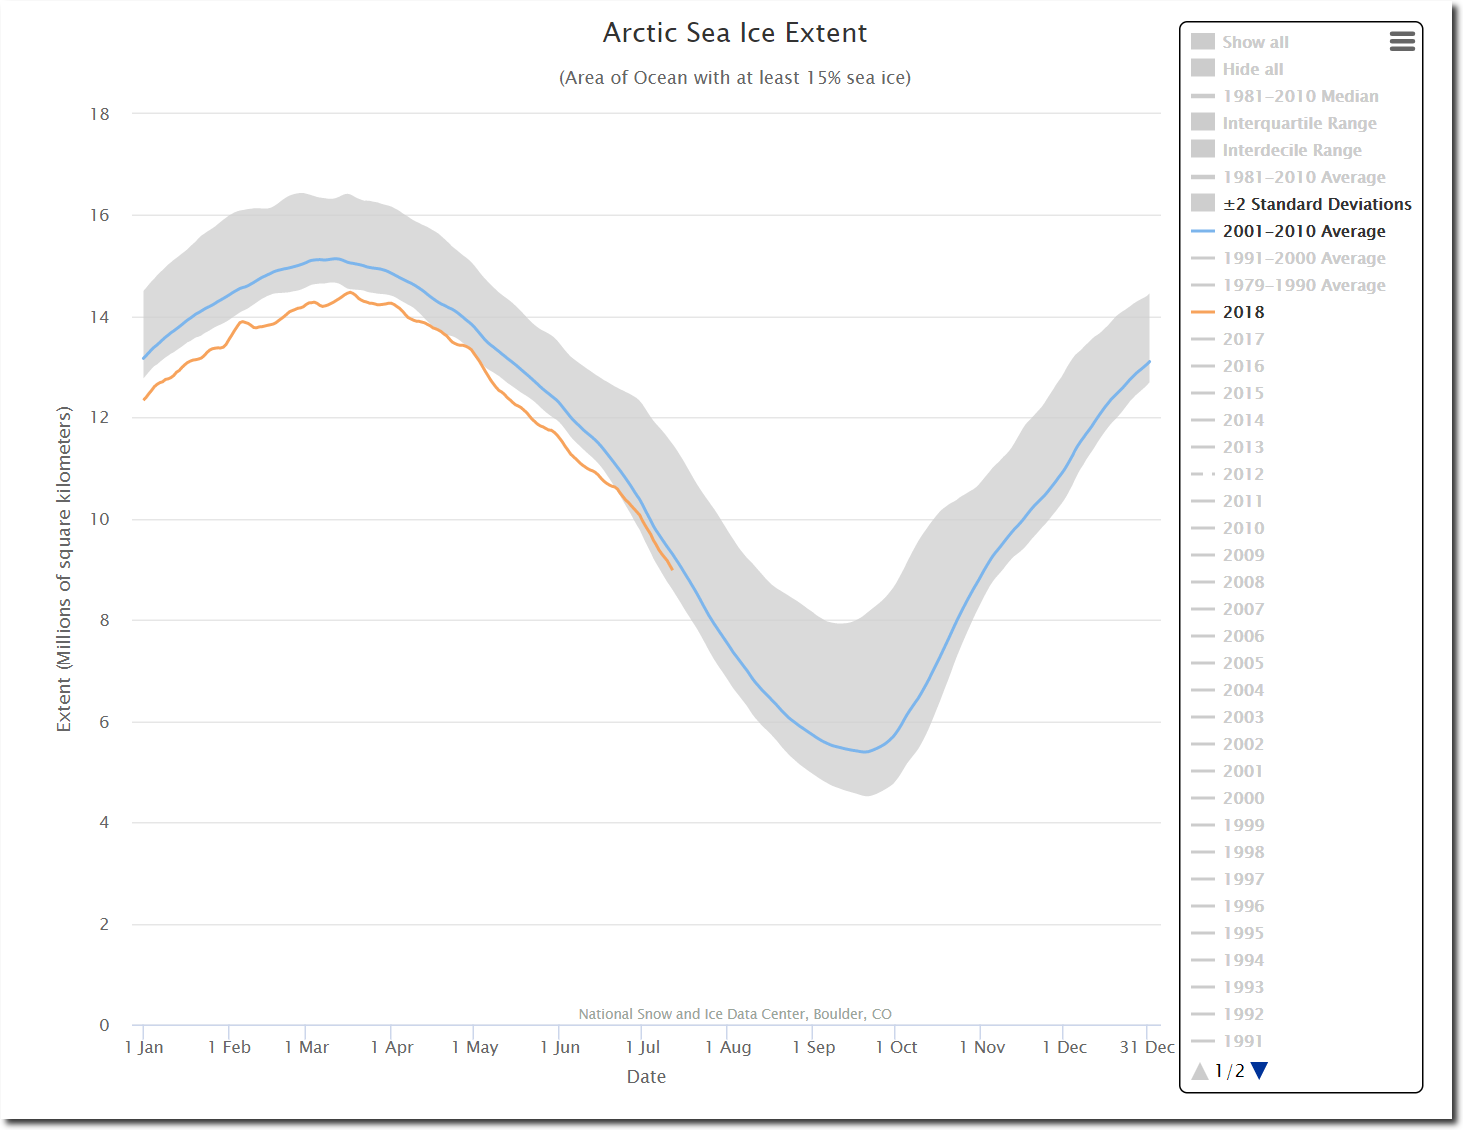
Charctic Interactive Sea Ice Graph | Arctic Sea Ice News and Analysis
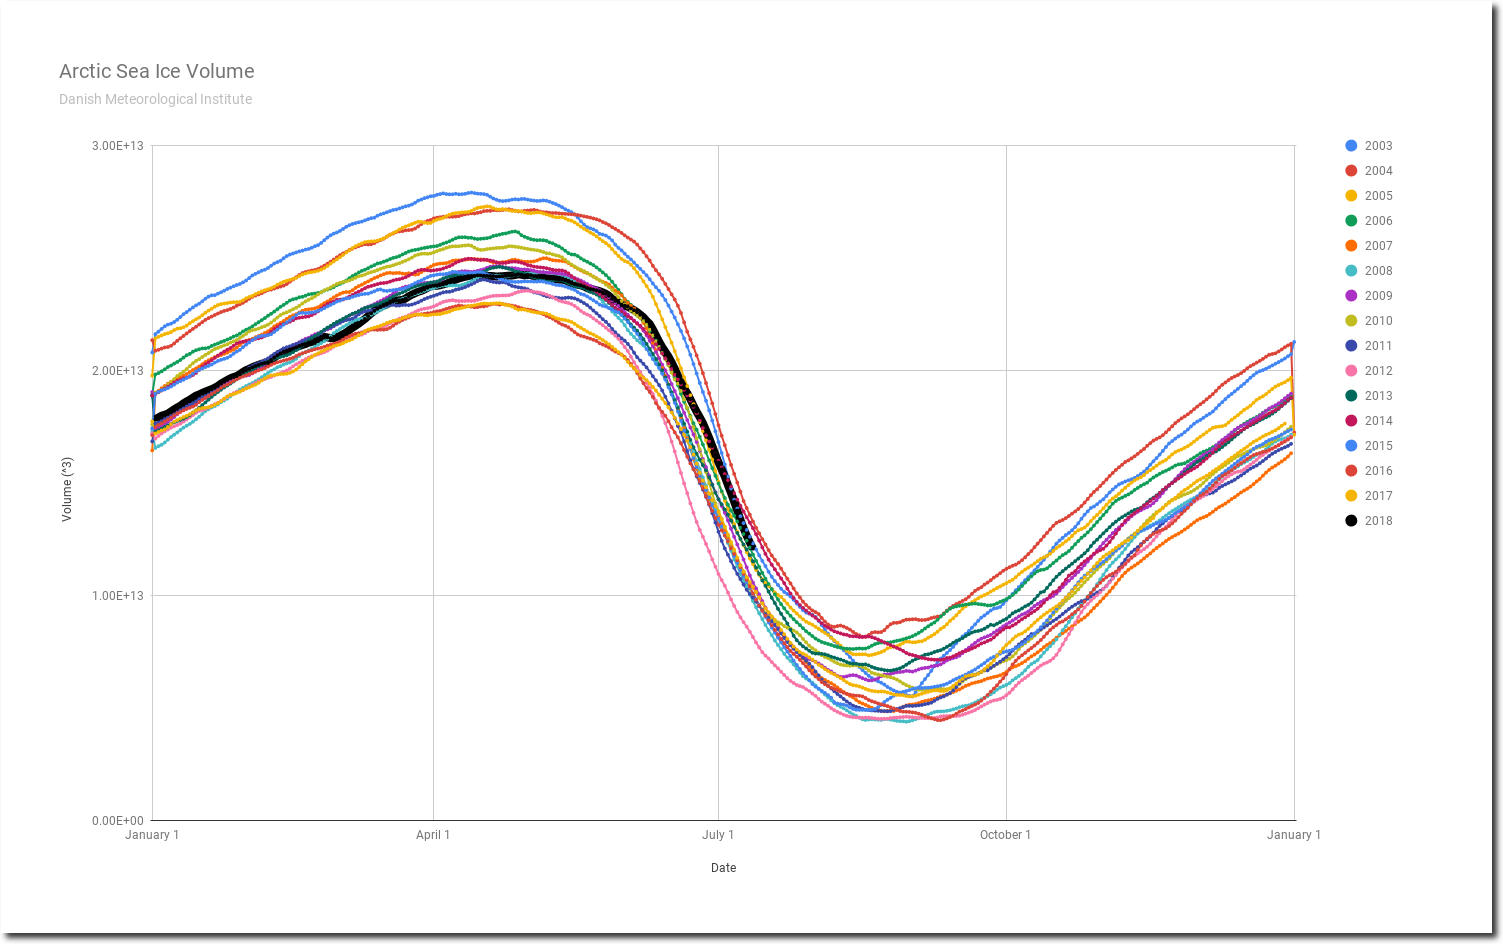
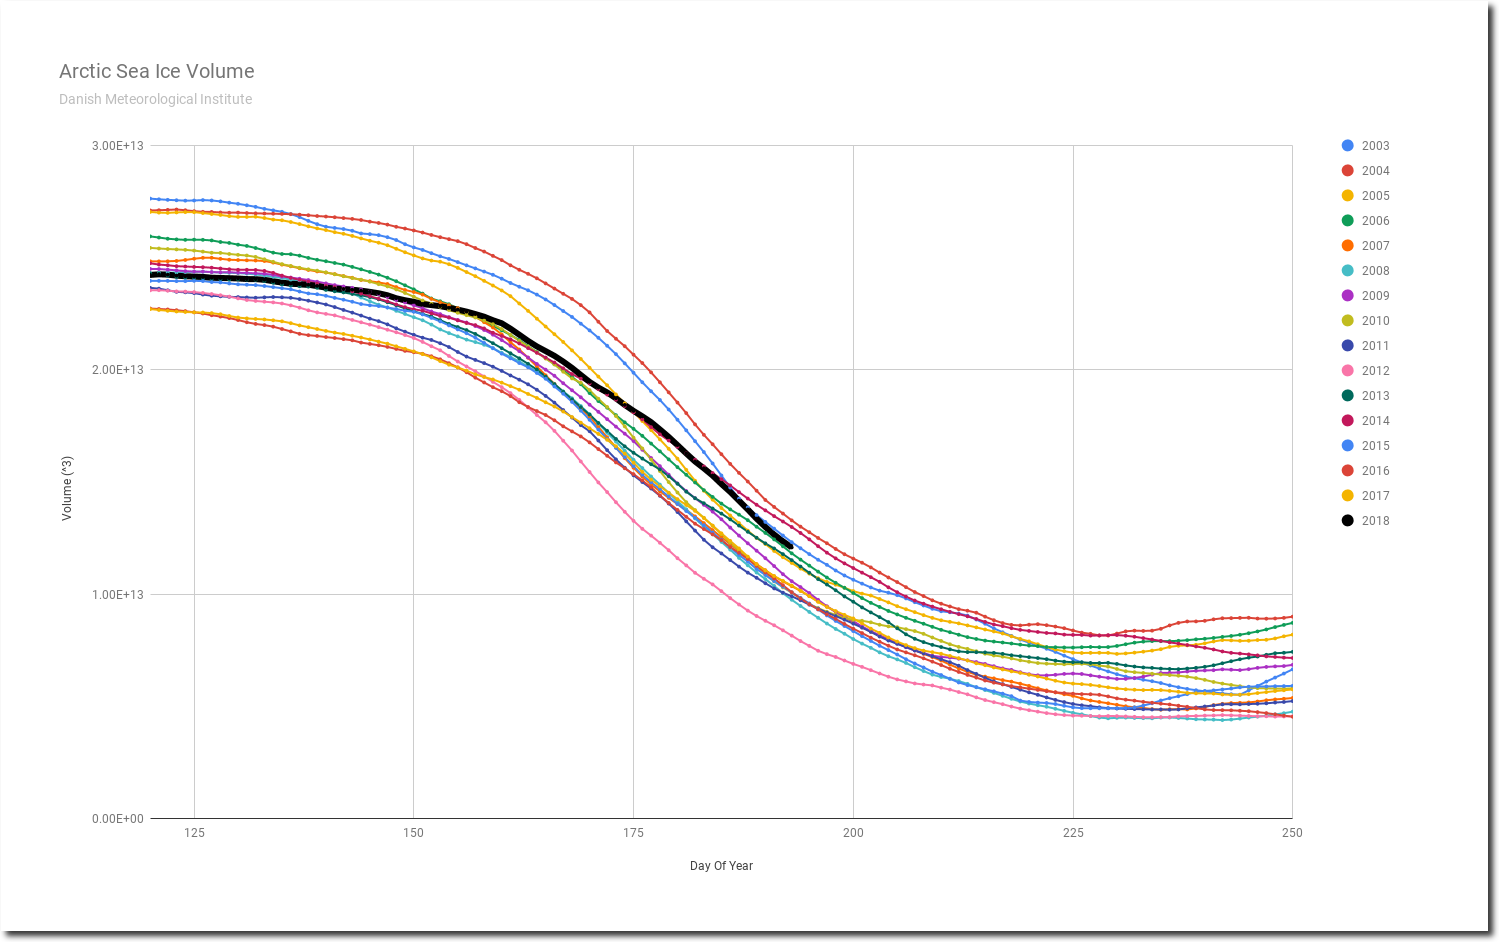
Arctic sea ice volume is fourth highest since 2003, with the melt season quickly winding down.
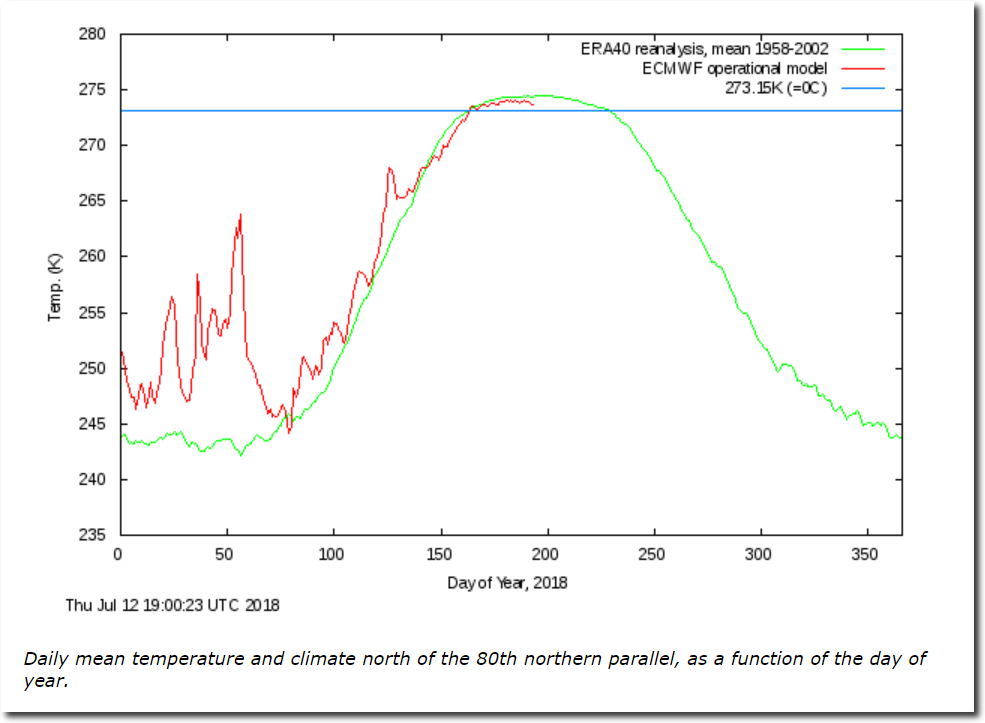
Temperatures near the North pole are well below normal and have been all summer.
Ocean and Ice Services | Danmarks Meteorologiske Institut
Sea surface temperatures around both the Antarctic and Greenland ice sheets are below normal.
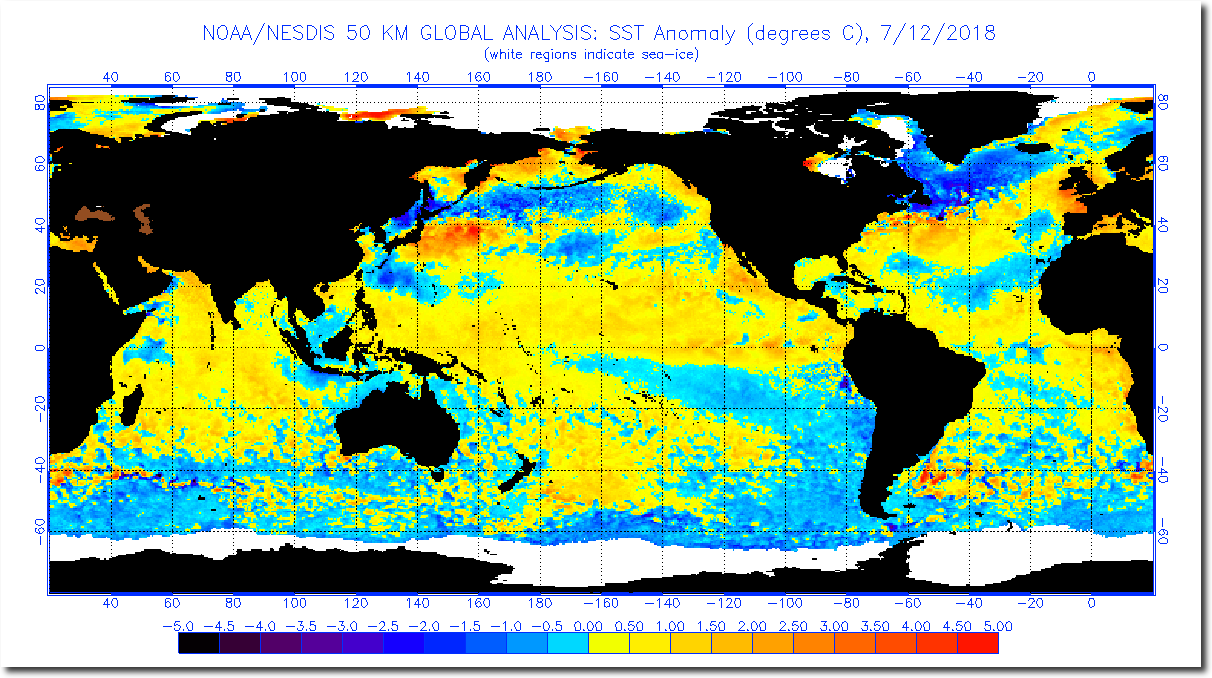
anomnight.7.12.2018.gif (1174×640)
Greenland’s surface has gained a near record amount of ice for the second straight year.
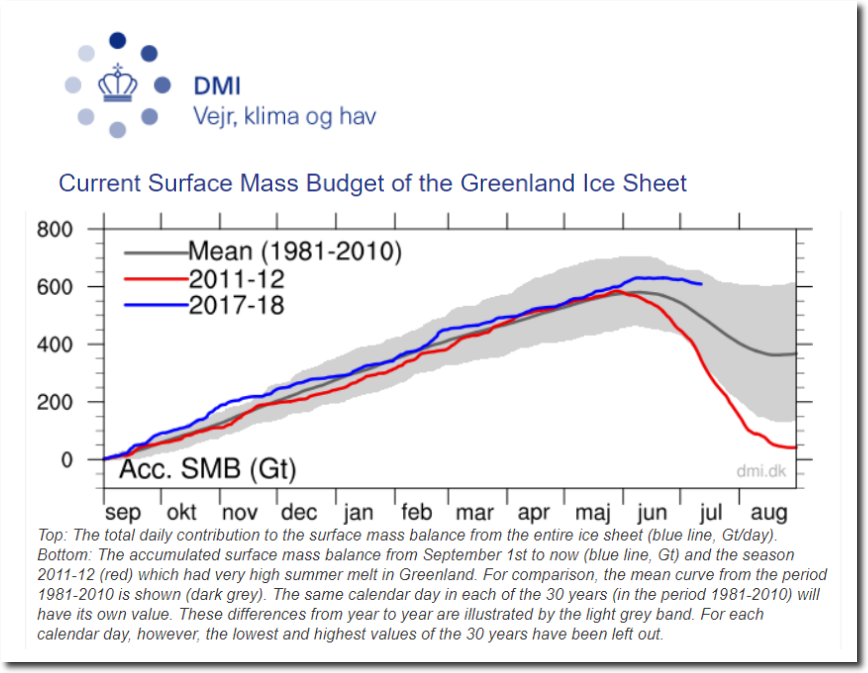
Greenland Ice Sheet Surface Mass Budget: DMI
Both the Antarctic and Greenland ice sheets are gaining ice.
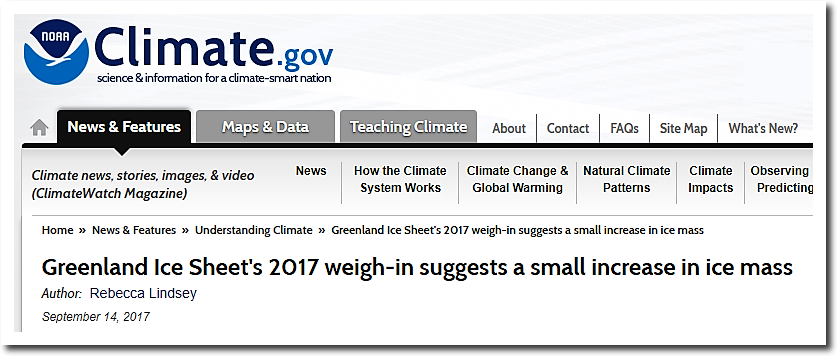
Greenland Ice Sheet’s 2017 weigh-in suggests a small increase in ice mass | NOAA Climate.gov
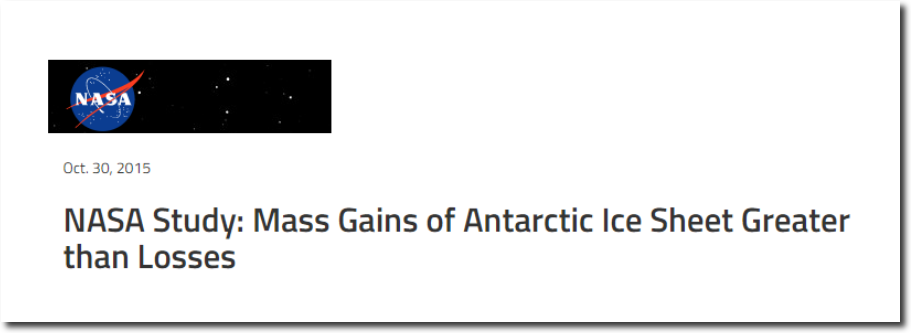
NASA Study: Mass Gains of Antarctic Ice Sheet Greater than Losses | NASA
Both the Northern Sea Route and Northwest Passage are blocked by thick ice.
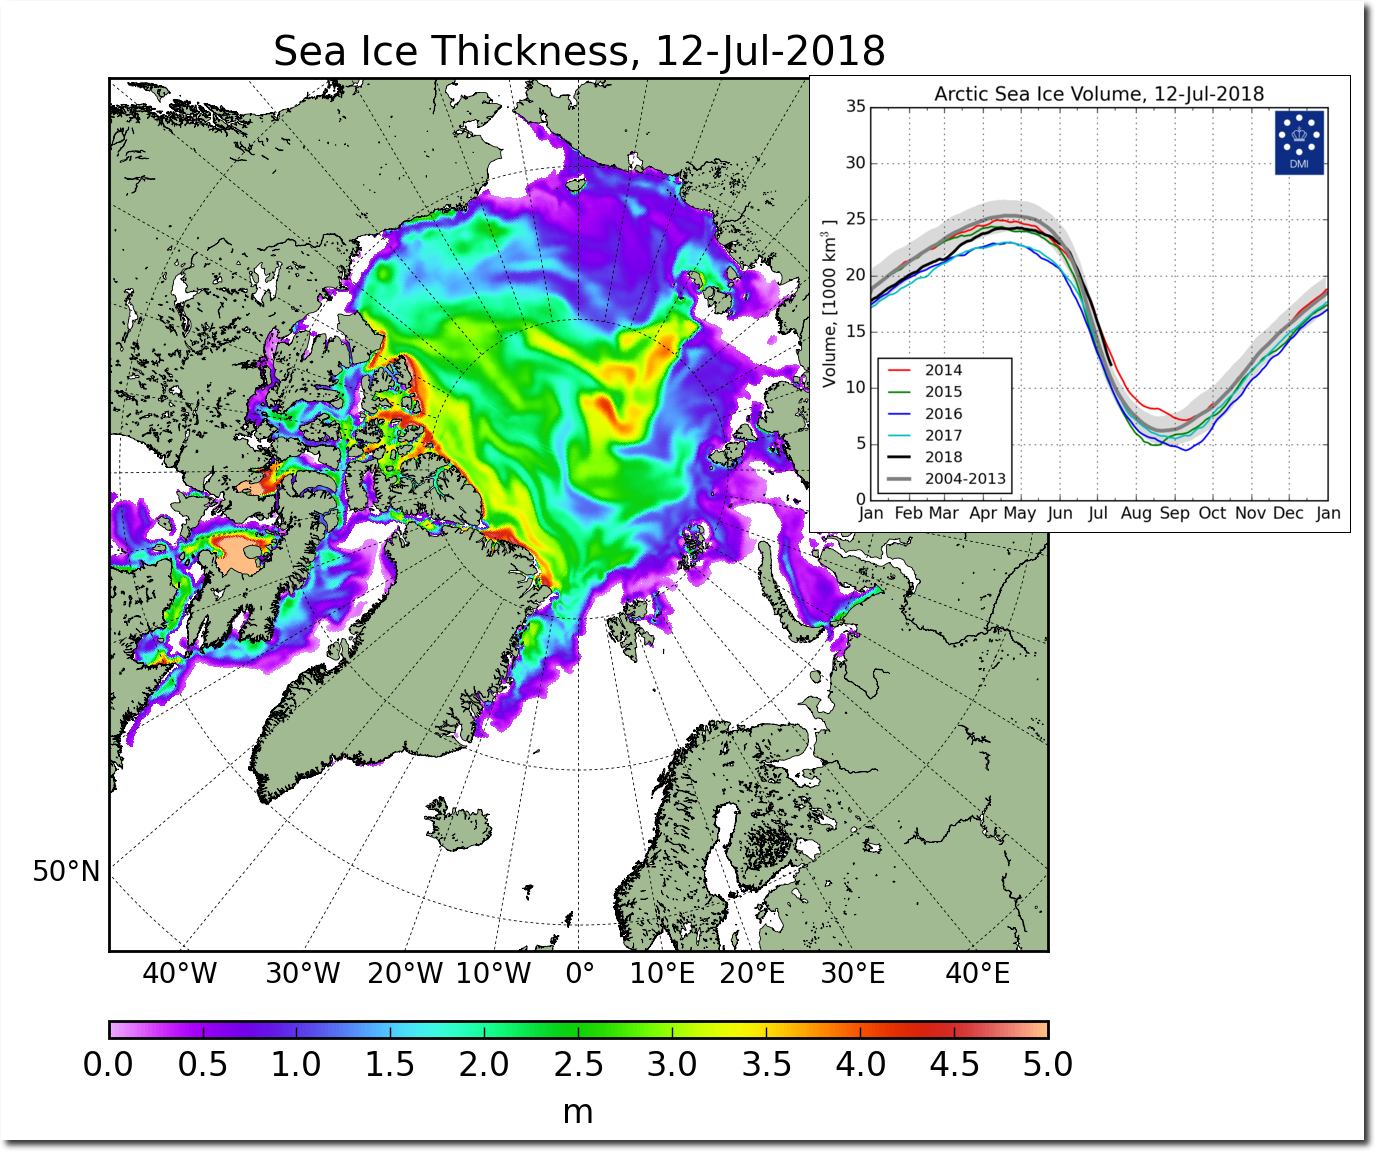
FullSize_CICE_combine_thick_SM_EN_20180712.png (1337×1113)
All of the Democrats leading prophets have failed.
The Argus-Press – Google News Archive Search
Gore: Polar ice cap may disappear by summer 2014
The polar melting scam has completely collapsed and predictions failed. Climate scientists, Democrats and the press have reacted quite predictably – by simply ramping up their lies, like they do about everything else.
The usual nonsense
The sea ice volume and extent is massively lower than any pre-2000 date and some post 2010 dates. The NW passage and NSR route would not normally be open yet.
The temp is not massively lower… it is pretty much tracking the mean, after being substantiall higher than the mean earlier in the year.
the sea ice is still in decline: this year is neither a reversal or refutation of that.
Griff does his Monty Python impression … my sea ice alarmism isn’t dead … its just pining for the fiords.
https://www.youtube.com/watch?v=4vuW6tQ0218
There is currently more ice in the Arctic than the average of the past 9000 years.
Why do you hate poor brown people?
Massively lower than the cherry picked 1979 high, the highest level since the Little Ice age, but not massively lower than 1969, 1959, 1949 or 1939. Your entire sea ice scam is based on the most obvious cherry pick in the history of science. That is like saying that US Midwest summer heat is massively lower than it was in 1936, if you want to make a comparably stupid and dishonest cherry pick.
No scientist worth his salt would ever start their charts at a record high or record low level, but that is exactly what the alarmists have done. They are always out to “prove” a predetermined result, rather than practicing science.
Well-Griffs logic is like someone who waits until you start running a marathon to meet you for the very first time.
Than she”ll be waiting at the finish line for you
just to tell people after the meeting that you are a smelly sweaty guy.
She will ignore the other 364 days of the year because they do not fit her agenda.
“My ice cube was supposed to be gone four years ago and is currently melting at a record rate, but is larger than it has been in twelve of the last fifteen years”
Griff
Enjoying your cruise down de-Nile?
Please give us some evidence.
You really don’t have to announce what you are going to say (the usual nonsense).
Ms Griff is getting sloppy and she’s having problems expressing herself but a simple colon would have clarified her contribution.
The usual nonsense:
The sea ice volume and extent is massively lower than any pre-2000 date …
Griff, Did you even look at the graphs, madam? I though you believed in scientific evidence. I am so disappointed.
STILL griff ignore the fact that Arctic sea ice is in the top 10% of the last 10,000 years
You are a true CLIMATE CHANGE DENIER, griff.
Griff,
That is what the RUSSIAN GOVERNMENT says, with the longest Arctic Coastline, CAGW is nothing but NONSENSE:
Take a look at the power point below, last half deals with the science or lack there of. of AGW:
http://iccfglobal.org/ppt/Illarionov-013004.html.ppt
Source: http://iccfglobal.org/research/climate/russias-chief.html
Some DMI Sea Ice volume numbers for July 12:
Daily decline rate decreased to -275, 18 above average for the day, but now less than 2003 and 2004, so the gap with 2003 has narrowed a little and is now 235.
Volume is now 111.15% of the 16-year average (upper edge of the 1st std deviation) , and 113.34% of the DMI-charted 10-year period (lower end of the 2nd std deviation.)
Interesting!
Stay tuned.
Tony
“Chartic Sea Ice Interactive”
Outstanding service and I’ve bookmarked it.
Having been in investment research for 50 years, I’m an old hand at charting.
Back in the day, we used K&E graph paper, letter size, in six-month spans. And one of the lines was:
“Hey–the stock market can’t go any lower!”
“Why?”
“It’s at the bottom of my graph!”
Hansen as the spokesperson of God: “…and many false prophets will appear and deceive many people…”
To which I might add …
My favorite…
http://www.theamericanconservative.com/dreher/that-stupid-coexist-slogan/
Twain’s “The Lowest Animal” has a pertinent summary ending.
Yeah, I’m a Twain fan, but he was no a theologian. The fact that he could recognize the enormous differences between Christianity and Islam speaks volumes on his ignorance of the subjects.
“The fact that he could not recognize the differences…
Not sure where not went…
and another…
http://i63.tinypic.com/5fq6ft.jpg
a real good one
I’d recommend reading “islamic djihad” from Khan(ex muslim)
about what they have done in india.
It’ll heal anyone from “religion of peace”BS
As I posted yesterday, no real changes in the weather pattern coming up. Low pressure dominates the arctic region, which will keep it cloudy, and cooler. Current low is weakening, so basically just mellow weather for a few days.
By later in the week, a new, stronger low pressure is forecast to develop. This pattern is forecast to continue for the rest of the month.
And, yes, Greenland will continue to see rounds of snow, keeping SMB fairly stable.
Perhaps this excellent and well researched information needs to be sent to the state broadcasting propaganda arm of socialist realist Canada because according to it the Artic is just disappearing: https://podcast-a.akamaihd.net/mp3/podcasts/quirksaio-fgUGzdHH-20180706.mp3
Interesting trend in the mean polar air temperature graph from DMI. Very close to going below freezing, which certainly should blunt the ice melting rates in the near term. Something to watch…
Greenpeace Refuses to Disavow Fossil Fuels
The alarmists will just start talking about something else. There is always some weather somewhere they can point to and hype as the harbinger of mankind’s climate doom. If not a Siberian hot spot then it may be a typhoon. All indications are it will be a very active typhoon season in the western Pacific.
Then there is the excuse making aspect to keep them busy. Explaining why what they have projected has not happened in a way so as to try and keep the scam and fear going. Still plenty of work out there for the unethical.