
Disrupting the Borg is expensive and time consuming!

Google Search
-
Recent Posts
- The Real Hockey Stick Graph
- Analyzing The Western Water Crisis
- Gaslighting 1924
- “Why Do You Resist?”
- Climate Attribution Model
- Fact Checking NASA
- Fact Checking Grok
- Fact Checking The New York Times
- New Visitech Features
- Ice-Free Arctic By 2014
- Debt-Free US Treasury Forecast
- Analyzing Big City Crime (Part 2)
- Analyzing Big City Crime
- UK Migration Caused By Global Warming
- Climate Attribution In Greece
- “Brown: ’50 days to save world'”
- The Catastrophic Influence of Bovine Methane Emissions on Extraterrestrial Climate Patterns
- Posting On X
- Seventeen Years Of Fun
- The Importance Of Good Tools
- Temperature Shifts At Blue Hill, MA
- CO2²
- Time Of Observation Bias
- Climate Scamming For Profit
- Climate Scamming For Profit
April 2026 M T W T F S S 1 2 3 4 5 6 7 8 9 10 11 12 13 14 15 16 17 18 19 20 21 22 23 24 25 26 27 28 29 30 Recent Comments
- arn on The Real Hockey Stick Graph
- Bob G on The Real Hockey Stick Graph
- Bob G on The Real Hockey Stick Graph
- Gordon Vigurs on The Real Hockey Stick Graph
- arn on The Real Hockey Stick Graph
- arn on The Real Hockey Stick Graph
- Gordon Vigurs on The Real Hockey Stick Graph
- Peter Carroll on The Real Hockey Stick Graph
- Robertvd on The Real Hockey Stick Graph
- Robertvd on The Real Hockey Stick Graph
How James Hansen And Michael Mann Destroyed Climate Science
Climate scientists used to understand that the sun controlled Earth’s climate – until Michael Mann and James Hansen destroyed the temperature record about 20 years ago.
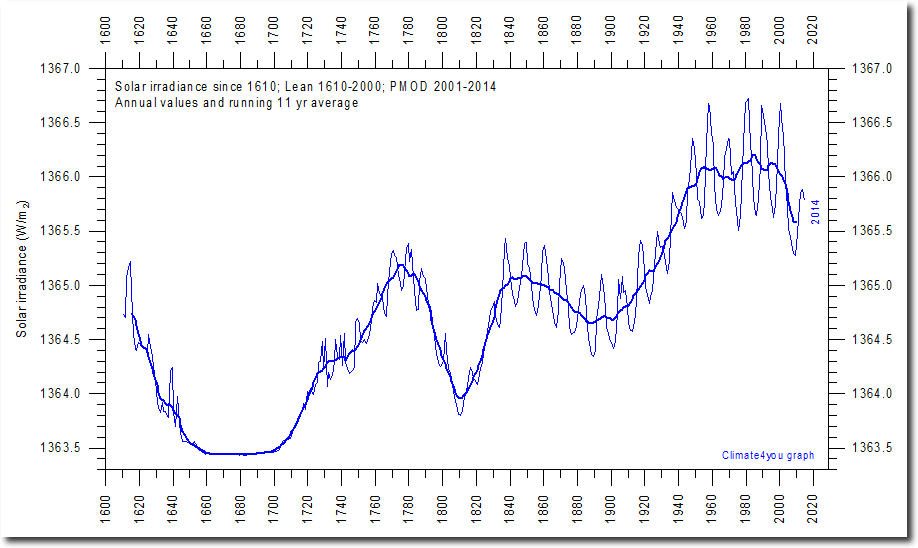
Total solar irradiance (TSI) has increased since the Little Ice Age.
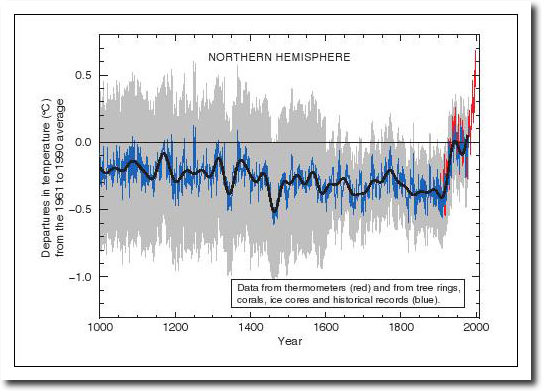
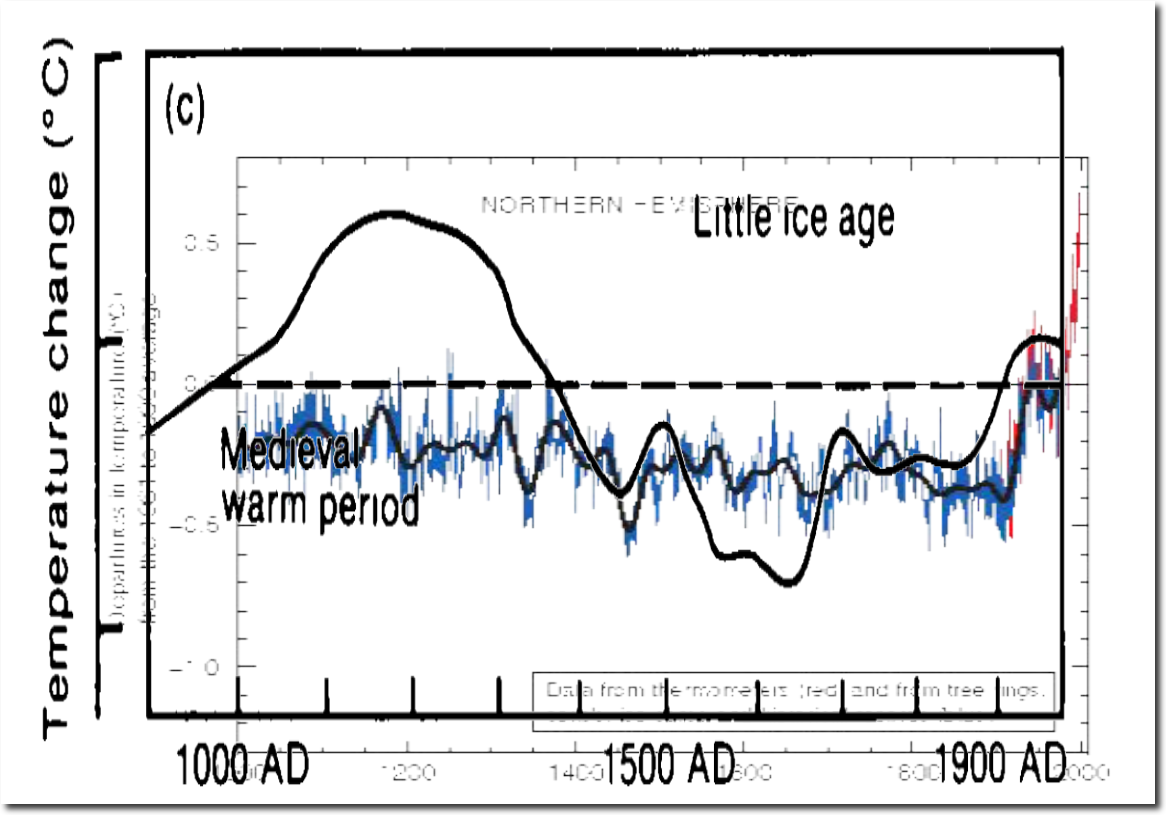
The graph below is from the 1990 IPCC report, and it shows temperatures were much warmer 900 years ago, and were much cooler 400 years ago during the Little Ice Age.
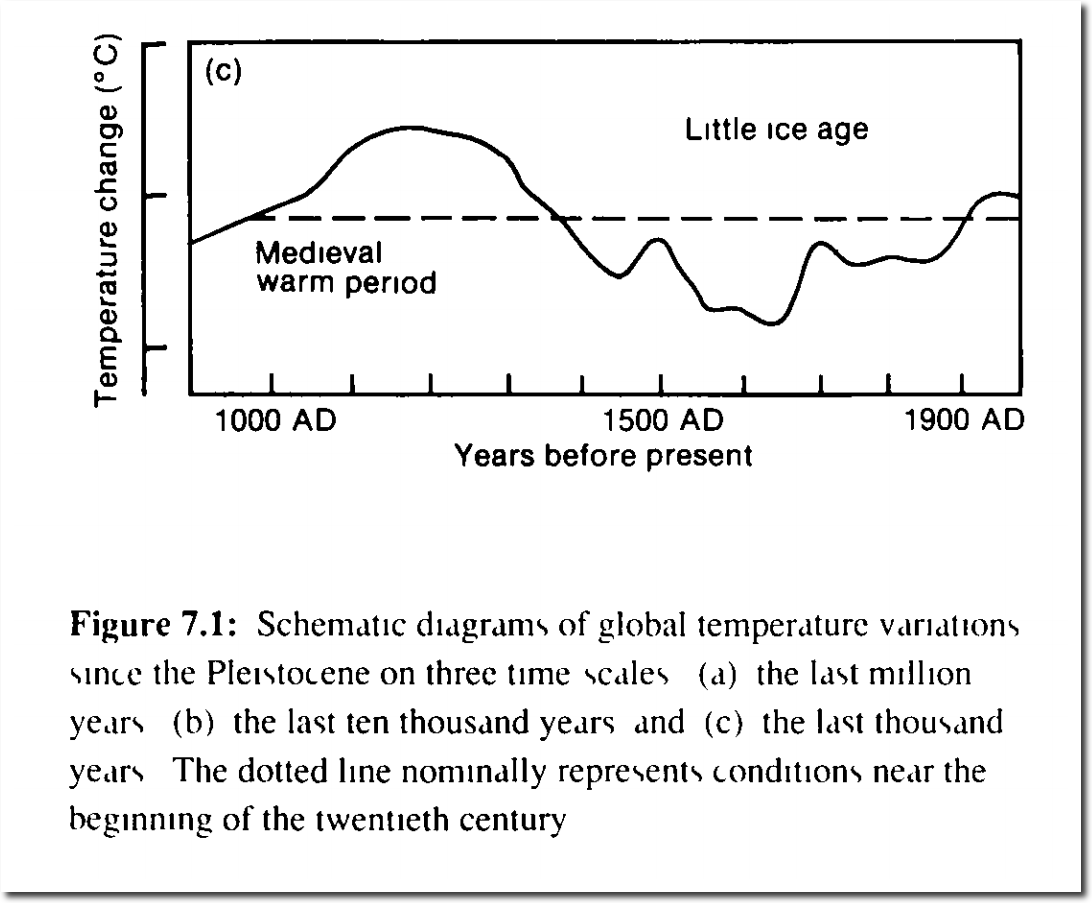
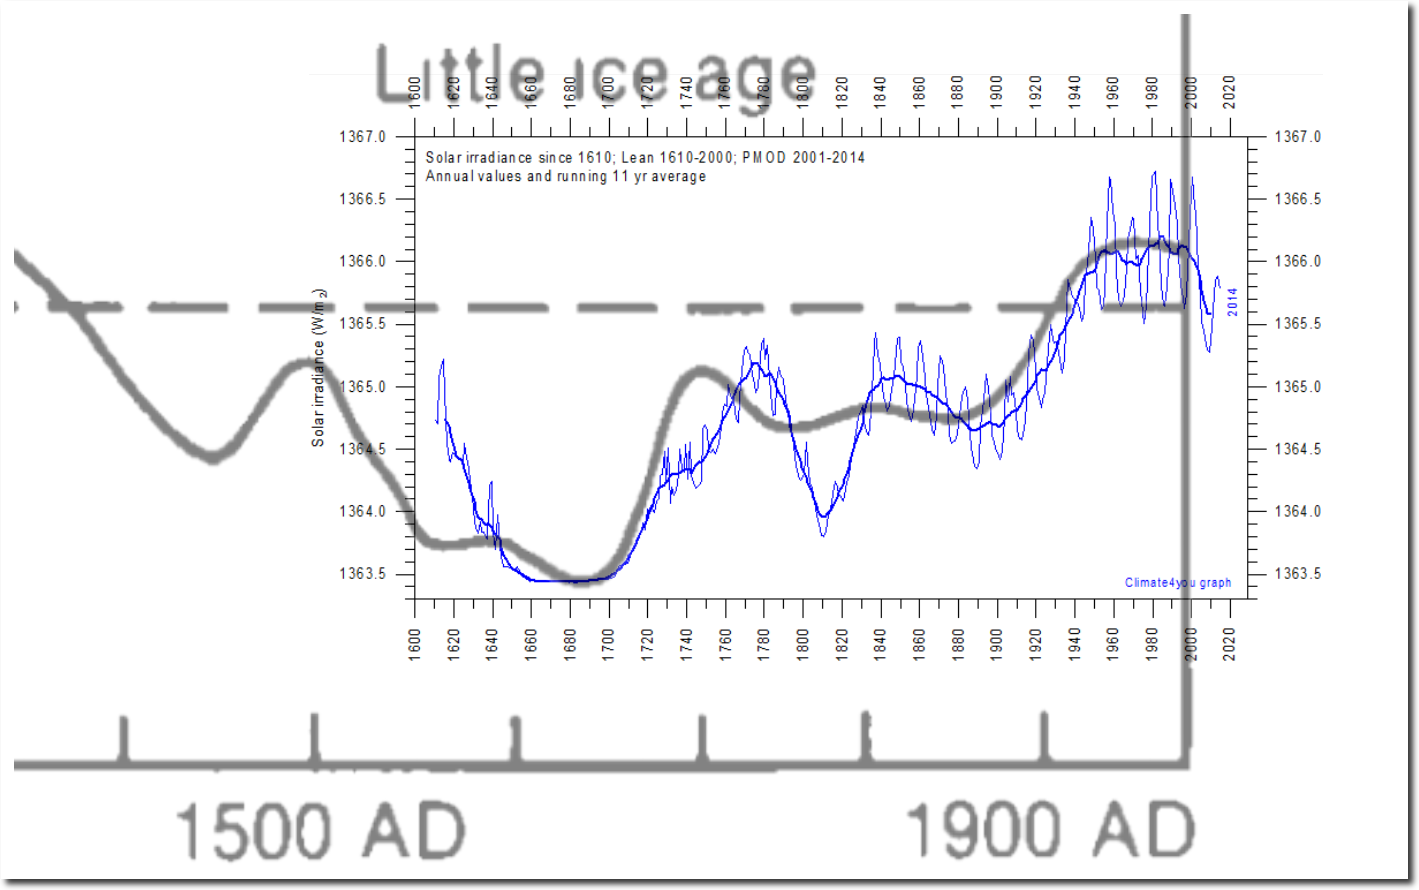
If we overlay the TSI graph and the 1990 IPCC graph, we see correlation between temperature and TSI.
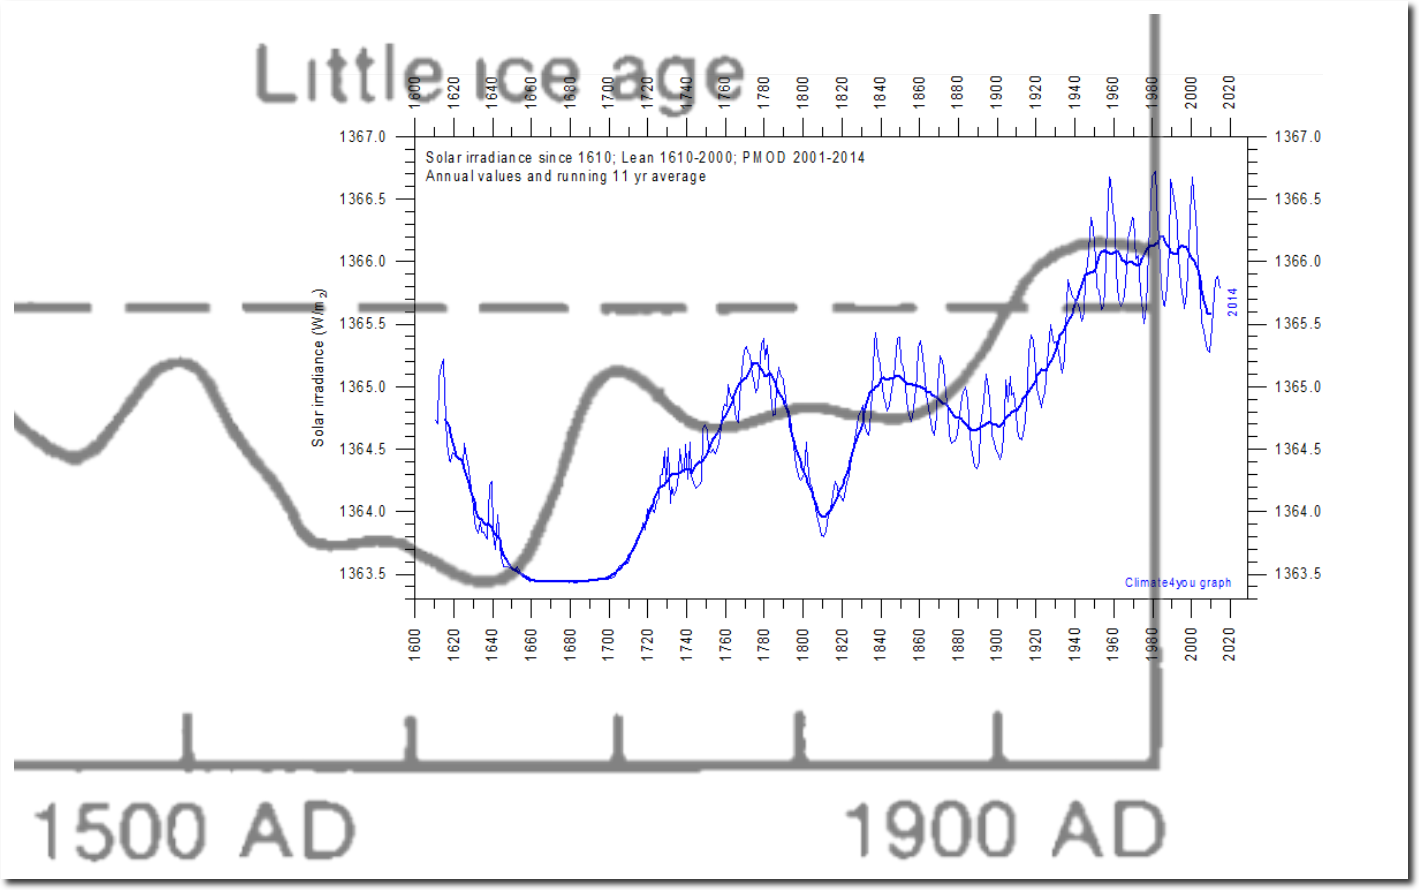
The 1990 IPCC graph is hand drawn and the X-axis is irregular. A small shift and scaling change lines up TSI and temperature almost perfectly.
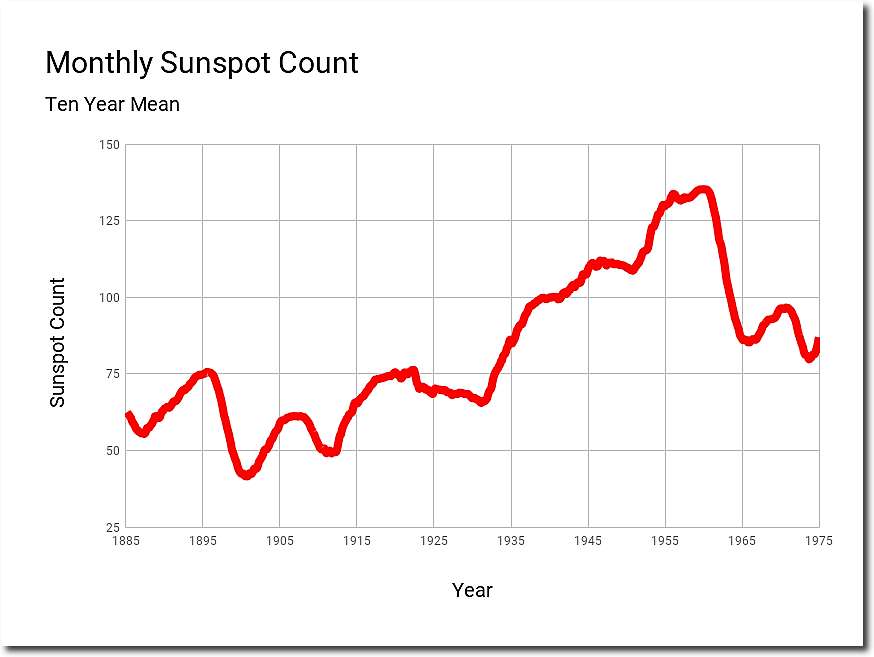
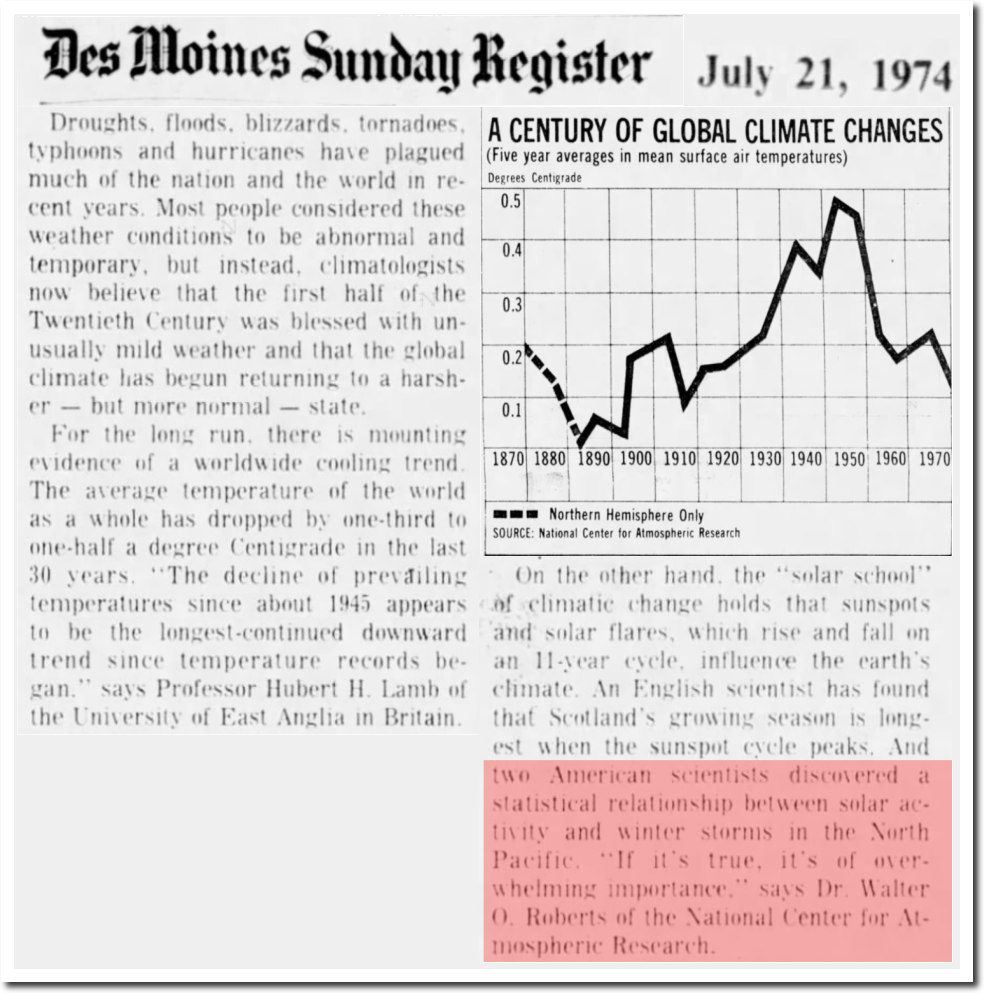
Similarly, we see a correlation between the 1974 NCAR global temperature graph and sunspots.
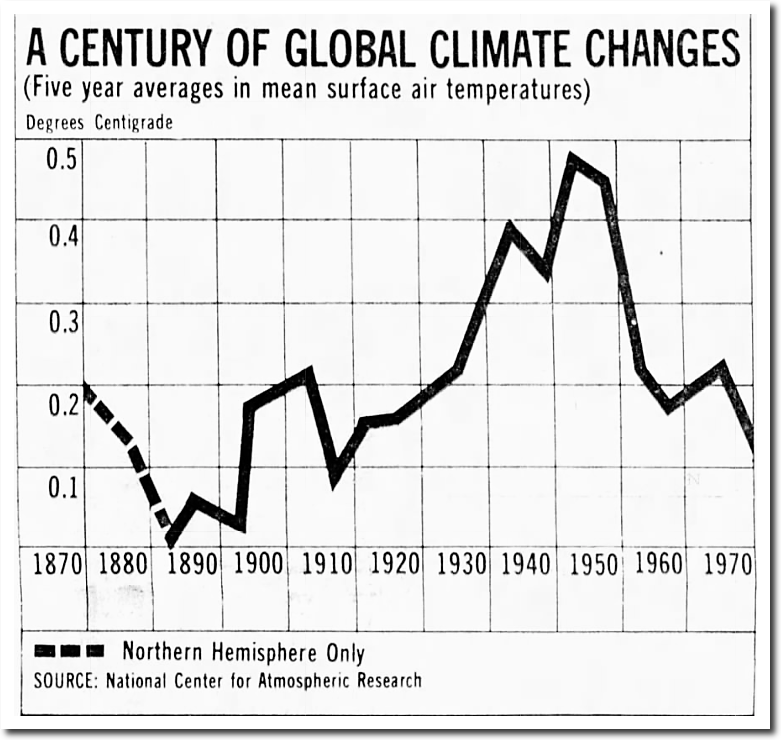
21 Jul 1974, 13 – The Des Moines Register at Newspapers.com
Wood for Trees: Interactive Graphs
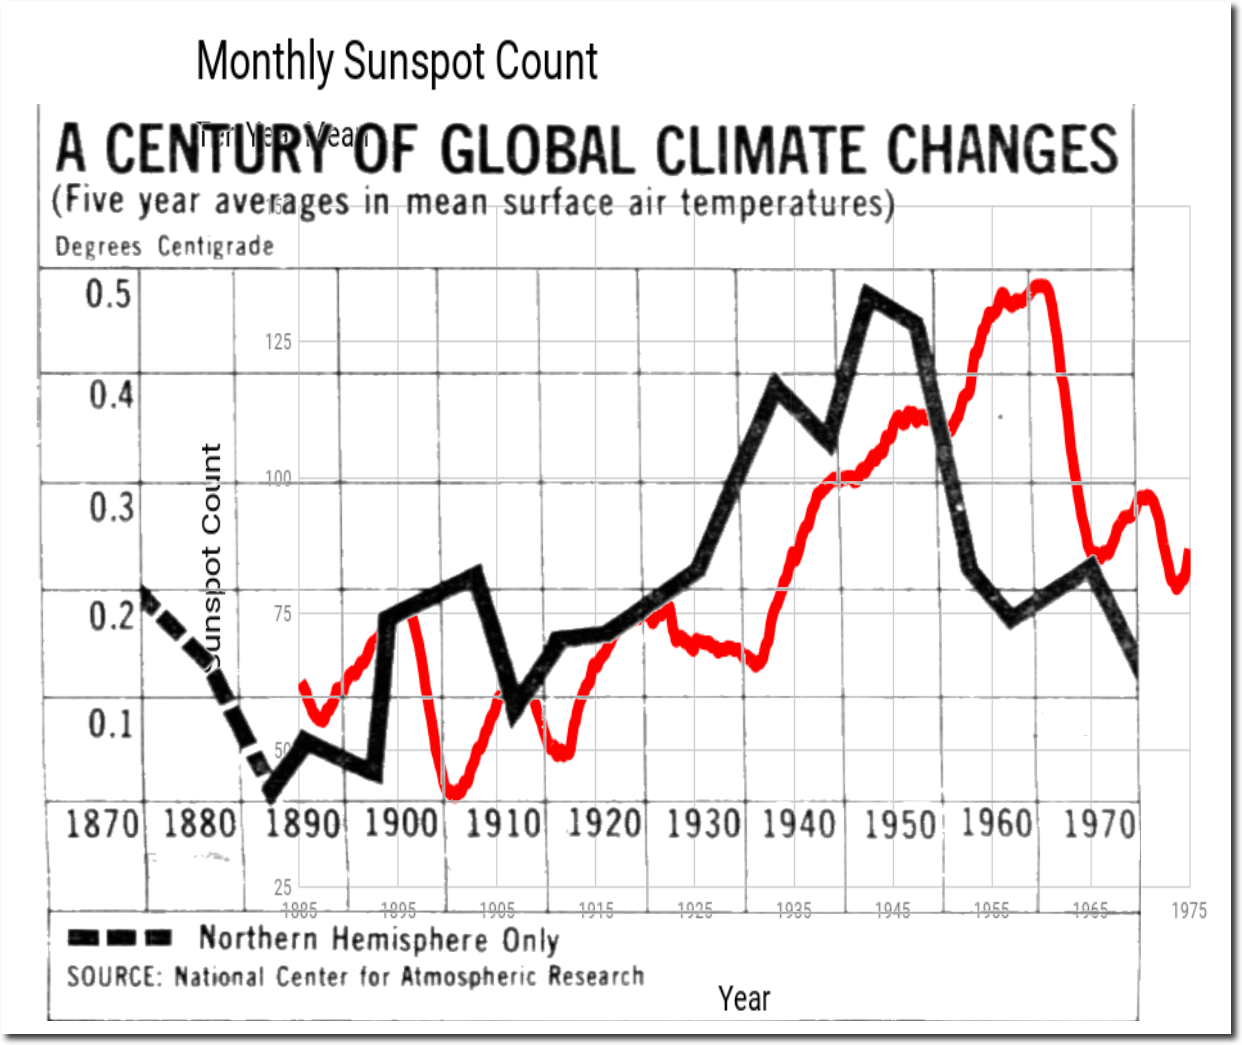
Again, a small shift of the hand drawn 1974 graph causes sunspots and temperature to line up very closely.

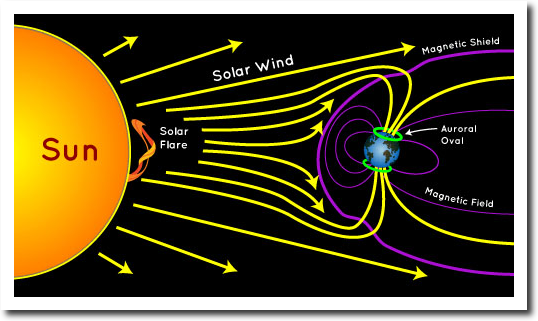
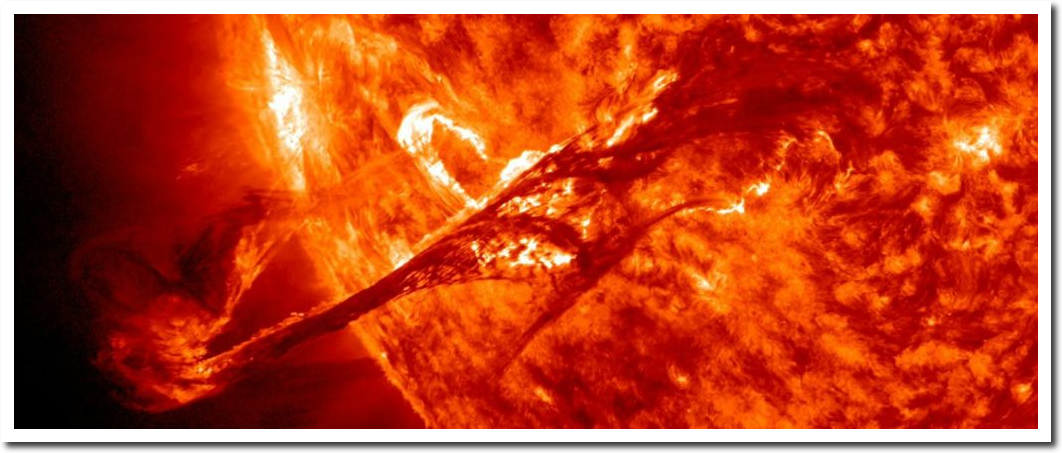
TSI and Sunspots are only part of the solar climate story. Comets have two tails because there are at least two distinct types of energy being emitted from the Sun – photons and ionized particles known as the Solar Wind.
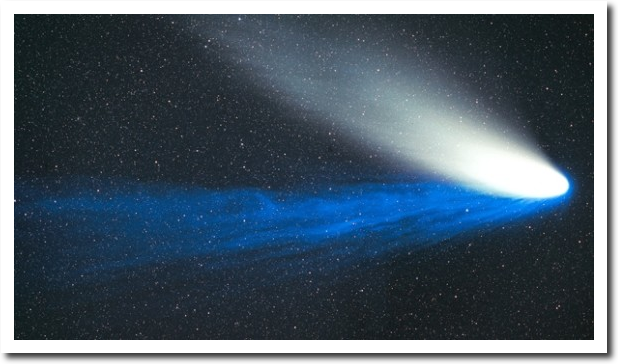
The Earth’s magnetic field protects us from the Solar Wind – directing the charged particles towards the poles where they release energy as the Northern and Southern lights. Without the magnetic field surrounding Earth, our planet would be unlivable.
A Mighty Solar Wind May Kindle Auroras Next 3 Nights – Astro Bob
In 1859, a large solar storm brought charged particles across the entire planet, with so much energy that people all over the world could read at night, and telegraph lines carried current without any power supply.
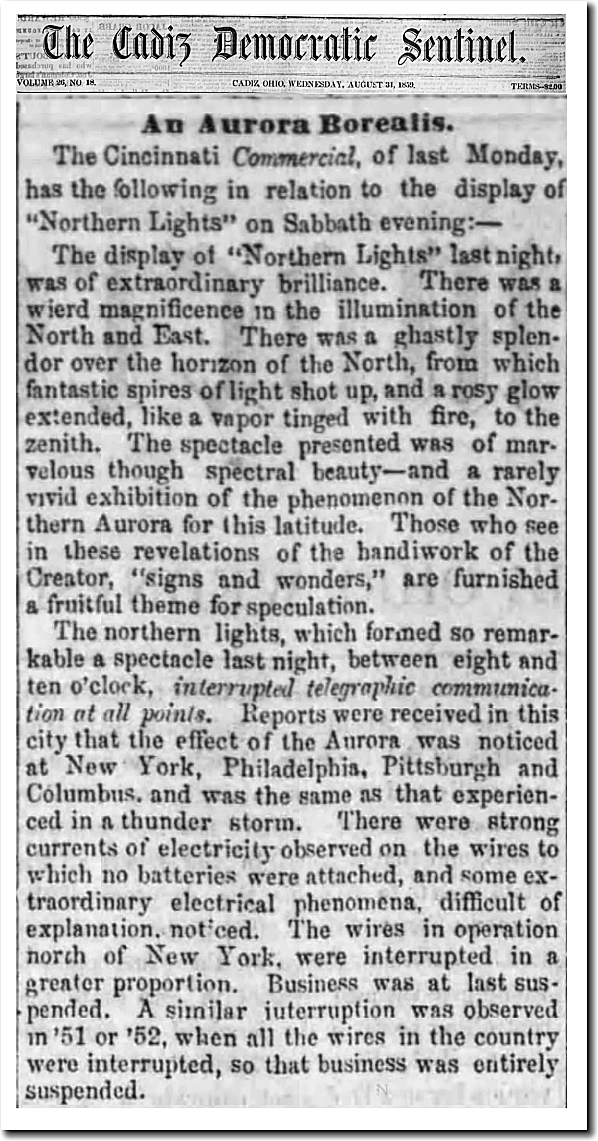
31 Aug 1859, 1 – The Cadiz Sentinel at Newspapers.com
The storm came from a coronal mass ejection which was released from this sunspot group.
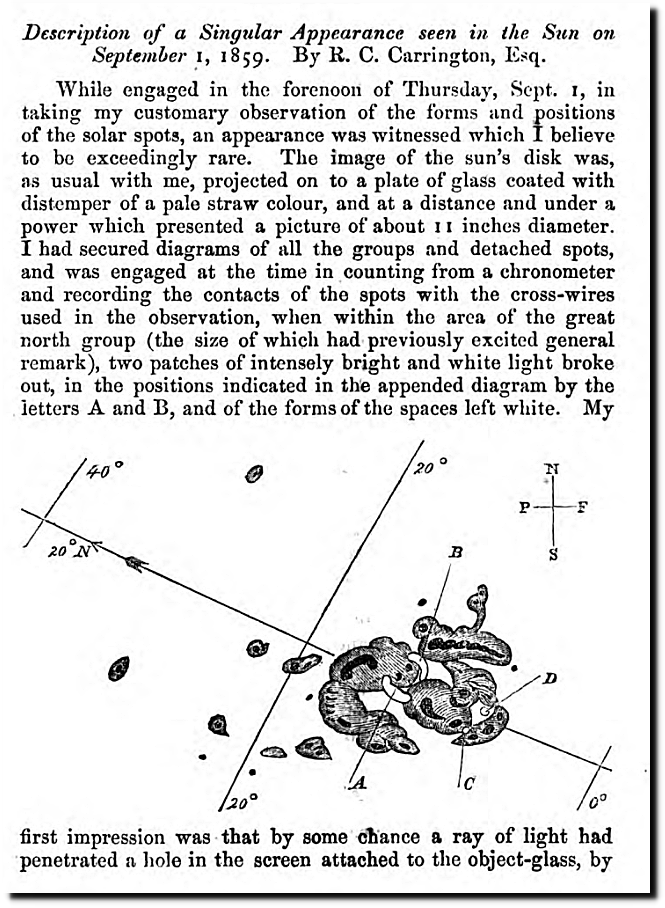
Carrington Richard sunspots 1859 – Solar storm of 1859 – Wikipedia
The solar wind brings a lot of very variable energy into Earth’s atmosphere, which is completely unaccounted for by climate scientists. And because the Earth’s and Sun’s magnetic fields are constantly changing, this causes weather patterns on earth to change too – leading to all sorts of superstitions like the current “climate change” cult.
The correlation between solar activity and earth’s temperature was obvious until 20 years ago when Michael Mann and James Hansen corrupted Earth’s temperature record through massive data tampering. Mann made the Medieval Warm Period and Little Ice Age disappear with his hockey stick graph.
Meanwhile Hansen made the 1940’s warmth and subsequent cooling disappear.
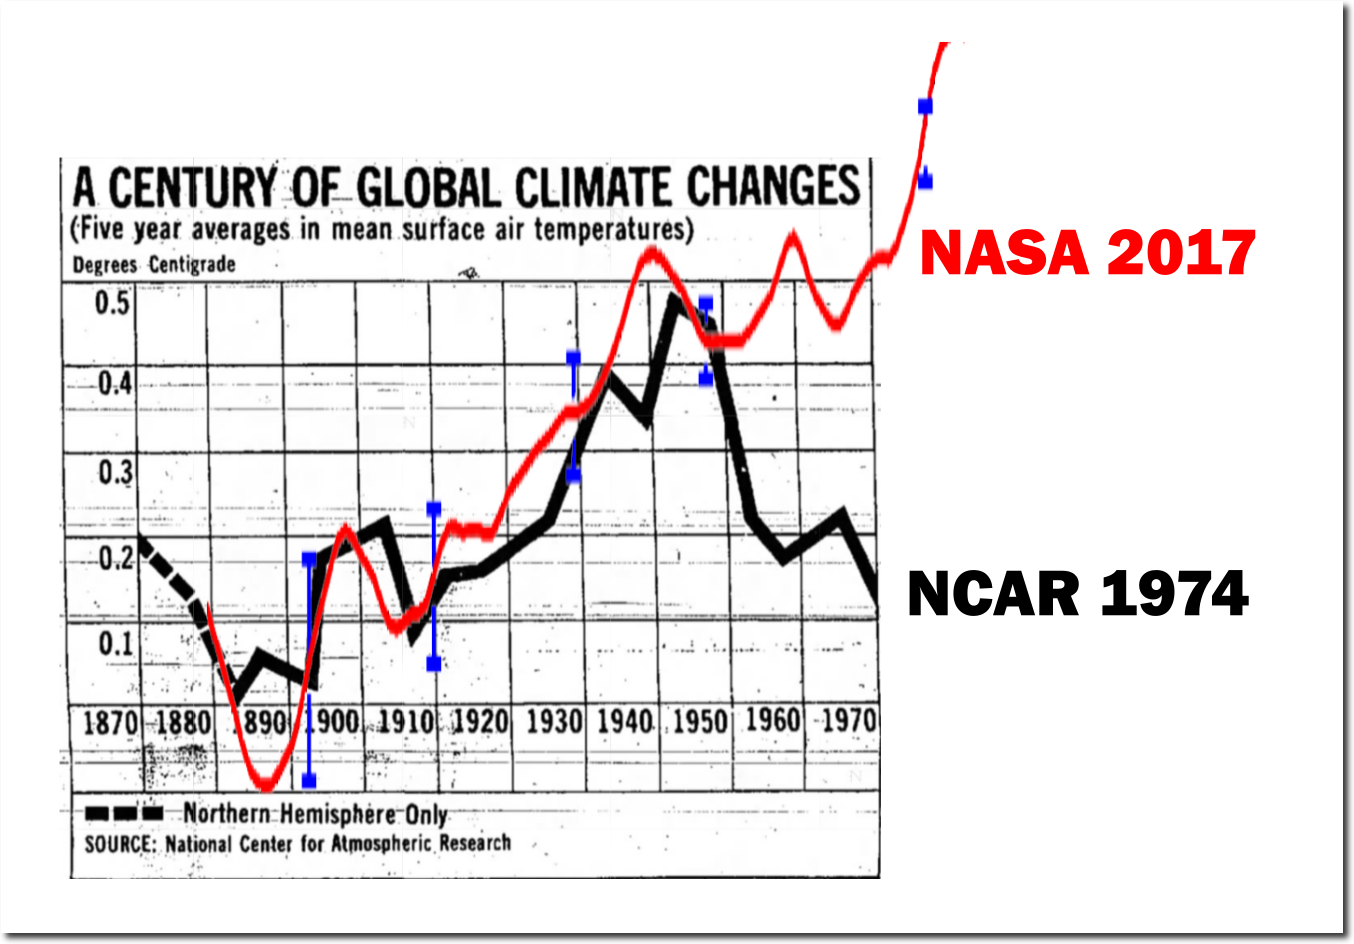
There was no question at the time that the 1930’s and 1940’s were very warm, and that the temperatures correlated with solar activity.

17 Dec 1939, Page 15 – Harrisburg Sunday Courier

13 Oct 1940, Page 76 – Hartford Courant at Newspapers.com
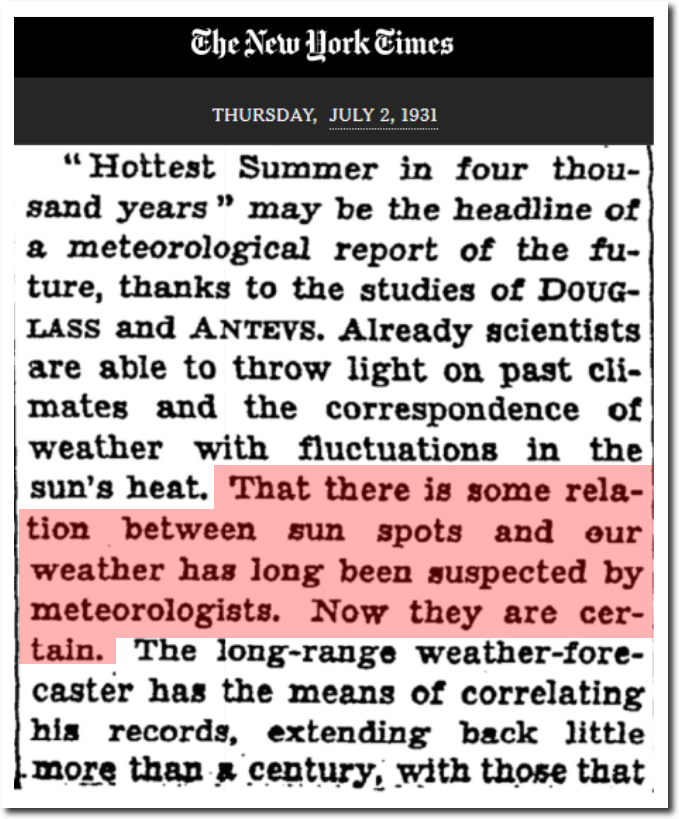
TimesMachine: July 2, 1931 – NYTimes.com
In 1951, MIT professor Hurd C. Willett correctly predicted 20 years of global cooling, based on sunspot cycles.
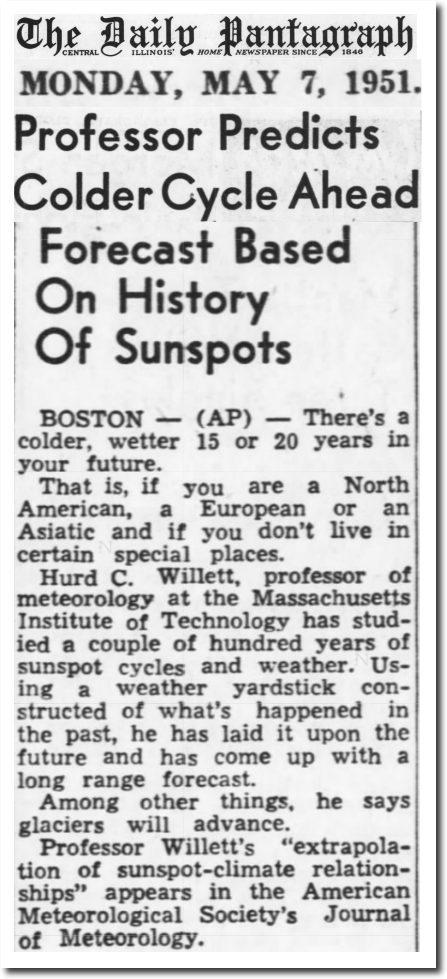
07 May 1951, Page 9 – The Pantagraph at Newspapers.com
The first director of NCAR understood that sun controlled earth’s climate.
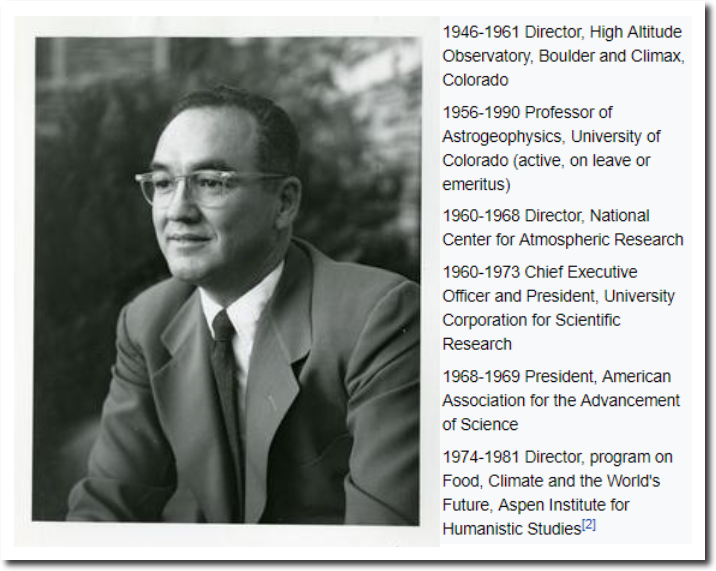
In 1973, Roberts predicted a drought based on sunspot cycles.
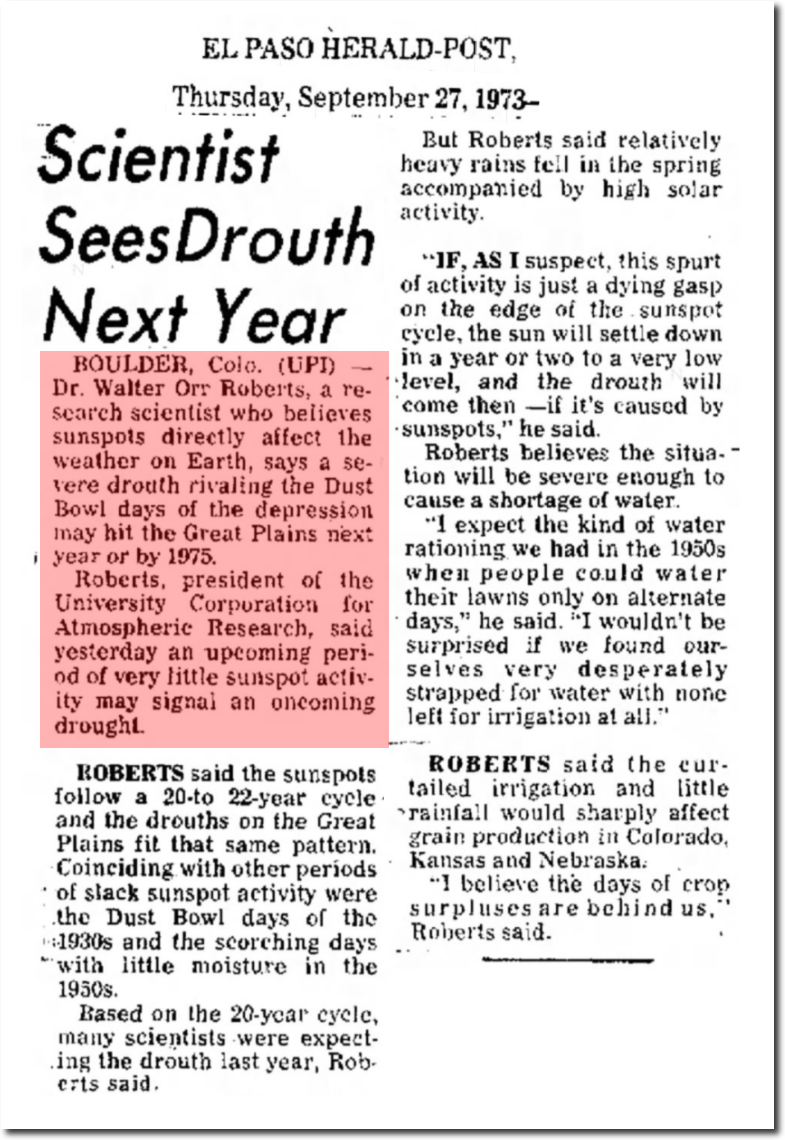
27 Sep 1973, Page 38 – El Paso Herald-Post at Newspapers.com
21 Jul 1974, 13 – The Des Moines Register at Newspapers.com
By destroying the temperature record, Mann and Hansen wrecked an entire field of science – and caused scientists to pursue a superstitious relationship between temperature and CO2 instead of doing actual research.
Posted in Uncategorized
Leave a comment
Climate Scientists Versus Science
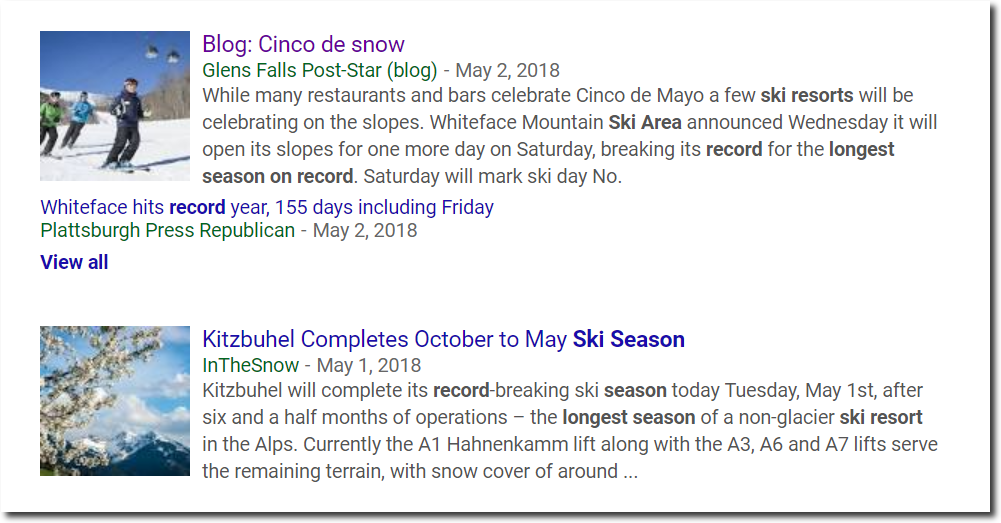
Climate scientists have been telling us for decades that skiing is doomed due to global warming. The organization “Save Our Snow” is dedicated to shutting down fossil fuels in order to save the ski industry.
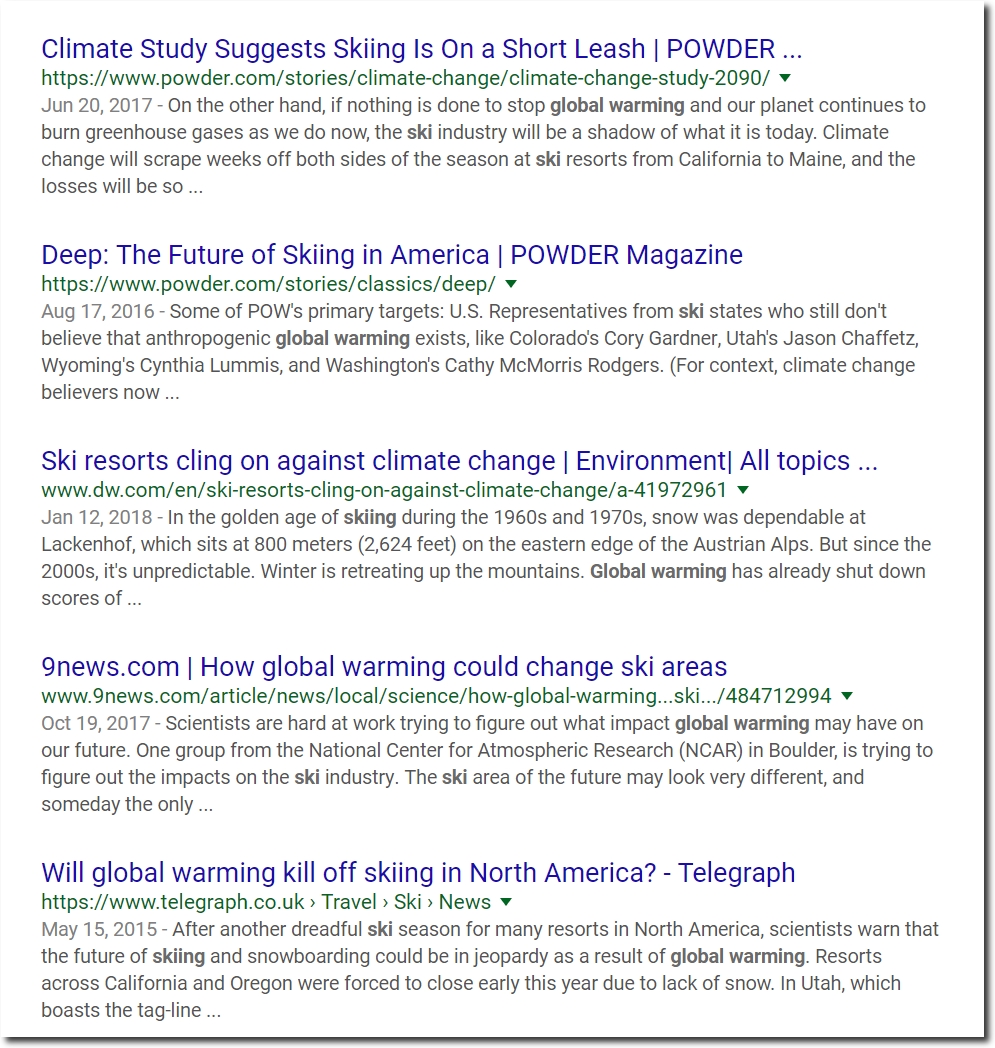
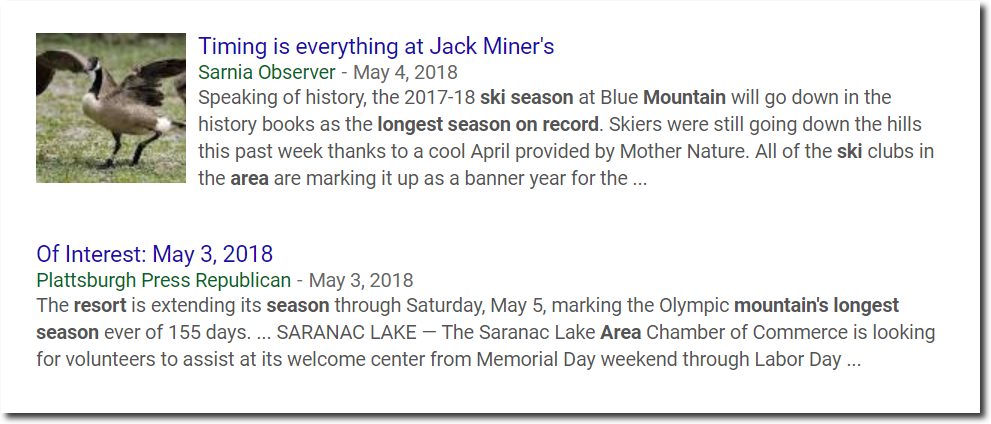
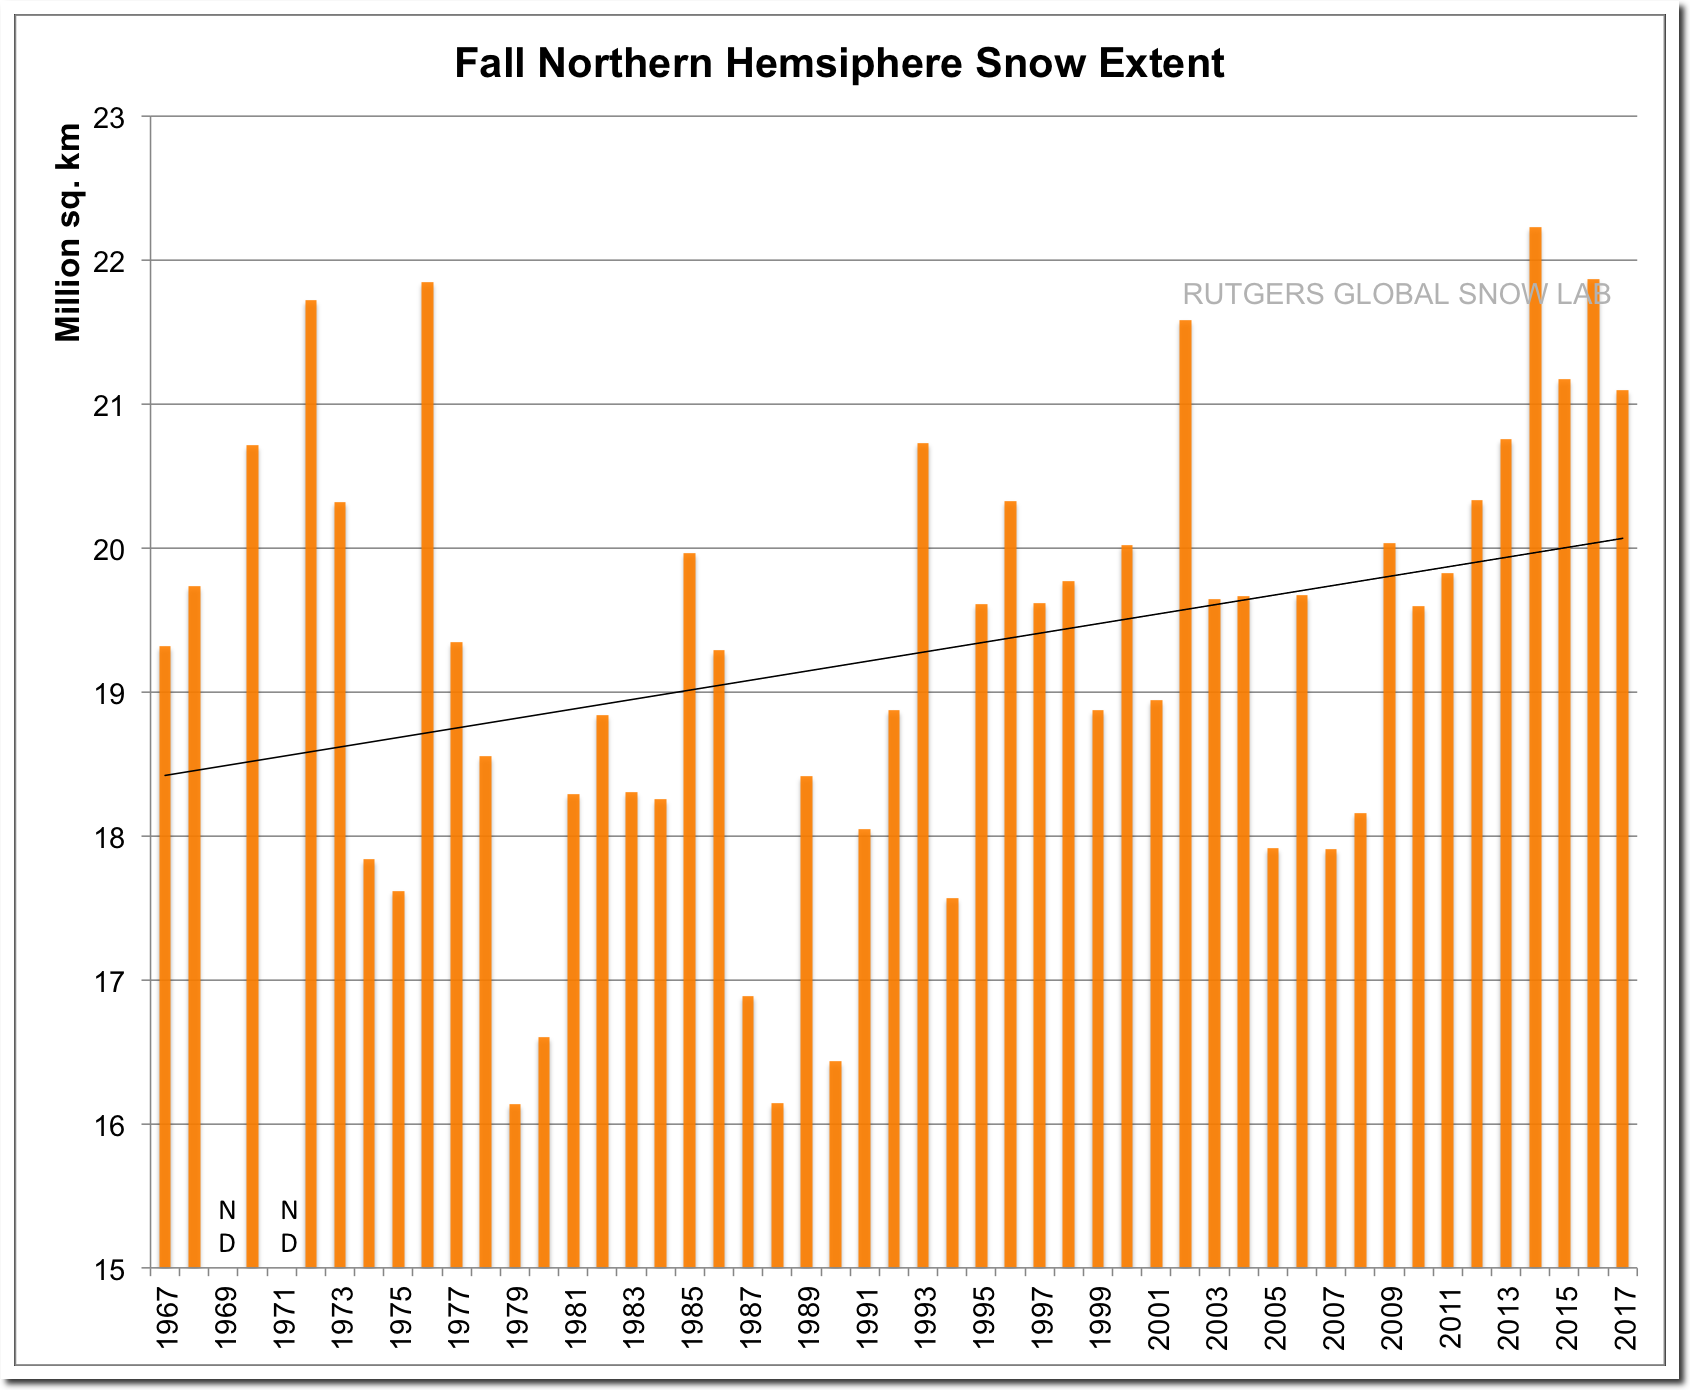
It isn’t clear how people would get to ski resorts without fossil fuels, how the lifts would operate or how they would keep people warm and fed – but the bigger issue is that reality is not cooperating with junk climate scientists. More snow is falling, it is falling over a wider area, it is lasting longer, and ski areas are seeing record snow.
Janette Janssen, general manager at Cairngorm Mountain, said:”It has been a fantastic and amazing season…. We started at the beginning of November and it has been a long and great season.”

Rutgers University Climate Lab :: Global Snow Lab

Rutgers University Climate Lab :: Global Snow Lab
Rutgers University Climate Lab :: Global Snow Lab
Most climate science is based around a superstition that CO2 controls the climate. It is one of the stupidest group think episodes in science history.
Posted in Uncategorized
Leave a comment
The Massive Solar Storm Of 1859
A giant coronal mass ejection occurred during August 1859. When the solar wind arrived at Earth, it brought auroras as far south as Panama, and disrupted all electronic communications. Strong currents ran through electrical wires which had no batteries attached. The light was bright enough for people to read at night. After similar storms in 1789 and 1848, people noticed extreme weather events.
Light was everywhere as far as our eyes could span. It seemed like a sunrise, and was so clear, soft, mellow and exhilarating, that at about 2 o’clock AM yesterday, we read the daily papers in our room.
Modern climate experts believe solar activity does not influence the weather, and that the climate is controlled by a 0.0001 mole fraction increase in a harmless trace gas.
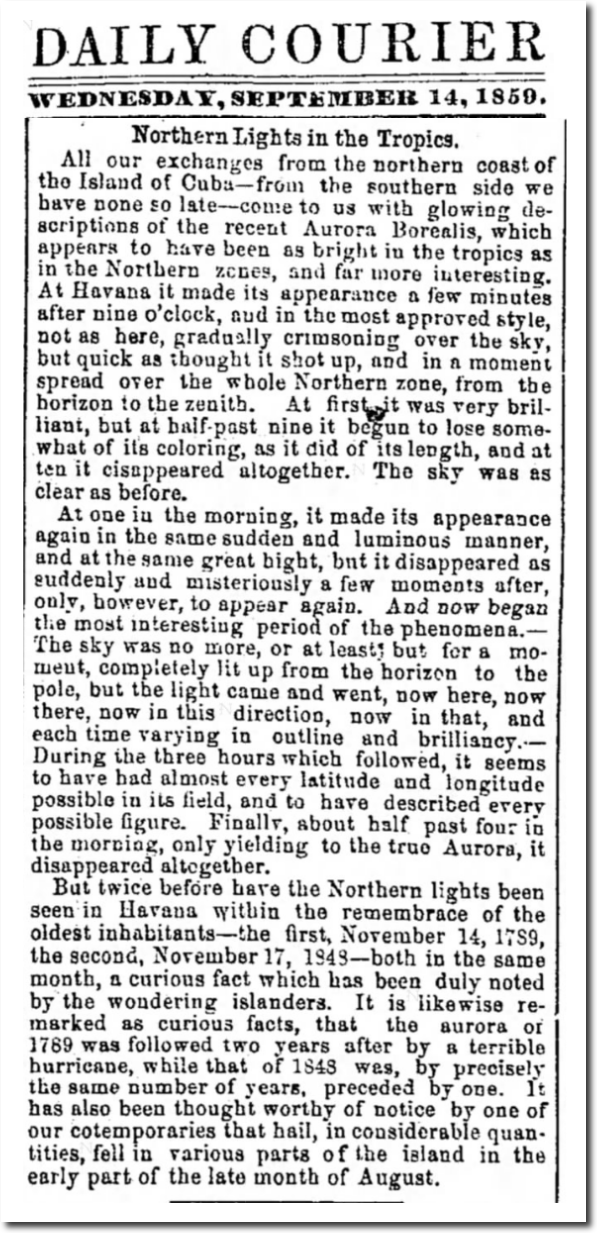
14 Sep 1859, Page 1 – The Louisville Daily Courier at Newspapers.com
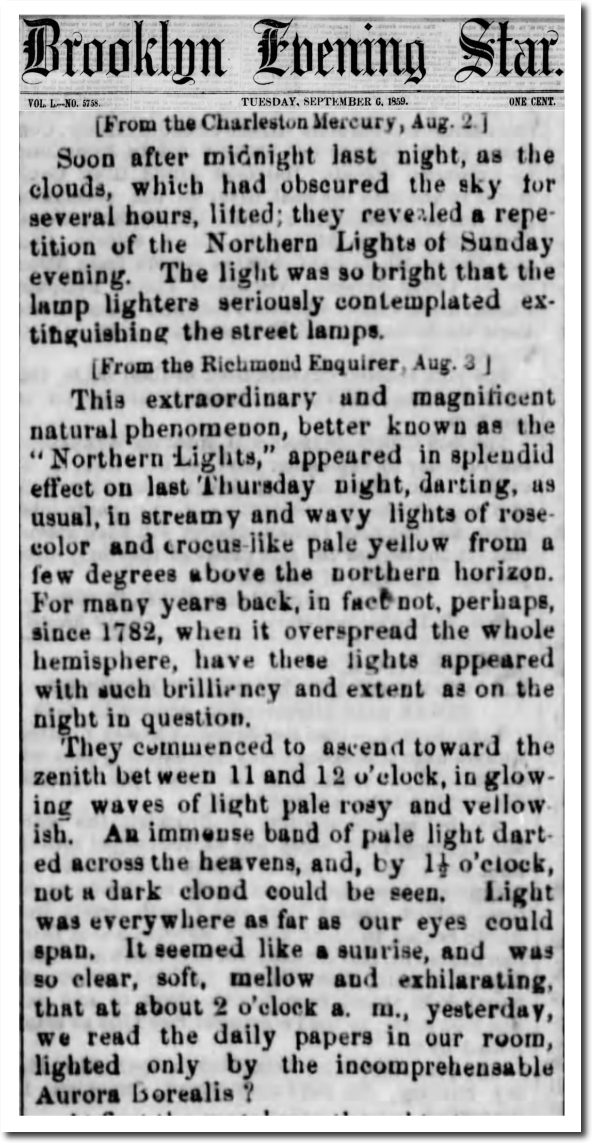
06 Sep 1859, Page 2 – Brooklyn Evening Star at Newspapers.com

Posted in Uncategorized
Leave a comment
The End Of Journalism?
Four years after the New York Times announced the end of snow, upstate New York is having their longest lasting ski season record.
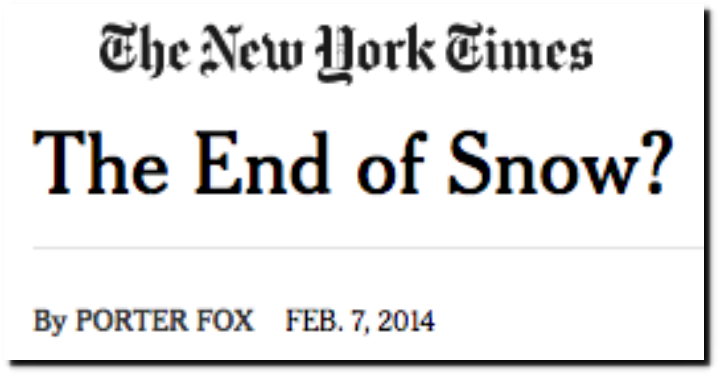
The End of Snow? – The New York Times

Posted in Uncategorized
Leave a comment
Nesting Time
Last year I watched the very short childhood of three baby Cooper’s Hawks


Two Weeks Of Growth Of The Chicks | The Deplorable Climate Science Blog
They are back at the nest. Not sure if this is one of last year’s chicks or one of the parents, but I met up with him at dinner time. The face and gaze looks very similar to the top baby picture above.


Same bird?


Posted in Uncategorized
Leave a comment
Disaster Looms For Climate Alarmists
Arctic sea ice is melting much slower than normal this spring. Normally, most of the melt during May is in the Bering Sea, but the ice has already melted there – nearly guaranteeing ongoing slow reduction in sea ice extent over the next month. By the end of the month, ice extent should be close to the 1981-2000 mean.
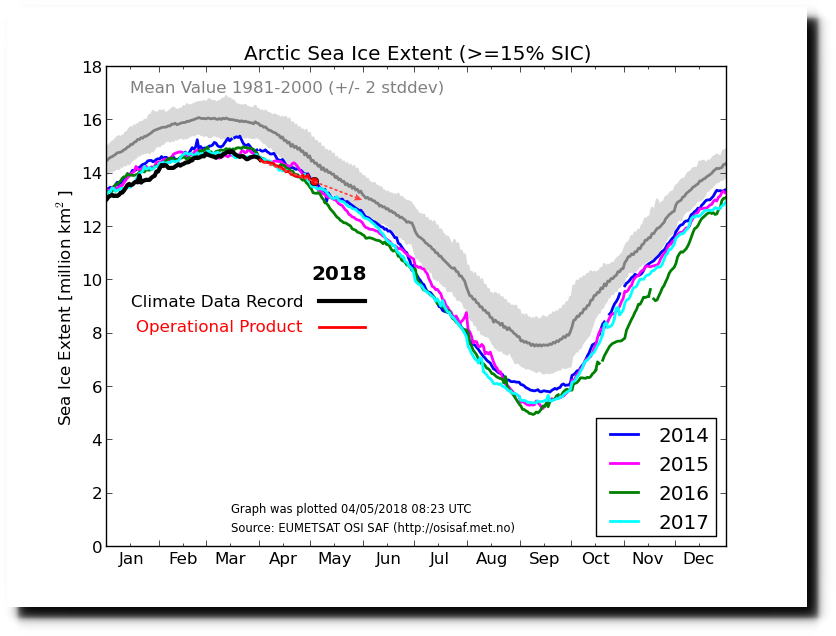
Ocean and Ice Services | Danmarks Meteorologiske Institut
Tough times for Democrats and climate alarmists, who expected all the ice to disappear this summer.
Posted in Uncategorized
Leave a comment
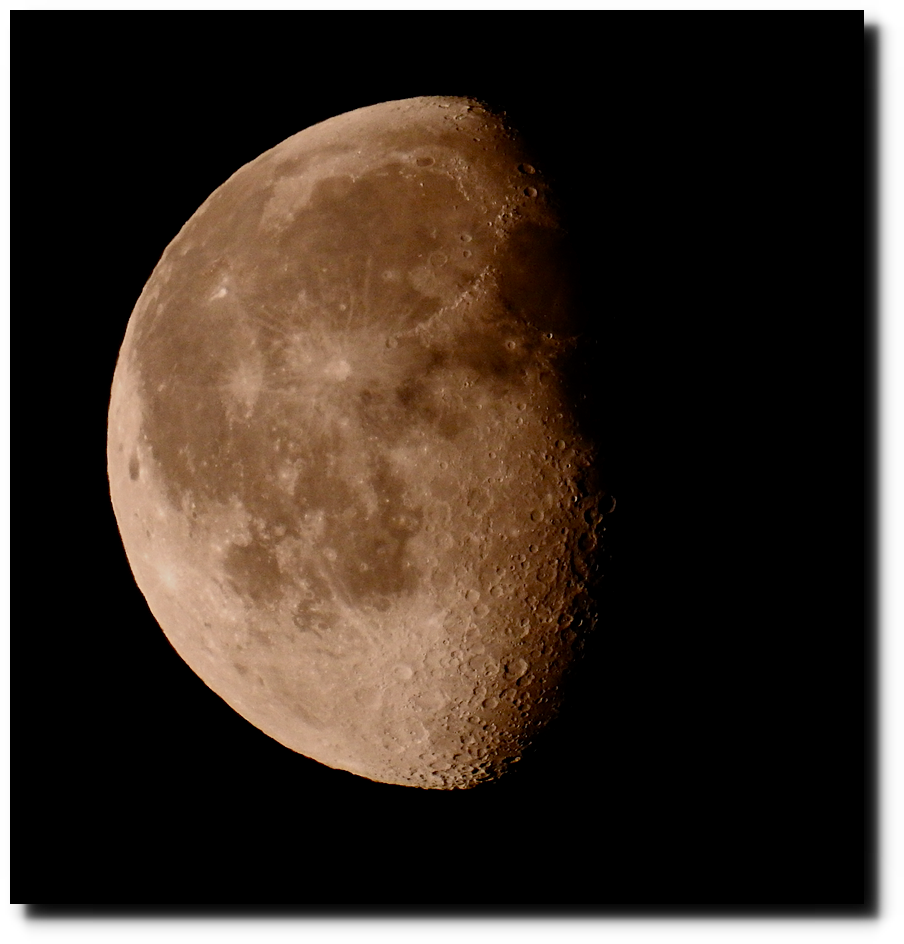
Heavenly Bodies
Jupiter, Mars and the Moon. Taken this morning with my Nikon P900 Camera.


Posted in Uncategorized
Leave a comment
Another 97% Consensus Dies
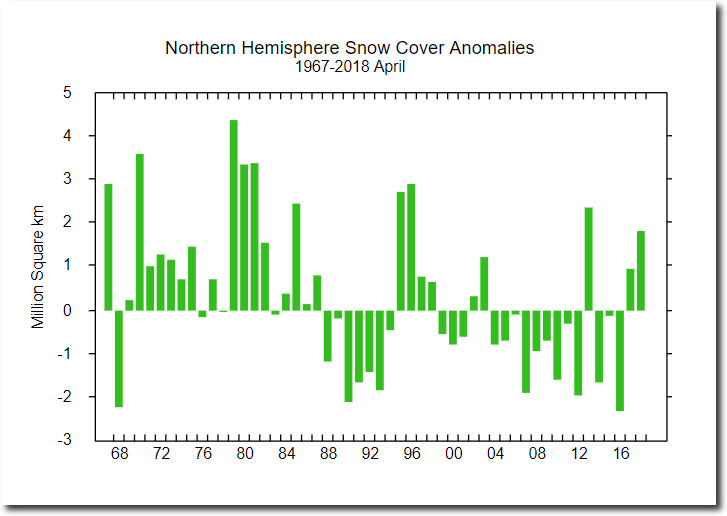
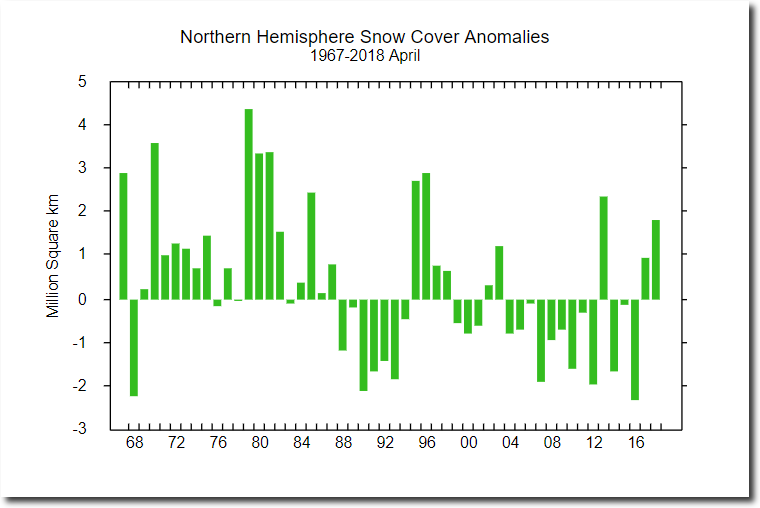
With all of their other superstitions falling apart, climate scientists are still clinging to the “declining spring snow cover” scam.
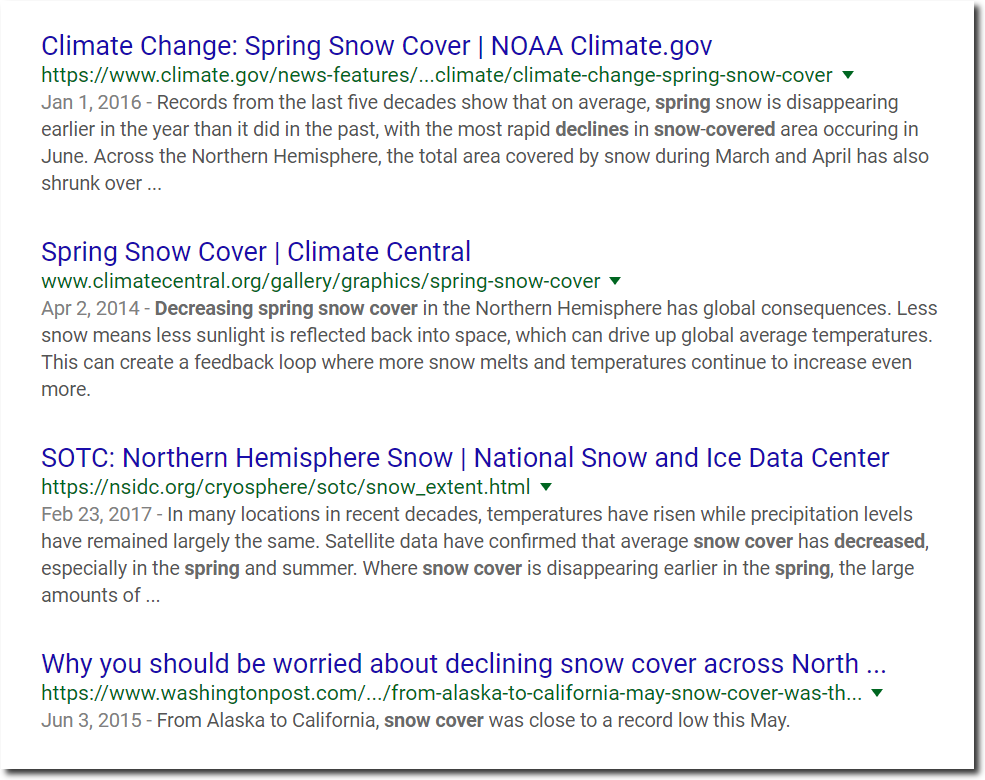
Sadly for the climate cult, three of the last six Aprils have had above normal snow cover. This year was in the top ten since 1967.
Posted in Uncategorized
Leave a comment
Katherine Hayhoe’s Junk Science Iced Out Again
Lake Minnetonka, Minnesota is having their latest ice out on record.
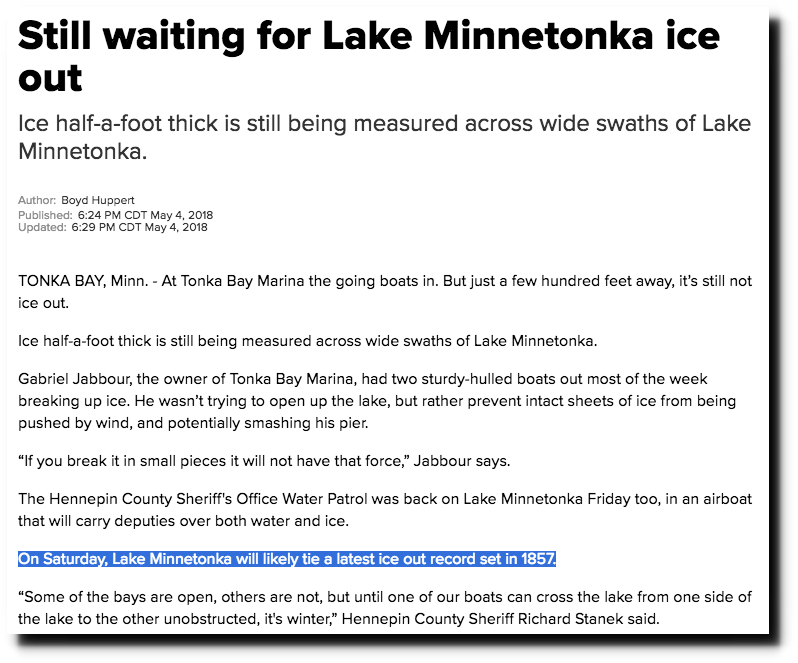
kare11.com | Still waiting for Lake Minnetonka ice out
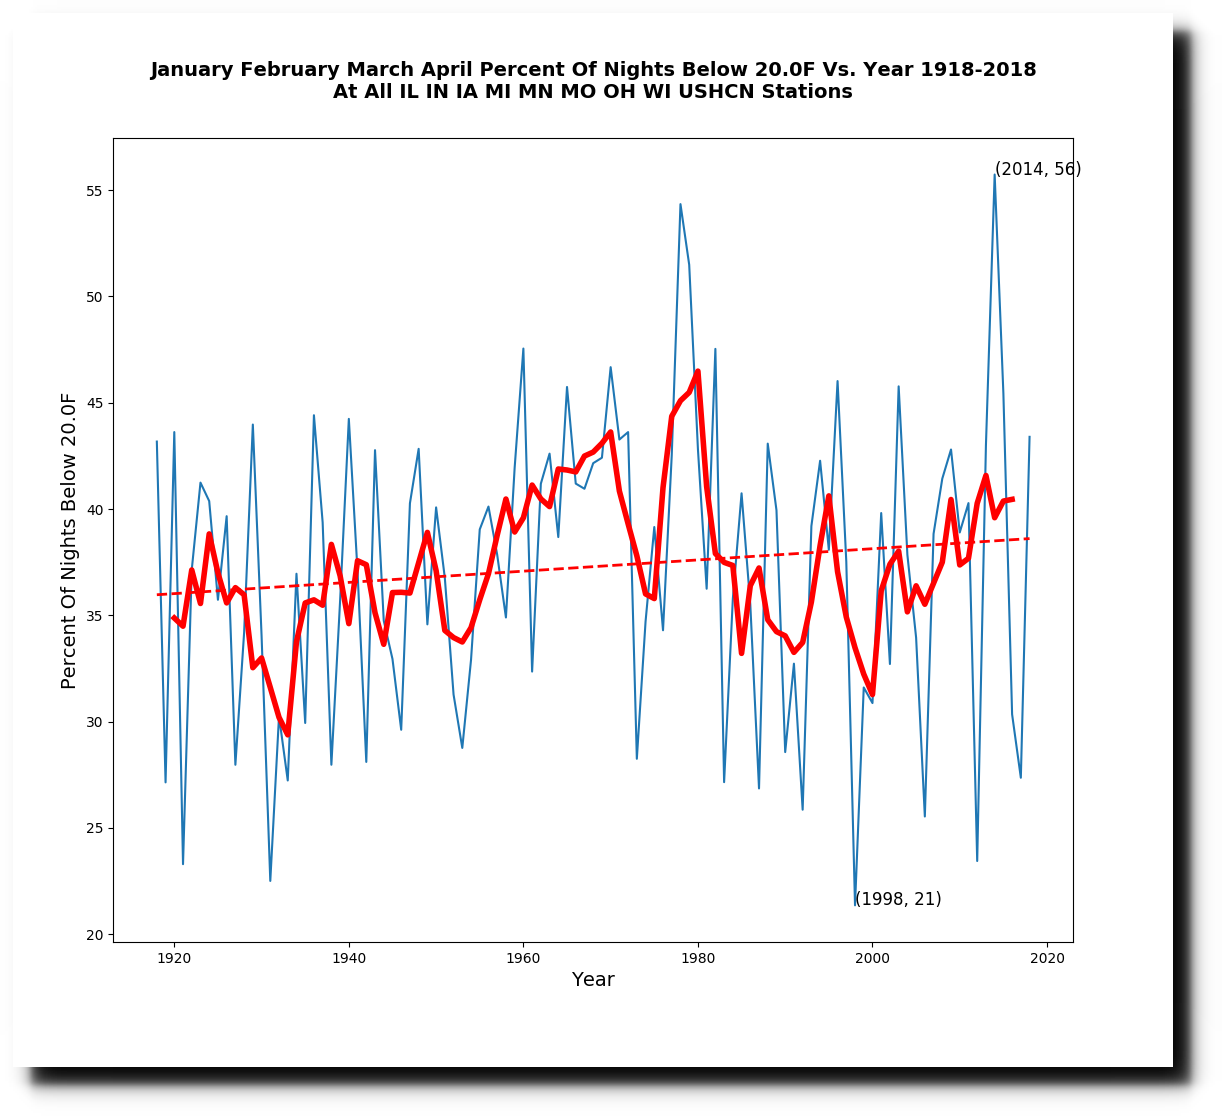
Meanwhile, fake scientists Katharine Hayhoe and the Union of Concerned Communist Scientists say Midwest ice is melting earlier, they are having more heatwaves and less cold weather.

Microsoft Word – KH_MW_climate_change_report.docx
Cold nights are becoming more common in the Midwest, with 2014 being the coldest in a century.
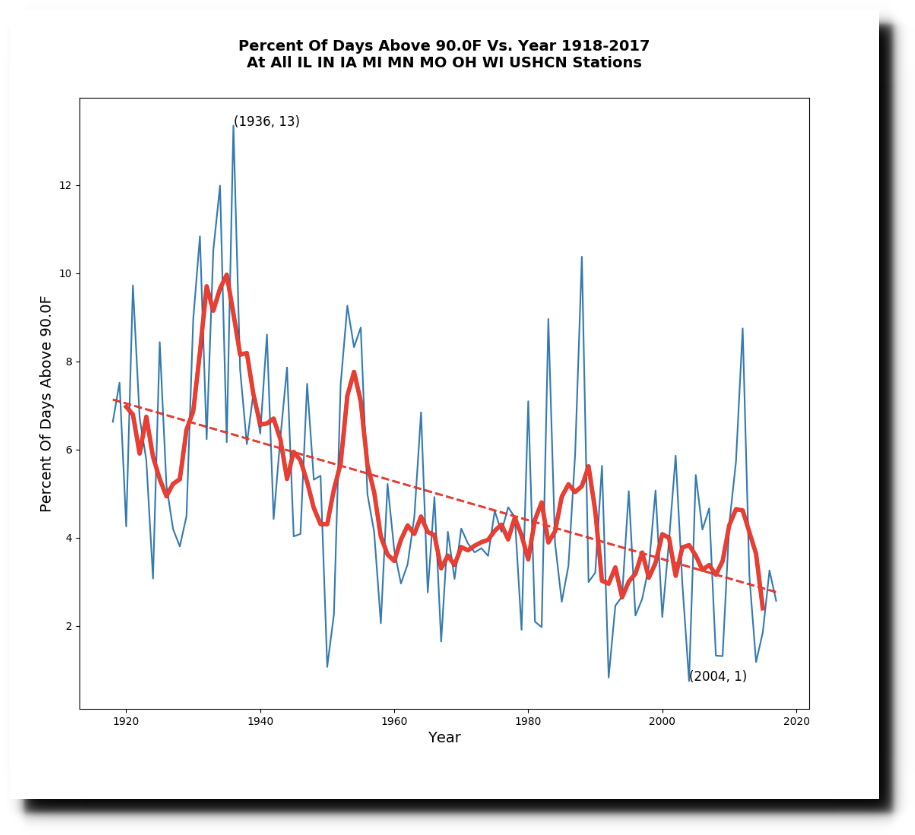
Hot days are becoming much less common in the Midwest.
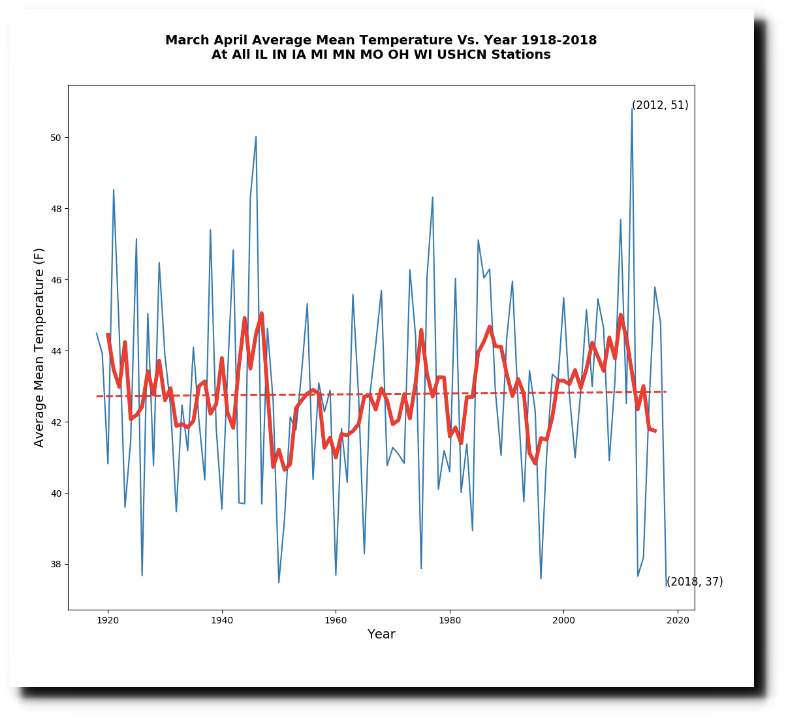
March and April were the coldest on record in the Midwest, which accounts for the record late ice out.
Like most climate scientists, Katharine Hayhoe lies about almost everything. What makes her unique is that she claims to do it in the name of god.
Posted in Uncategorized
Leave a comment