
This is graph of US maximum temperatures published on their website. It shows a hockey stick of warming after 1976.
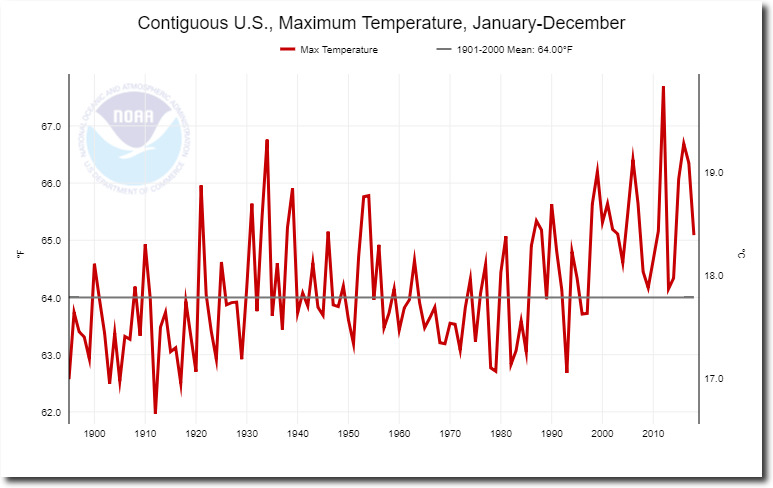
Climate at a Glance | National Centers for Environmental Information (NCEI)
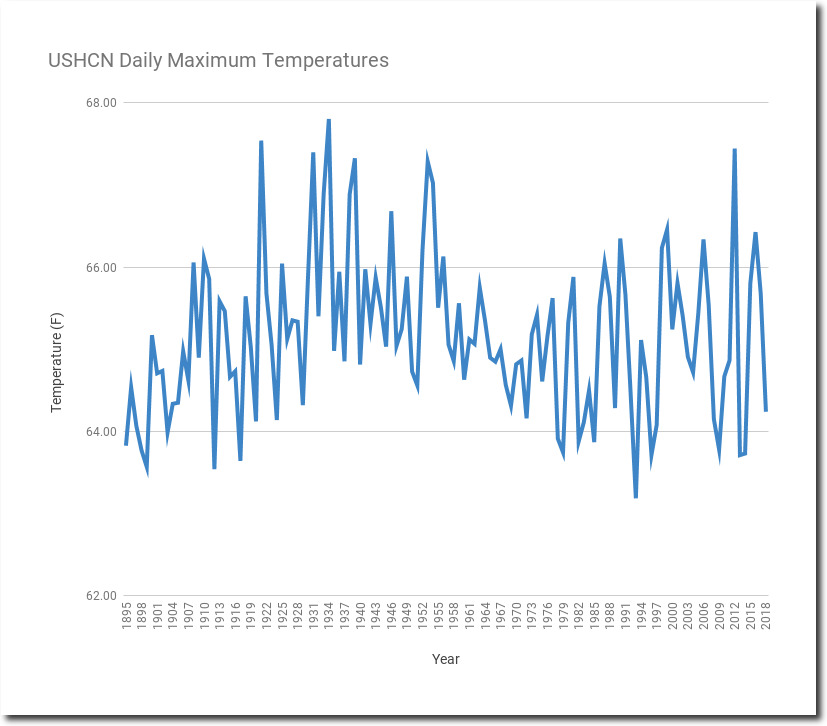
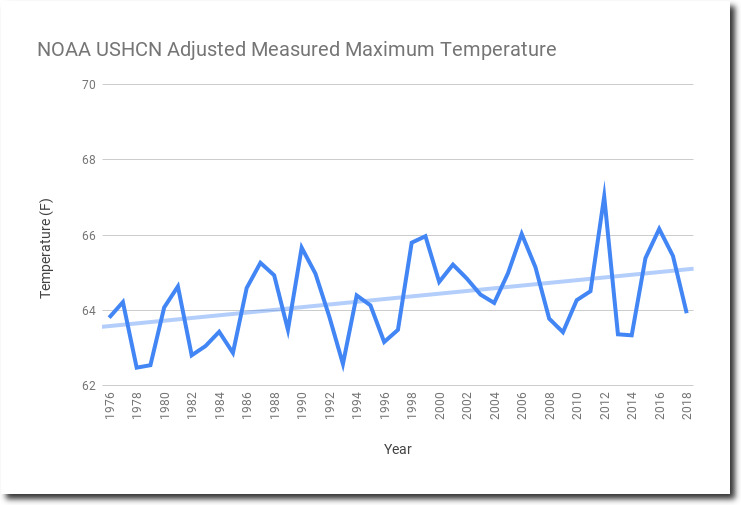
The actual measured thermometer data does not have the post-1976 hockey stick. There has been very little warming since 1976, perhaps one degree F.
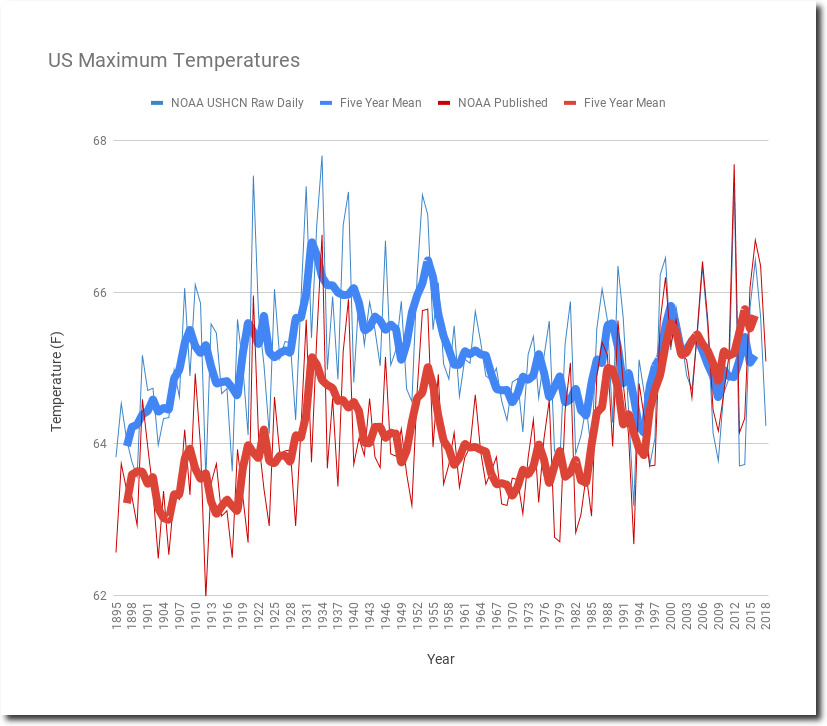
The next graph compares the measured temperatures (blue) vs. the reported (red.) The measured temperatures show long term cooling, but the reported temperatures show warming.
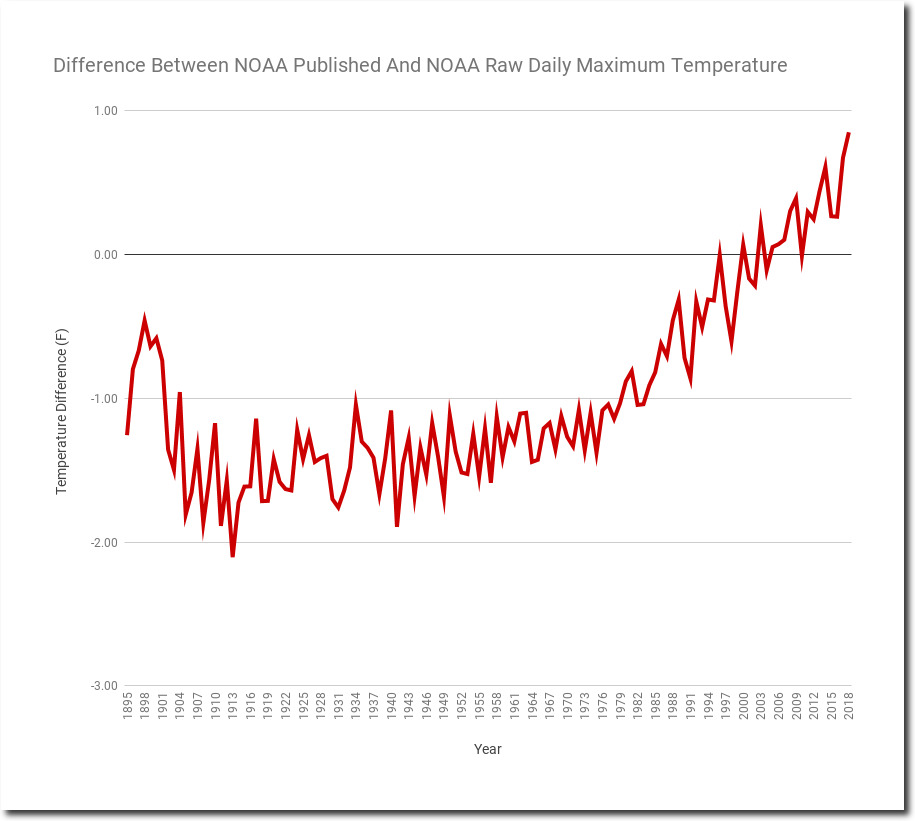
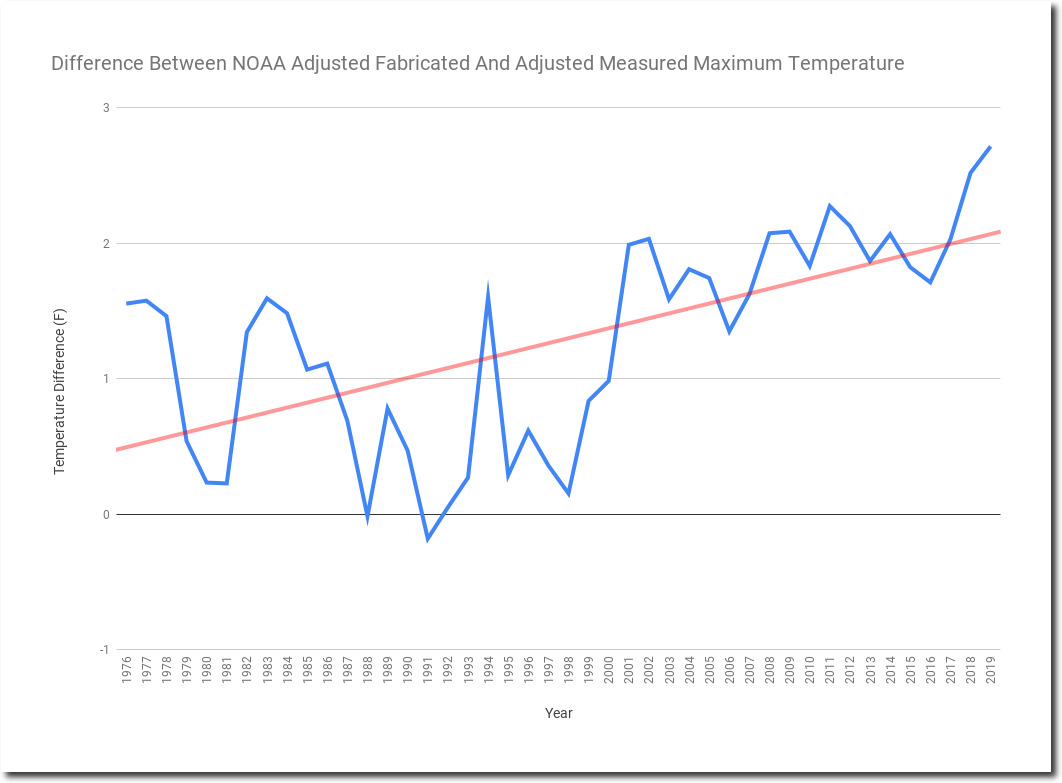
This graph shows the difference between reported and measured temperatures. The post-1976 hockey stick becomes very apparent.
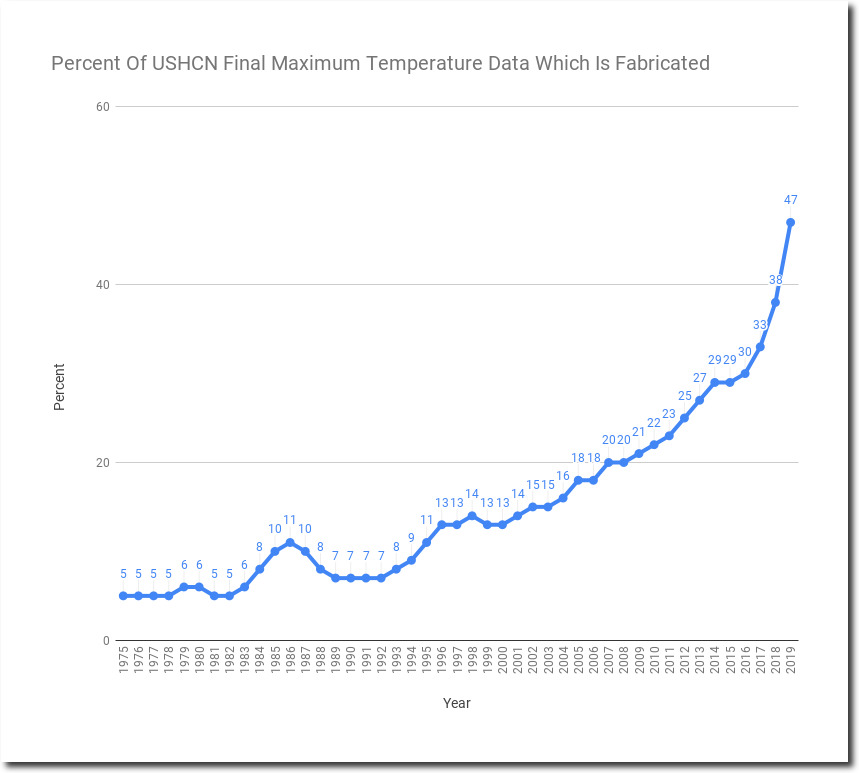
So how is NOAA tampering with the data to create this hockey stick?
Alarmists claim that it is due to Time of Observation Bias or changing station composition, but that isn’t what is going on. NOAA is simply making the data up. Every month, a certain percentage of stations does not report, and are marked with an E (estimated.) The percentage of estimated (i.e. fake) data has skyrocketed from around 5% to almost 50% since 1976.
And here is the smoking gun. Comparing the fake adjusted temperatures to the measured adjusted temperatures. The measured adjusted temperatures show about one degree warming since 1976, but the fake temperatures show about three degrees warming. And almost half of the data is fake now.

The post-1976 hockey stick is created by manufacturing data, not adjusting data as alarmists claim.
Manipulating the US temperature data is very important to global warming scamsters, because the US has the vast majority of high quality long term data. Much of the rest of the world has been very busy dealing with genocide and world wars for the past century. Maintaining temperature data was a low priority for people trying to keep from being killed by their government.
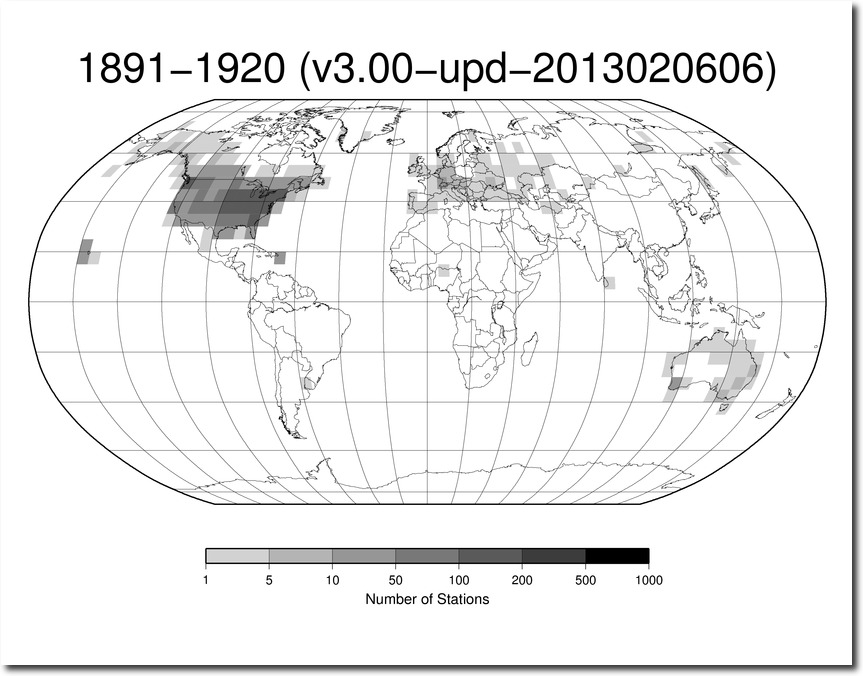
ftp://ftp.ncdc.noaa.gov/pub/data/ghcn/daily/figures/station-counts-1891-1920-temp.png
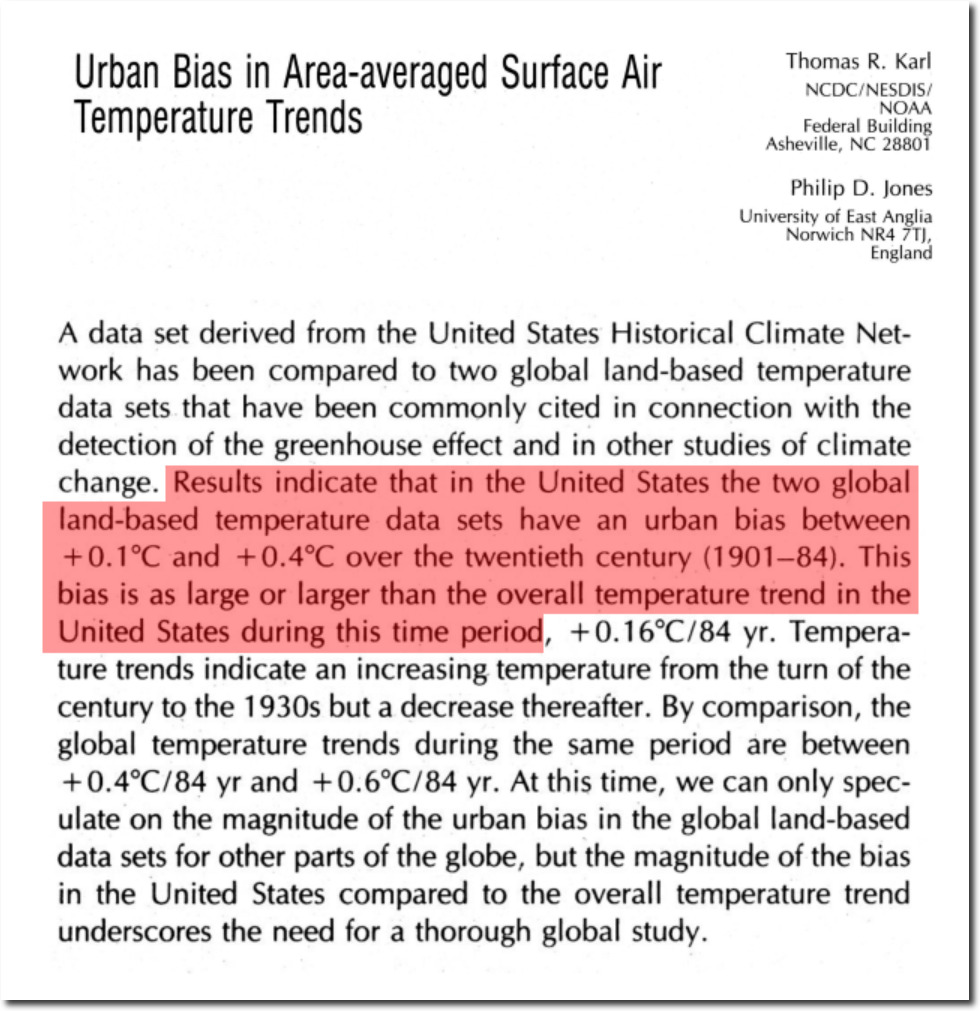
And then there is UHI. Thirty years ago, Tom Karl and Phil Jones said that UHI was responsible for the entire warming trend in the US.
