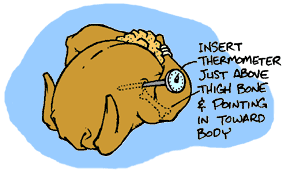
Most people probably assume that measuring the US temperature is as simple as this. And perhaps it should be.
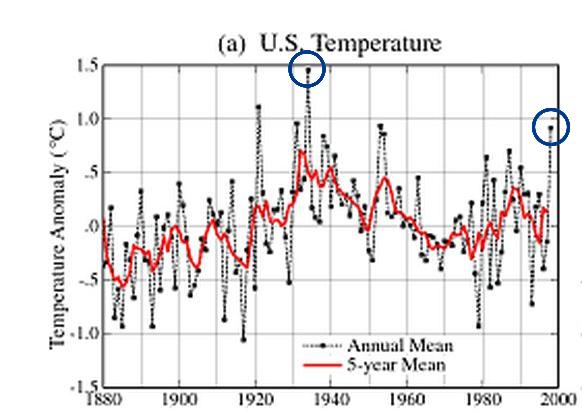
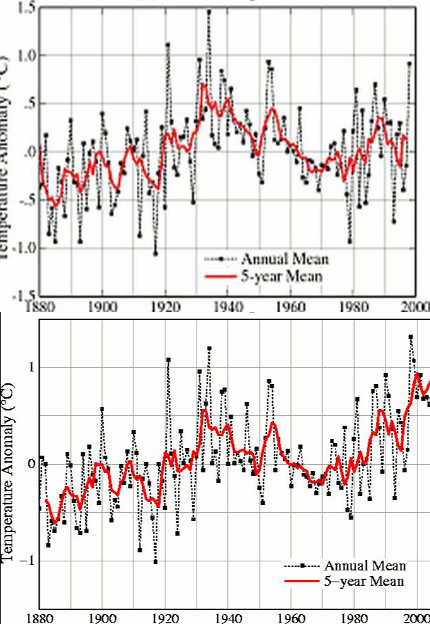
Prior to the year 2000, the GISS US temperature graph appeared as below. Note that 1998 was more than half a degree C (almost 1ºF) cooler than 1934.
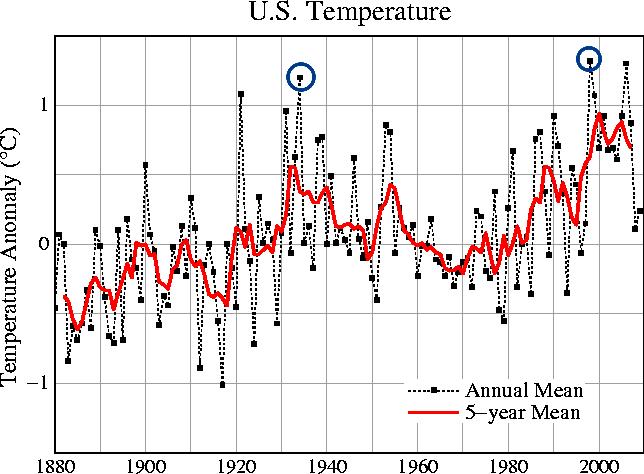
In the year 2000, they switched places. 1998 became warmer than 1934. How did this magic occur?
The blink comparator below shows the changes very clearly. Recent years got a lot warmer, while the 1930s got a lot cooler.
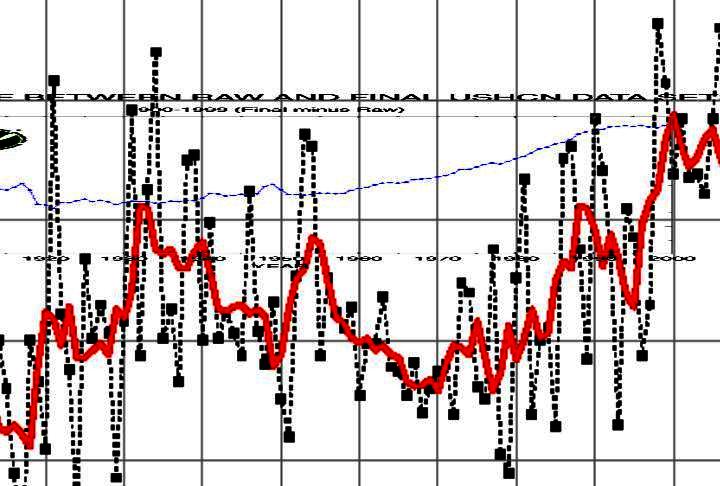
You can see the trick behind the magic in the USHCN graph below. Most temperatures readings made prior to 1950 have been lowered ex post facto, and most years after 1950 have been raised successively higher.
In fact, all temperature readings taken after 1990 have more than 0.5 degrees F added on to what was actually measured by the thermometers!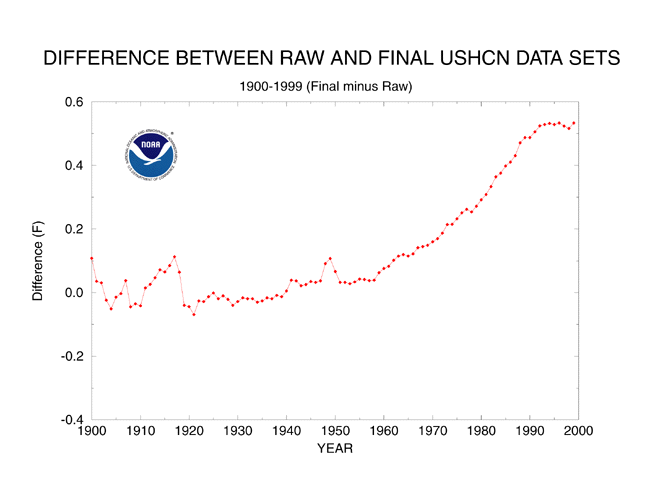
http://cdiac.ornl.gov/epubs/ndp/ushcn/ts.ushcn_anom25_diffs_urb-raw_pg.gif
Now, here comes the kicker. I overlaid the USHCN adjustments (thin blue line) on the current GISS US temperature graph below, lining up with the 1930s peak. The scale adjusted for Fahrenheit vs Centigrade of course.
As you can see, essentially all of the “warming” which is shown in the graph since the 1930s, is due to adjustments made to the thermometer readings.
For an explanation of the adjustment rationale, read this document from the Carbon Dioxide Information Analysis Center.
http://cdiac.ornl.gov/epubs/ndp/ushcn/ndp019.html#abstract
————–
Have you ever heard the term “confirmation bias?”


I accidentally found this while skimming the linked article. I think I was looking for it!
“Application of the Station History Adjustment Procedure (yellow line) resulted in an average increase in US temperatures, especially from 1950 to 1980. During this time, many sites were relocated from city locations to airports and from roof tops to grassy areas. This often resulted in cooler readings than were observed at the previous sites. When adjustments were applied to correct for these artificial changes, average US temperature anomalies were cooler in the first half of the 20th century and effectively warmed throughout the later half.”
The odd thing is that airports heat up relative to grassy areas, so while the initial move may have caused a cooling that had to be negated, subsequently airports temperatures warm relative to rural areas. So as I see it, we should see a series of positive step-changes as the moves occurred (from warmer cities to cooler airports etc.), followed by subsequent negative incremental adjustments to bring the warmer-than-rural location tempertures into line with the majority, rural planet.
I don’t see that.
That reasoning isn’t science.
It’s politics.
Presumably you are inferring that there have been that there has been confirmation bias in the adjustments. The next question is which adjustments are subject to confirmation bias. I think the the only credible adjustment for Confirmation Bias is the Urban Warming Adjustment although SHAP sounds a bit shifty, but there are six adjustments so people can pick their favorites. Conspiracy theorists can have a ball! Keep up the good work!
Any adjustment of this type is subjective. Do you think the magnitude of the TOBS adjustments are hard science?
Remember, we are talking about claimed warming of only a few tenths of a degree. It doesn’t require much error in an adjustment to make the difference between warming and cooling.
Pingback: 0.5 Degrees Added to All Temperatures After 1990
Pingback: June 1934 – An Incredibly Hot Month | Real Science
Pingback: July, 1934 – Blistering Heat | Real Science
They are not calculating this adjustment from first principles — that is, from some formula involving well-known mathematical constants — but instead estimating it from the behavior of similar thermometers, weather stations, and diurnal temperature cycles which are being examined years after the measurements they want to adjust have taken place. This estimate, like any other experimentally measured quantity, has an error associated with it; and this experimental error will increase the total error of the measurement when it is used to adjust old temperature data years later. That is why, in non-politicized science, analysts usually don’t bother to make these sorts of empirical adjustments to laboratory data years after the experiment is over — when the error in the adjustment is correctly and honestly evaluated, the increase in the error of the adjusted measurement almost always more than washes out the increase in accuracy of the adjusted data. The best way to proceed is to use the estimated adjustment to increase the error bars of the unadjusted data.
So, after all that, my question is: Exactly what do these climatologists think the error is in the few tenths of a degree they are using to adjust their historical data? A close and honest examination of how these few tenths of a degree are determined would probably show that the error introduced more than washes out the accuracy gained. I would be very surprised to find that you can fight “Murphy’s Law” this way and win.
Completely agree. The raw data should be left intact.
At a minimum, GISS should display the raw data plots side by side with the “adjusted” ones, and clearly mark them.
Bad scientific data is forgivable, faked scientific data is punishable. Somebody needs to be prosecuted.
I am not a believer in conspiracy theories.
So how can I rationalise this?
Confirmation bias? All humans do that.
No, it’s not confirmation bias. Confirmation bias is passive. It is the reason that I devour skeptical blogs but when I try to read Joe Romm or Real Climate I almost throw up because I can’t tolerate the unending stream of BS (which also happens to threaten my beliefs).
This is the product of many intelligent people in positions of authority throughout the world who are manipulating raw data to present a fraudulent view of the global climate. Confirmation bias is what occurs when the man-in-the-street reads their garbage, believes it and doesn’t have have sufficient intellectual curiosity to question it.
How about: They needed a way to use the data, so they made one up, but they weren’t very astute in statistics, and they were negligent of problems with the data.
However, there’s a problem with saying that one does not believe in conspiracy theories: There are malfeasances committed by groups which do not rise to the level of actual conspiracy. A “conspiracy theory” is usually a theory that a small, secret cabal exists. Some conspiracy theories may be correct, but most of them wrongly explain more complex things as conspiracies. My point is that you don’t need a conspiracy to have lots of people culpably going wrong.
Pingback: All Your AGW Are Belong To Us « SOYLENT GREEN
George,
The entire AGW proposition rests on the assertions of a handful of people at NOAA and GISS. Many of these individuals are openly activist for non-scientific speculation and scaremongering on AGW. One must wonder why GISS is involved in this issue at all…. until you realize that Hansen is AGW’s most ardent zealot, who has weaseled funding into his office to promote his pet obsession.
CAGW is a cult religion, joined at the hip with a Pantheistic Malthusian Marxism. Science is just a cover. It requires no conspiracy. Believers proselytize constantly, seeking new followers. This is why our current administration wants to incorporate CAGW into elementary school curriculum.
http://www.cnsnews.com/news/article/75711
Adults just aren’t buying the story, and it’s easy to fool little kids. The fact that CAGW is zealotry, and malevolent toward humanity, makes it very dangerous indeed. Most believers don’t even realize the disconnect between CAGW claims and the scientific method. They really believe it’s science, and some of them are quite good at arguing in its behalf.
After you read THOUSANDS of articles, many of them from CAGW zealots, you can clearly see the association. Climate Justice=Social Justice=Malthusian Marxism. It is a cult of scarcity, self loathing, fear, and envy.
If a new conservative Congress/President were to remove Hansen, Schmidt, Serreze, and their minions, then fund a full blown audit of data and methodology, the result would likely blow CAGW to kingdom come.
George, Layne
You have put this about as clearly as possible. I believe the ‘little people’ are starting to get it……not in droves yet, but it is spreading as they see the nonsense behind the ‘sky is falling’ elitists.
So much manipulation has occured over the past twenty years and in so many ways, it will be nearly impossible to ever reconsruct real temperatures for this period.
These actions are the antithesis of real science and they boggle the logical mind.
So The upward adjustments ‘boil down’ to correcting for the Rural Cool Island Effect. OK. It is just a little scary to think that a very few anonomous people made these adjustments which dramatically shifts the whole global narrative about AGW. Wow.
Hi Steve,
I remember seeing charts confirming this some time ago on NOAA and being blown away by it and wondering why no one else was talking about it. Now you’ve done the hard, intellectual work to put it all together and show it clearly.
I also seem to remember that it was Dr Tom Karl (do i have that name right?) who was responsible for most of the studies that provided the rationale for the adjustments. Which struck me as a possible conflict of interest, but I can’t remember exactly why now – was he a particularly enthusiastic warmist or something?
This is extremely interesting if true (I’m going to assume it is based upon past shenanigans). It’s strange because the adjustment should be DOWNWARDS to account for urban heating – if any adjustments were to be made at all.
Basically, we have reduced our temperature history to the last 15 years when the “difference” was constant. The last 10 years hint of a slight decline. Not that it will change anything, as CO2 is the culprit for whatever might happen. The French Company TOTAL is barging ahead with plans to sequester CO2 because (Quote from its brochure): “the temperature WILL rise 2 – 5 deg C by 2100” .
It is already happening. The temperature has risen 15C, just since I woke up this morning!
Heh.
Hoping not to get all Godwinized, but during the 30’s and 40’s in Germany much of the grade-school and high-school level curriculum was invested with pseudo-scientific scientism, asserted by “Leading Scientists and Authorities,” who taught a kind of “Fire and Ice” creationism/cosmology, based on semi-empirical observations to render it plausibility – and which also happened to support their deeply political, racialist and eugenic biases.
That proves anthropogenic warming – done at NASA!
P Gosselin,
Have a look, see GISS make warming appear where the others don’t:
part 1 (part 2 on the way)
http://www.youtube.com/watch?v=6ROMzxA4A9c
Pingback: Top Posts — WordPress.com
If it wasn’t so sad , to see otherwise intelligent people argueing about a common sense theory, especially when we have elected those people to administer our wishes . Unfortunately , they have control of our money and just love to spend it .
Steven Goddard, I’ve always been impressed with your work. Good job!
Is there a way of showing a breakdown of the different adjustments made by NOAA, especially UHI? As I think most of the participants at this, and other skeptic sites, are aware, UHI is the 500 pound gorilla in the room. Can the NOAA/GISS UHI adjustments be compared to those proposed by the work of Dr. Roy Spencer?
I was also under the impression that the NOAA adjustments for UHI were “zero” based on the work of Peterson (which Steve McIntyre eviserated several years ago on his blog Climateaudit.org).
I would also like to add that what Total is probably doing is trying to get the taxpayer to pay for their Tertiary CO2 oil recovery project.
Don’t be too fooled, oil and gas producers are looking forward to having their natural gas replace coal in our power generation plants. The big losers are coal mining jobs and the rate payer.
Oil and gas companies need to be wary of the gift they are seeking. They are the next targets on the “greens” hit list.
Pingback: Where Does the Warming Come From? « Federal Way Conservative
George,
“The entire AGW proposition rests on the assertions of a handful of people at NOAA and GISS. ”
Isn’t that a bit USA-centric, and ignores the thousands of European, Asian and Australian scientists who affirm AGW?
Indeed, the vast majority of the world’s population care not a whit how temperatures in the US are measured.
George Lloyd: The entire AGW proposition rests on the assertions of a handful of people at NOAA and GISS.
Toby: Isn’t that a bit USA-centric, and ignores the thousands of European, Asian and Australian scientists who affirm AGW?
Indeed, the vast majority of the world’s population care not a whit how temperatures in the US are measured.
No, because the U.S. fraction of temperature stations has been vastly greater than the U.S. fraction of world land area, and all those foreign scientists rely enormously on the temperature record as adjusted by James Hansen et al. in the U.S. and others in the U.K.
Sorry, but that makes no sense. Just because there are more stations in the US doesn’t change the weight of the US temps. It’s still less than 2% of the Earth’s surface, and that’s all the weight it gets.
Goddard is not even being original. this is a re-hash of something in the public domain for two years …
Skeptical Science – 1934 is the hottest year on record (basic)
Skeptical Science – 1934 is the hottest year on record (intermediate)
National Temperature Trends: The Science Behind the Calculations
—
Why such changes occur is rooted both in the way the observations are processed for quality and the delay in receipt of data on paper records from many stations. The observations come from the U.S. Historical Climatology Network (USHCN), a network of 1221 climate observing stations in the continental United States. These data are extensively quality controlled for errors and for small biases that may have occurred through time due to artificial changes at each observing station. These artificial changes include station relocations, different instrumentation, and changes in the landscape surrounding the station (e.g. urbanization, removal or planting of vegetation, etc.). Some of these changes may result in “random” changes to the data. For example, even small station relocations can result in temperature readings that are either slightly cooler or slightly warmer than what would have occurred at the former site. Other changes, such changes in urbanization in the vicinity of the station or changes in observing times, can systematically affect temperatures, e.g., add an urban warming bias to the temperature trends. Research has shown that the data from these kinds of changes can be corrected to a large degree based on physical and statistical methods (e.g., see Peterson 2006).
Methods that have been used to correct temperature data are described in more than a dozen peer-reviewed scientific papers by NOAA’s National Climatic Data Center (NCDC). A series of data corrections was developed to specifically address potential problems in trend estimation of the rates of warming or cooling in the USHCN. They include:
1. Station moves and instrumentation changes (Karl and Williams 1987, Quayle et al. 1991),
2. changes in observing practices, such as observing time changes (Karl et al. 1986), and
3. urbanization (Karl et al. 1988).
These data correction schemes have been applied to the USHCN to determine temperature trends across the United States up until the end of 2006. Beginning in 2007 improved correction schemes for items 1 and 3 above have been applied to the USHCN observations (Menne and Williams 2005, Menne and Williams 2007). They have been shown to improve our ability to monitor climate change and variations. Because different algorithms were used in making corrections to the station data in 2007 there are small differences in annual average temperatures between the older corrections (Version 1) and newer Version 2 corrections. These small differences in average temperatures result in minor differences in annual rankings for some years. The new correction scheme has virtually no impact on the long-term temperature trend as annual temperature trends in Version 1 from 1895-2006 were 0.112°F/decade and in Version 2 the trends were 0.110°F/decade.
—
U.S. Climate Extremes Index, National Oceanic and Atmospheric Administration, National Climatic Data Center
—
Mean maximum and minimum temperature stations were selected from the U.S. Historical Climatology Network (USHCN) (Karl et al. 1990). Stations chosen for use in the CEI must have a low percentage of missing data within each year as well as for the entire period of record. Data used were adjusted for inhomogeneities: a priori adjustments included observing time biases (Karl et al. 1986), urban heat island effects (Karl et al. 1988), and the bias introduced by the introduction of the maximum-minimum thermistor and its instrument shelter (Quayle et al. 1991); a posteriori adjustments included station and instrumentation changes (Karl and Williams 1987). In April 2008, maximum and minimum temperature data from the USHCN were replaced by the revised USHCN version 2 dataset.
—
So no “Thermometer Magic”, but scientifically accepted data correction.
If you were right Charlie then the same warming would show in other data sets, not just the American government sets. But it does not.
And here is a comparison between direct surface measurements and satellite measurements from 1975 until now.
Satellite records don’t go back to 1975. Sorry Charlie.
1975 is close enough. They go back to the late 1970s. Anyway, Charlie seems to be talking about the graph showing the comparison, not actually claiming that the satellite measurements go back to 1975.
it’s ‘manmade’ global warming. but not how you’re thinking :
http://www.youtube.com/watch?v=OTxCg6YHOCI
creating warming:
http://www.youtube.com/watch?v=AsQfr7wRZsw
“Confirmation bias” means “yes, we’re biased”
Pingback: TWAWKI » Global Cooling and the New World Order
Since the “adjustment” took place in 2000, Y2K must be the culprit here!
Just discovered your site. Appreciated your articles at WUWT and you are carrying on with your great work here.
This article is excellent, with visuals worth a million words, as is your ‘comedy’ piece about the Greenland comparison.
Hope these articles get spread as widely as possible because it is graphics like this that most effectively reach the public – as the inventors of the hockey stick knew.
Pingback: AMO Impacts Temperatures Globally – CO2 “Gets No Respect”
I am a retired chem/physics teacher. Have been the flip side presenter in schools to Al Gores’ IT.
I can just copy the graphs located here. However, I would like to find the info somewhere so that I can say that I got it directly from GISS. Can you help?
In light of challenges being made to New Zealand temp record and records elsewhere, I would love to see IPCC contributors being forced to adjust 20 the century worldwide record. Perhaps someone (like Steve M) can get all the info and rewrite it!
The NASA hyperlinks are in the article. Just click on them to get to their graphs.
Pingback: Climate Scientists Caught Red-Handed « Lonnie Walker's Blog
Pingback: From On High
Steve,
It’s not just that the adjusted data changes an ordinary data set to an extra-ordinary one which potrays warming of an unprecendented nature, that then adds weight to the AGW tag-line, what I think completes the story you are trying to tell is the fact that the non-adjusted data fits well with models that are used without CO2 forcings, whereas the adjusted data fits well with the models that do model for CO2 forcings:
http://www.whrc.org/resources/primer_fundamentals.html
Scroll down to figure 2
Take out the 0.5 C or so adjustment from the recorded temp data and the models are way off the mark, add it in incrementally and they all of a sudden the models become spot-on.
It’s one hell of a coincidence that the human, supposedly obejective, ajdustment of the temperature record end up being responsible for the validation the models they use to prove AGW theory to the IPCC and the rest of the world.
It is certainly evident that a certain group of individuals have purposely manipulated surface temperature records with the objective of reinforcing the idea that global warming has been happening as the level carbon dioxide in the atmosphere has been rising.
There is only one word to describe what they have done. FRAUD! But who is going to do something about it?
I take my hat off to all those scientists who have not fallen under the spell of the IPCC mantra… scientists who have bravely spoken out about the corrupt processes and practices of those holding themselves out to be doing objective science as they blindly swirl in that global warming time warp in which they have been trapped.
Instead of removing the heat island efect from urban stations, they chose to add the heat island effect to the ruralized stations. Since the heat island effect increases with poulation growth it adds another distortion to the data. Perhaps it should be thrown out completely.
Another distortion occured when almost half of the rural stations, especially in Russia were discontinued in the 80’s. Rural stations should be the norm for measuring global temperatues.
Pingback: Thermometer Magic « The Invisible Opportunity: Hidden Truths Revealed
So Steve, If 1934 was so much warmer than it is today, then why is the polar sea ice disappearing?
Polar ice has been disappearing for 15,000 years.
Has anyone audited the GISS adjustments? Sounds like a job for superma—-er ah Steve M.
Pingback: Global Warming Hoax Weekly Round-Up, Sep.30th 2010 « The Daily Bayonet
please repost this and include current data. This kind of travesty needs to be kept in face of the alarmists.
Reblogged this on Tallbloke's Talkshop and commented:
Steven Goddard lays out the ‘adjustments’ issue with temperature data in a simple and clear fashion.