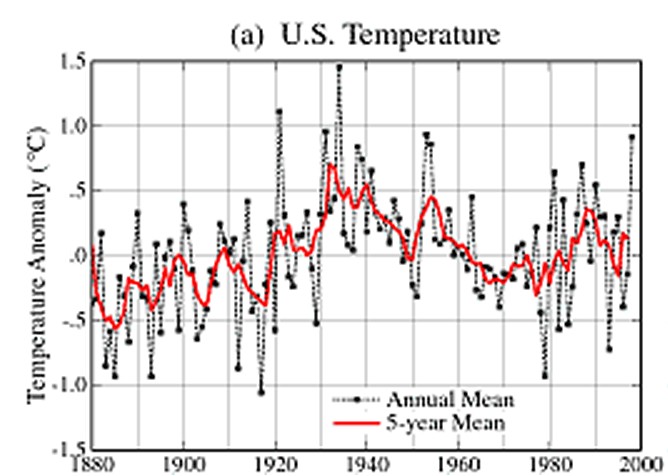
In 1999, NASA published this graph of US temperatures, which showed a seventy year cooling trend – with 1934 as the hottest year and 1998 almost 0.6C cooler.
NASA GISS: Science Briefs: Whither U.S. Climate?
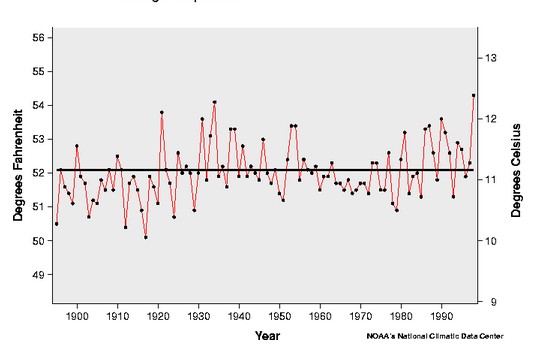
Current NOAA graphs look very different, with no cooling trend – and 1998 hotter than 1934.
CONTIGUOUS UNITED STATES Climate Summary
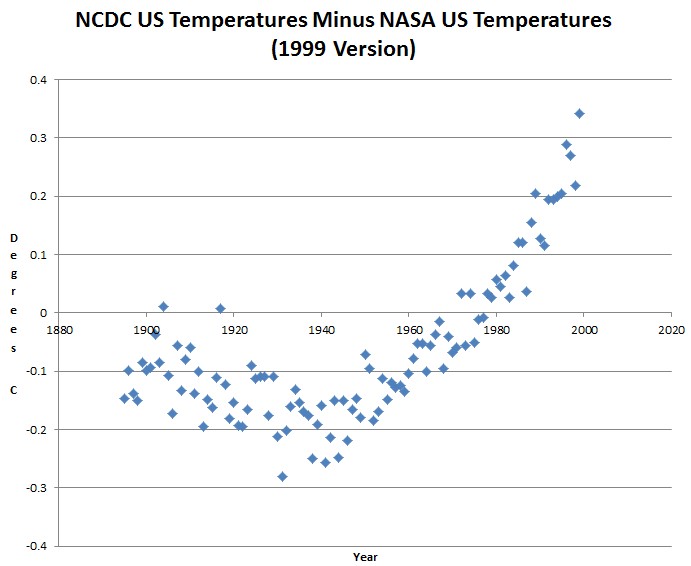
NOAA achieved this by tampering with the data. The graph below quantifies the tampering which has gone on since 1999.
They cooled the 1930s by almost 0.2C, and since 1940 they have been exponentially increasing the tampering – in an obscene hockey stick of scientific fraud.
It is bad enough that they do it, but even worse is that they do not tell the press that they have altered the data. There should be a disclaimer with every NOAA press release saying
US thermometer data shows no warming. The warming trends we are showing you were generated by global warming activists who have infiltrated NOAA and destroyed any hope of honest science.


It’s due to a process known as Appellization, where thermometers become increasingly unreliable, and people are becoming too stupid to read them properly, as time goes on.
Appellizers recognise that back in ancient times, circa., 1999, the science of temperature measurement was not well understood.
Well Bill Nye and his bowtie said “We’re not talking about the temperature” to Marc Morano on CNN just recently.
It’s scary when the bowtie has a higher IQ than the talking head…
😆
Thermometers are dangerous. Did you hear about the Georgia school that was shut down because a kid brought a thermometer to class for a project? We have passed the tipping point of complete insanity. They even called in a hazmat team.
Steven, I’ve been following your documentation of this ongoing fraud and very much appreciate you bringing this to light. My question is this: What now? Through your contacts, have you tried to get an explanation from anyone in NOAA regarding all these temperature adjustments?
What you have documented is a Rosetta Stone of truth. What can you/I/we do now to combat this trend other than simply documenting it?
You do great work and I appreciate your efforts, your perspective and your damned funny sense of humor!
They have some documentation, but the actual adjustments don’t even vaguely resemble what they say they are doing. The actual adjustments are about 400% of what they document.