
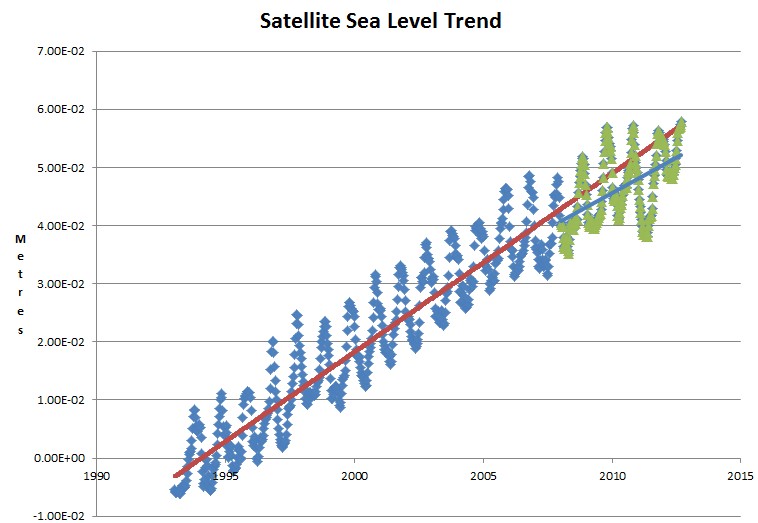
The claim that sea level rise has increased since the 2007 IPCC meeting, is complete garbage. The post 2007 trend (light blue) is less than the 1993-2007 (red) trend.
The claim that sea level rise has increased since the 2007 IPCC meeting, is complete garbage. The post 2007 trend (light blue) is less than the 1993-2007 (red) trend.

Yes, but you are not using enough years. The IPCC AR4 was released in 2007. It required all peer reviewed papers to be published in 2006. Those papers were based on processed data, which was only available through 2004 or 2005.
Fortunately, the U.S. Department of Commerce National Oceanic and Atmospheric Administration (NOAA), National Environmental Satellite, Data, and Information Service (NESDIS), Center for Satellite Applications & Research (STAR), Satellite Oceanography and Climatology Division (SOCD) and Laboratory for Satellite Altimetry (LSA) have thoughtfully already completed this work, and as pointed out by a previous commenter here, found a sea level trend from Jan 2005 thru Dec 2011 of about 1.4 mm/year.
It is worse than you thought.
The NOAA 2012 report is here. The numbers given in the text (1.3 mm/year) don’t agree with those in their Table 1. Fortunately, they present a time series of the satellite data, 2005 – 2012, which agrees with the 1.6 mm/year given in the Table 1. This is nitpicking, of course, since the uncertainty is +/- 50% (i.e., 1.6 +/- 0.8), and, as with all the climate science data, the large uncertainty stands out as a major problem.
Gore save us! 140mm by 2112? That’s nearly 6 inches! The earth will be submerged, drowning Billions! If they lay their head down at the current high tide line and wait 100 years that is…if the Human race can’t cope with the sea rising by 6 inches, then we really are a mess.
Yep, the sea level rate of rise has steadily decreased for several years now. One can see the same change in the rate regardless of what year one starts at. http://suyts.wordpress.com/2012/11/28/delusional-climate-nutters-publish-paper-by-ignoring-facts-and-self-confirming-sea-level-rise-worse-than-we-thought/
I remember finding a serious glitch on NASA’s web site that cut tide gauge data off, and included it in one of my post card graphics:
http://s15.postimage.org/cqazn8ncb/Sea_Level_Two.jpg
The NASA page: http://climate.nasa.gov/keyIndicators/
Nice graphic, I like the Hansen picture on it.
Good news today!
Hansen will no longer need to invent bogus polar temperatures using a climate model. He can simply ask North Korea for the actual temperature data they gather with their new polar-orbiting scientific satellite. It could be part of NASA’s new outreach program.
“In the announcement attributed to a spokesman for the Korean Committee for Space Technology, North Korea said the rocket would carry a ‘polar-orbiting earth observation satellite’ for ‘peaceful scientific and technological’ purposes,” reports the Los Angeles Times.