
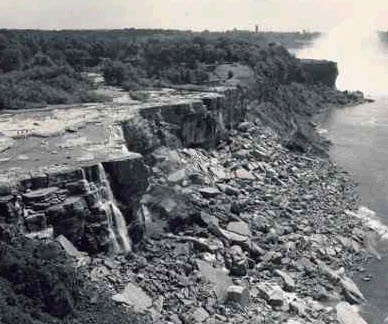
On this date in 1903, Niagara Falls ran dry. CO2 was a very safe 300 PPM at the time.
The Post and Courier – Google News Archive Search
On this date in 1903, Niagara Falls ran dry. CO2 was a very safe 300 PPM at the time.
The Post and Courier – Google News Archive Search

Drought because of no rain or hot weather or low CO2.
Drought because the weather patterns shifted. In some cases the patterns shifted for hundreds of years. The American Southwest, has a history of mega-droughts that last for decades and even centuries.
Other areas also have histories of drought. (Usually the rain moves elsewhere)
Solar forcing of the Indian summer monsoon variability during the Ållerød period September 2013
Similar paper from 2001: Evidence for solar forcing on the Indian monsoon during the last millennium (wwwDOT)researchgate.net/publication/222398591_Evidence_for_solar_forcing_on_the_Indian_monsoon_during_the_last_millennium/file/504635180ac84c9953.pdf
FROM CHINA:
The Holocene Asian Monsoon: Links to Solar Changes and North Atlantic Climate
(wwwDOT)sciencemag.org/content/308/5723/854.abstract
Influence of solar activity on breaching, overflowing and course-shifting events of the Lower Yellow River in the late Holocene
hol(DOT))sagepub.com/content/23/5/656.abstract
But what is it doing as CO2 surpasses 400 ppm (again)? http://www.dailycamera.com/news/boulder/ci_25397460/boulder-scientists-report-record-early-high-co2-readings
CO2 will probably accelerate the present cooling trend slightly, in the years ahead.
They don’t realise that the more they report the high co2 the more people look for the ‘rise’ in the thermometers. 🙂
C’mon folks, let’s stop talking the Warmists talk.
Face it, CO2 don’t mean DICK as far as global atmospheric temperatures. CO2 has risen 10 percent in the last 17 years while global temps (satellite data only – no fudged NOAA/NASA crap data!) have gone nowhere.
Ice core data show that temp moves up/down hundreds of years before CO2 rises/falls – so clearly temp determines CO2, not the other way around.
That’s it. Everything else is Leftist propaganda
Don’t forget the CO2 records are as artificial as Mann’s hockey stick.
http://doctorbulldog.wordpress.com/2008/12/10/exposing-the-global-warming-myth-co2-levels/
The Hoax is made out of faked data. It has set real science back by decates because all the correlations with temperature and CO2 data are based on faked data.
Now they are “Adjusting” the solar data too.
Lysenkoism has invaded all the science.
March 30, 1848: Niagara Falls Runs Dry
http://www.wired.com/thisdayintech/2010/03/0330niagara-falls-stops
Strong southwest gale winds had pushed huge chunks of lake ice to the extreme northeastern tip of Lake Erie, blocking the lake’s outlet into the head of the Niagara River. The ice jam had become an ice dam.
A quick check of facts on the internet show this story to be false. We know the American Falls were turned off in 1969 and before that it is reported the Niagara River lost flow due to an ice dam at the mouth of Lake Erie. But, nothing remarkable occurred to the American Falls in 1903. Steve got hoodwinked. Surprising, because he seems sharp enough to catch errors.
Steven,
At the Library of Congress, the closest I could find was a reference to dry falls was due to the construction of Wing Dam. Also discussed is reduced water over the falls due to new power plants and Chicago Canal, but nothing about dry falls due to drought.
http://chroniclingamerica.loc.gov/lccn/sn83030214/1903-03-29/ed-1/seq-17/#date1=1903&index=5&rows=20&words=Falls+falls+FALLS+Niagara+NIAGARA&searchType=basic&sequence=0&state=New+York&date2=1904&proxtext=niagara+falls&y=10&x=15&dateFilterType=yearRange&page=1
More confirmation at trove. The dry bed in 1903 was due to construction of a wing dam so that hydroelectric power plants could be constructed.
trove.nla.gov.au/ndp/del/article/133365672?searchTerm= (niagara falls) date:[1903 TO 1904]