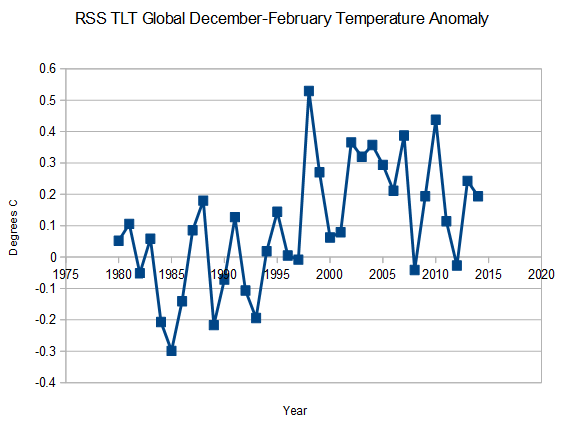
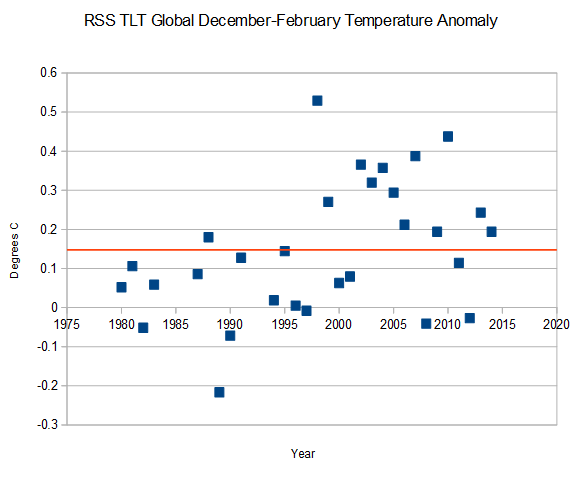
Cold? What cold? Most of the globe had a mild winter
The central and eastern USA shivered through a colder-than-average winter, but most of the rest of the globe did not share in the chill, registering the eighth warmest overall winter on record.
Globally, Dec-Feb was actually very close to the median since the 1970’s ice age scare.
Excluding the volcano cooled years, the past Dec-Feb was just above the mean since 1979. There is no global warming story here, but the usual government fraudsters spun it into one.


What is interesting is the Earthshine Project albedo data. Note the inflection point at 1997-98 the time of the Super El Nino.
albedo = Ice + Clouds.
There is a connection between the sun and clouds:
Another paper:
and the new NASA paper – – science(DOT)nasa.gov/science-news/science-at-nasa/2013/08jan_sunclimate/ – So the Sun does directly affect the Polar Vortex.
Still another paper:
Effect of Drake Passage on the global thermohaline circulation.
The West Wind Drift (aka Antarctic Circumpolar Current) is the wind driven current around Antarctica. The Humbolt current splits off from the West Wind Drift as it flows past Cape Horn (Drake passage) The Humbolt current “is a cold, low-salinity ocean current that flows north along the west coast of South America from the southern tip of Chile to northern Peru.” (WIKI) The deep sea Cromwell current, the Panama current, and the Humboldt current meet at 0 and 90W (Galapagos) and therefore a strong Humbolt current influences ENSO (El Nino/La Nina)
The West Wind Drift also influences the North Atlantic.
CO2 WHAT CO2? I see solar driven wind and clouds influencing the oceans and global weather.
Let’s make an experiment. /1/ Link test with 2 links,
“http://nsidc.org/data/seaice_index/images/daily_images/N_daily_extent_hires.png”
“http://nsidc.org/data/seaice_index/images/daily_images/S_daily_extent_hires.png”
sorry, (now without quotes)
http://nsidc.org/data/seaice_index/images/daily_images/N_daily_extent_hires.png
http://nsidc.org/data/seaice_index/images/daily_images/S_daily_extent_hires.png
now, with 4 links
http://nsidc.org/data/seaice_index/images/daily_images/N_daily_extent_hires.png
http://nsidc.org/data/seaice_index/images/daily_images/S_daily_extent_hires.png
http://weather.unisys.com/surface/sst_anom.gif
http://weather.unisys.com/surface/sst_anom_new.gif
now with 9 links,
http://nsidc.org/data/seaice_index/images/daily_images/N_daily_extent_hires.png
http://nsidc.org/data/seaice_index/images/daily_images/S_daily_extent_hires.png
http://weather.unisys.com/surface/sst_anom.gif
http://weather.unisys.com/surface/sst_anom_new.gif
http://ocean.dmi.dk/satellite/plots/satanom.gbl.d-00.png
http://arctic-roos.org/observations/satellite-data/sea-ice/observation_images/ssmi1_ice_ext.png
http://ocean.dmi.dk/arctic/plots/meanTarchive/meanT_2014.png
http://ocean.dmi.dk/arctic/plots/icecover/icecover_current_new.png
http://ocean.dmi.dk/arctic/plots/icecover/icecover_current.png
All links passed and are working fine.
I see no problems with the number links.
I changed the settings to accept four links
Thanks for the links.
/1/ O3 is probably the 2nd most important GHG, after water.
/2/ Good to know about the Humbolt current and its influence on ENSO. I had already an idea that “something” coming from Antarctica was influencing ENSO and now you gave the name of the force!
They say “a strong Humbolt current influences ENSO”, I have been following the UNISYS analysis,
http://weather.unisys.com/surface/sst_anom.gif
for more than 2 years and when people in 2012 were talking about an El Nino – as they continue to say that it’ll happen this year, etc., and they are always wrong! – I could “see” in the analysis that it would probably not happen, due to the cold waters coming from Antarctica. I believe we may conclude that the present “Humbolt current” is “strong”. 🙂
The trend has increased in 2013 and the “anomaly” is now similar to 1 year ago. This suggests IMO that the influence could be connected with Antarctica ice extent, in particular in the region of Antarctica “close” to the Drake Passage.
An extended region of MYI has been created there,
http://www7320.nrlssc.navy.mil/GLBhycom1-12/navo/antarcsst/nowcast/sst2014032018_2014032100_910_antarcsst.001.gif
with a steady trend of growth in the recent years, compare February maps (peak of melting season) in the following list,
http://www.climate4you.com/SeaIce.htm#Southern%20Hemisphere%20Monthly%20Sea%20Ice
and increasing cold anomalies,
http://climate4you.com/Polar%20temperatures.htm#AntarcticMonthlyTempChangeSouthOf50S
The trend seems to have started in 2011.
Darn
I had three live links so I got booted into a snow bank again.
At least the polar bears seem to be thriving:
http://www.evilmilk.com/pictures/Saw_A_Whale.jpg
“Most of the globe had a mild winter”
True, if you include the Southern Hemisphere.
During which time it was summer.
I’d not be surprised if *that* was what they were really thinking.
BTW, NH snow cover seems very close to last year’s,
http://climate4you.com/SnowCover.htm#Recent%20northern%20hemisphere%20snow%20cover
which was the 4th snowiest since 1967,
http://icecap.us/images/uploads/Screen_shot_2013-05-30_at_9.42.56_AM.png
It’s still cold and miserable where I am – and that’s not in the US. (In fact it’s very close to one of those red splotches on the USA Today map.)
And here’s a recent report from inside one of those red splotches:
AGW in Gstaad
stevengoddard says:
I changed the settings to accept four links
>>>>>>>>>>>>>>>>
THANKYOU, THANKYOU, THANKYOU,… {:>)
The 97-98 “inflection point” goes away if you back out the massive adjustments Steve has been documenting.