
Disrupting the Borg is expensive and time consuming!

Google Search
-
Recent Posts
- One Atomic Bomb Per Hour
- New Video : Analyzing Oil And Gas
- Is Antarctica Melting?
- High Speed Analysis And Visualization
- El Nino To The Rescue?
- Fake News Update
- Growth Of Antarctic Sea Ice
- 65 Years Of Progress!
- El Nino To The Rescue?
- Worst March Drought On Record
- ChartGL Process Control Demo
- The Biggest Money Laundering Scam
- Drought In The Headwaters Of Lake Powell
- Unrealistic Expectations Of Water Availability
- Did Bill Gates Do This?
- Worst March Drought On Record In The US
- The Real Hockey Stick Graph
- Analyzing The Western Water Crisis
- Gaslighting 1924
- “Why Do You Resist?”
- Climate Attribution Model
- Fact Checking NASA
- Fact Checking Grok
- Fact Checking The New York Times
- New Visitech Features
Recent Comments
- Bob G on One Atomic Bomb Per Hour
- Disillusioned on One Atomic Bomb Per Hour
- Disillusioned on One Atomic Bomb Per Hour
- Bob G on One Atomic Bomb Per Hour
- arn on One Atomic Bomb Per Hour
- Bob G on One Atomic Bomb Per Hour
- Mike Peinsipp on One Atomic Bomb Per Hour
- Mike Peinsipp on One Atomic Bomb Per Hour
- Bob G on One Atomic Bomb Per Hour
- John Francis on One Atomic Bomb Per Hour
That ice cube would have saved 3 drowning polar bears
http://glacierchange.wordpress.com/2012/08/27/zachariae-isstrom-further-retreat-ne-greenland/ must keep eye on this season
just to detail. Lack of sea ice resulted in more calfing or greenlands galciers the author of study surmises.
calving, even.
Can they really distinguish between slipping glaciers and rapidly growing ones? When a glacier grows out over the sea surface, it is subject to calving.
At the risk of repeating myself Steve, what’s the difference between 15% and 100%?
What’s the formula for volume for that matter. If I recall my school physics lessons correctly it doesn’t include a term for “extent”.
You still planning to ride a jet-ski to the North Pole by 2016?
I have never ridden a jet-ski, and have no intention of so doing in the foreseeable future.
What’s the surf like in Svalbard? That sounds like much more fun!
….about like it was in 1922:
“..There were few seal in Spitsbergen waters this year, the catch being far under the average. This, however, did not surprise the captain- He pointed out that formerly the waters about Spitsbergen held an even summer temperature of about 3 Celsius; this year recorded temperatures up to 15, and last winter the ocean did not freeze over even on the north coast of Spitsbergen.”
docs.lib.noaa.gov/rescue/mwr/050/mwr-050-11-0589a.pdf
uh, what’s the difference between man’s 4% contribution of CO2 and Earth’s 96%? What’s the difference (in years) between the warmest all time temp records in history (for every continent) and today? What’s the difference in ice coverage for the Great Lakes or Antarctica this year vs historical average? How many years now since “The Pause” began?
This thread is about “missing ice cube[s] in the Barents Sea”. Please could you stick to the subject?
Err, Lazy, you’re the one who can’t tell the difference between 15% & 100% & had to ask about it. Maybe you could explain to the class what the correct amount of sea-ice is.
LOL!!!
That’s what a silly person would say if s/he didn’t understand the meaning of Steve’s post!
Good one!!!
BTW, you’re good at making jokes Snow White, you should come here more often! 🙂 🙂 🙂 🙂
Thanks for the compliment Dmh! It makes a pleasant change around here I must say.
What is the meaning of Steve’s post? It looks to me like a humorous one liner accompanied by a largely irrelevant image, with “Real Science” being conspicuous only by its absence.
The meaning of Steve’s post is that the ice extent on the Arctic is close to normal- for this time of the year- and, to be sure, you can check the DMI data
http://ocean.dmi.dk/arctic/plots/icecover/icecover_current_new.png
and
http://ocean.dmi.dk/arctic/plots/icecover/icecover_current.png
and NORSEX
http://arctic-roos.org/observations/satellite-data/sea-ice/observation_images/ssmi1_ice_ext.png
The extent is slightly below 2013 and 2012, but considerably higher than the low levels of 2007 and 2011.
2012, during the winter, is the best result since 2005 (possibly 2001, not sure) despite the problems during the summer, because IMO the ice was already recovering back then with close to average values around March-April since 2008.
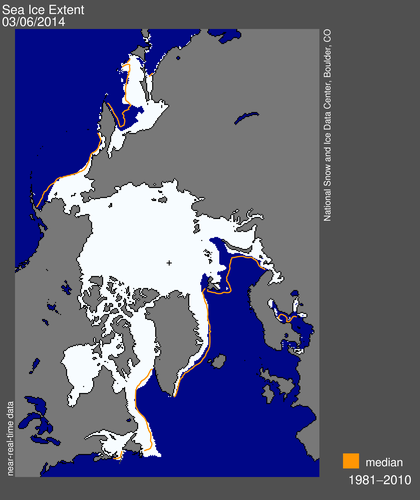
The term “ice cube” in Steve’s post is a metaphor to indicate that we need just a little more ice to reach the average (red line) of the chart of NSIDC.
Note that some parts of the glacier at the North of Canada is already a little above average.
By simply looking at the chart I’d estimate the ice extent to be nearly 500,000 km2 below average and, if it follows a similar trend to 2012 in the next few weeks, we could be above average at the beginning of April.
When glaciers recede, they gently melt and trickle away at the base. They don’t calve; that comes from growth.
This current map of warm waters entering the Barents matches the open water areas of the extent diagram.
http://www.regjeringen.no/Rpub/STM/20012002/012EN/HFIG/fig2-1.gif
Send Al – Not really like it was in 1992 in the Barents Sea – http://igloo.atmos.uiuc.edu/cgi-bin/test/print.sh?fm=03&fd=06&fy=1992&sm=03&sd=06&sy=2014
Stark – The question was addressed to Steve not you. It seems he’s the one who doesn’t know the difference though. Why else would he illustrate an article about “missing ice cubes” with a “map” showing sea ice extent?
Snow White, let me explain. Global warming idiots have interesting units of measure. One Hiroshima is a unit of heat, a Manhattan is a unit of area, all such units are meant to alarm and exaggerate. An ice cube is a volume of ice smaller than a Manhattan, in fact you can fit a whole glass of ice cubes in a manhattan, even more in a margarita.
Danger, Will Robinson! Error! Error!
http://www.convertunits.com/from/cubic+kilometer/to/manhattan
http://www.convertunits.com/from/cubic+kilometer/to/margarita
We’re doomed!
Snow White, are you Reggie of Brawndo fame? Tony B? Come on, tell the truth now.
The blowtorch seems to have flamed out this year. What do you suppose the ice fishing is like on Lake Superior this year?
And be sure to address me by my full name: Send Al to the Pole, or you can use my nickname: Feed Al to a Polar Bear. 🙂
My profuse apologies for my evidently erroneous attempt to parse your Christian name from your nom de guerre. FYI mine is neither Reggie nor Tony.
I have never been ice fishing on Lake Superior, so I’m really not qualified to comment.
Snow White says:
March 8, 2014 at 8:35 pm
Gosh, I’m awful sorry for posting on your weblog, dimbulb. Maybe you would care to ban me, or put my comments in moderation, asshat.
So, please tell us, penis breath, what is the magical difference between 15% and 100% that you know that none of us know? Enlighten us with your wisdom, Lazy.
Tsk, tsk. That’s no way to speak to a lady. The answer is 85%.
However to save you (and Steve) any unnecessary effort, I suggest you try Google to ascertain the relevance to this thread. This might be a good place to start your education: https://www.google.com/search?q=sea+ice+extent+15%
If you can summon up the energy, click the link and then read the NSIDC FAQ.
So, let’s sum up Lazy’s MO:
Steven Goddard posts about ice extent.
Lazy screeches, “You don’t understand the difference between area and extent!”
Seven posts about ice volume.
Lazy screeches, “Why don’t you post about extent?”
Steven posts about area.
Lazy screeches, “You didn’t say anything about volume!”
& so on.
It must be nice being lazy & illiterate.
A good place for you to start your ‘education’ is understanding that NSIDC only stores ADJUSTED data from NASA/NOAA. I prefer empirical data that hasn’t been contaminated by Mann. But hey, if you like your scammer, you can keep your scammer…period.
According to “cryosphere”
http://arctic.atmos.uiuc.edu/cryosphere/IMAGES/seaice.anomaly.arctic.png
the ice extent is nearly 1 million km2 below average.
Now, considering that Greenland has an area of approx. 2 million km2, I don’t see how those little areas in the map would add to 1 millon km2.
Where are the missing square-kilometers?
They need to add the great lakes to the total.
Dear Dmh,
You are far more polite than Stark, and you treat a lady with the sort of respect she deserves. I’ll converse with you instead if I may. Thanks for your patient explanation. Here’s the thing (well, 2 things actually)
1. Steve’s “map” shows the NSIDC Arctic sea ice extent, but you make no mention of it. Perhaps that’s because that particular metric is currently at the lowest it has ever been on this day of any year since the satellites started attempting to measure it? How on Earth can he possibly characterize that as any sort of “recovery”?
http://GreatWhiteCon.info/2014/03/the-arctic-sea-ice-recovery-vanishes/
2. Surely the very title of this thread (“ice cube”) implies a volume, does it not? I believe Steve’s an engineer, and so he is presumably well aware that a square and a cube are completely different kettles of fish (metaphorically speaking)? All that being the case, why on Earth would Steve choose to illustrate his point with a “map” of ice extent instead of a “graph” of ice volume?
Yours in confusion,
Snow White
No confusion needed Snow White, but you have to follow my entire comment to understand what I’m saying.
I gave you the graphs of DMI and NORSEX, which basically agree with the chart posted by Steve and, if you look carefully and compare with previous years, you’ll see that they show important recovery especially from 2007 and 2011.
The Arctic ice extent is present nearly 500,000 above 2011 levels and ~ 1 million above the big dip of 2007.
That’s good recovery IMO. It’s only slightly below 2013 for this period, and is growing similarly to 2012, which brings good prognostics for April-May.
If we’re lucky with solar radiations, we could have levels at peak melt in the summer close to 2005-06 levels, even greater than last year’s.
The recovery is obvious, but we must look with unbiased eyes to see that it’s happening.
One important factor is that the MYI is much better positioned than 2 years ago,
http://stevengoddard.wordpress.com/2014/03/07/arctic-ice-recovery/
and remember, despite all bad positioning, with favorable winds in 2013, we had a 60% increase in the ice extent at the peak of the summer melt last year, because the polar regions of Earth are getting colder (can you imagine that? Both at the same time.).
Now, if the ice is thin as your link suggests, then it’ll melt in the summer, right?
OTOH, I don’t think we can say what the summer will bring until it comes, do you agree?
Then, let’s wait and see if the article you cited is correct or Steve’s analysis, and the analyses of all “skeptics” in this blog (me included) are right.
The two analyses go in exact opposite directions, Either we are right or the analysis of the link you posted is right and in a few more months we’ll know.
The reason for such a radical divergence when looking at the same object?
Well, If you follow this blog you should know already.
Please can we try and get our facts straight before we attempt any sort of analysis?
1. Is the NSIDC daily Arctic sea ice extent number for March 8th 2014 the lowest on record for that day of the year? Yes or No?
2. Is the Cryosphere Today Arctic sea ice area number for March 8th 2014 the lowest on record for that day of the year? Yes or No?
3. Is the IJIS Arctic sea ice extent number for March 9th 2014 the lowest on record for that day of the year? Yes or No?
Cat got your tongue Dmh? Shall I’ll take that as a triple YES then? Evidently, when comparing like with like for a change, the NSIDC Arctic ice extent is at present below 2011 levels for the same day of the year, below 2007 levels, and below the level of every other year since satellites started recording such things. Some “recovery”!
I agree it hasn’t always been that way, but remember that in fact we had a 29% increase in the ice extent at the peak of the summer melt last year, compared to the record low of 2012. At least Steve finally managed to get that bit right!
http://stevengoddard.wordpress.com/2014/03/04/shocking-increase-in-arctic-ice-dooms-the-planet/
For Snow White, ice in the Arctic started in 1979. There is no historical and/or scientific references or research for Arctic ice prior to that year.
You *believe* what you want SW, I trust the facts and the facts say exactly the opposite of what you just said.
Isn’t that strange that you come here trying to pass as a logical person and nonetheless you cannot even see the facts as they present themselves.
What kind of behavior is that, deceptive? Are you here to spread your deception and your unfounded *beliefs*?
You didn’t read my comments and didn’t follow the links I posted, therefore your comments make no sense and there is no possibility of dialogue here.
You’re here simply to try to propagate your delusions, but as I said in one of my previous posts, the peak of the summer is just a few months ahead.
Let’s wait and see what *facts* the summer will bring.
In true science the *facts* rule, I believe you know that.
I have no doubts in my mind that, unless something very unusual happen with the solar radiations, this year’s minimum ice will be close to 2005-06 (which are just a little below the normal levels of 2000-01).
In your comments you’re implying that it’ll not, but this is not my problem. You *believe* what you want.
I’m concerned with the polar icecaps and our planet, but I’m also 100% sure (meaning: no doubts whatsoever) that CO2 has no important effect on climate.
I’m very glad (for now) to see the great recovery of Arctic ice in 2013 (plus the expansion of the Antarctic ice to unprecedented levels) and the clear continuation of the recovery this year, despite the relative slowness of this first trimester- entirely due to solar radiations.
I don’t think there is any possibility of dialogue between you, SW, and us, the “skeptics” of this blog.
We speak totally different languages, and live in totally different worlds.
BTW, “ice cube” is a metaphor, it implies what the context suggests. If the ice is thin as you’re suggesting, then why it didn’t melt last year? (hint: if you’re following this site, this has been explained innumerable times)
Another thing, the recovery of the Arctic ice started in 2008. (guess why?)
2007 and 2011 are the only two years that you may logically consider as having bad ice extent during the entire year.
Brad – I’m well aware of when the satellite records started. However I’m afraid I’m going to have to disagree with you, since it sounds as though you’ve never come across the Historical Ice Chart Archive before?
http://www.climate-cryosphere.org/resources/historical-ice-chart-archive
“The earliest chart dates from 1553. Prospective users should consider the uncertainties related to the ice-edge definition, and to the difficulty of navigating in remote areas prior to the satellite era.”
We’ve now gone from Ice Extent to Ice Edge. Brilliant.
Dmh – I too look forward to what the facts in September 2014 reveal about the Arctic with much interest! You’ve stated your beliefs quite clearly, so thanks for that. Time will tell whether your “predictions” come true.
I haven’t mentioned CO2, so why do you bring that up? We’re discussing the facts about “Missing ice cube[s] in the Barents Sea” aren’t we? Getting back to the facts as they stand in March 2014, you still haven’t answered my numbered questions. Why is that?
You previously stated that “The polar regions of Earth are getting colder (Both at the same time)”. However the DMI Daily Mean Arctic Temperature graph that Steve was so fond of displaying last summer shows that temperatures north of 80 degrees have been way above “normal” all winter. See Gail’s link on the “Arctic Ice Recovery” thread you linked to.
4. Given that fact, what evidence can you provide that show “The Arctic is getting colder”?
Hugh – Steve seems happy enough to display data from the NSIDC. See the top of this thread!
5. In what way has the NSIDC’s data been “contaminated by Mann”?
6. Where might one find “empirical data that hasn’t been contaminated” if not from the likes of NOAA/NASA/JAXA et. al.
http://www.urbandictionary.com/define.php?term=catfish
You have somehow formed the opinion that I am not in fact a beautiful fairytale princess, but have nonetheless arrived here hoping to find love?
So The Great Lakes are not frozen then!
Well spotted Dave!
nah, it`s just a nasty little rash SW