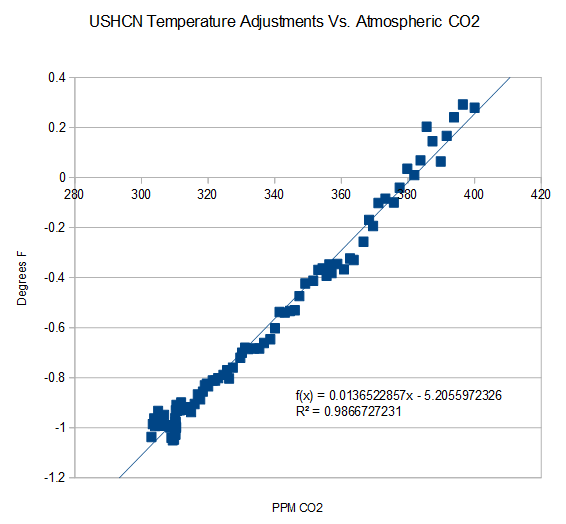
I wish I could say the data below is a joke, but it isn’t. USHCN temperature adjustments correlate almost perfectly with atmospheric CO2
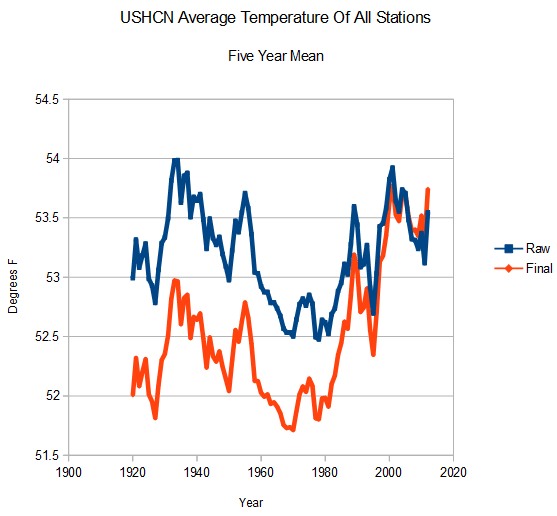
US temperatures have not warmed over the past century (blue line below) – but NCDC alters the data to create the appearance of warming (red line below)
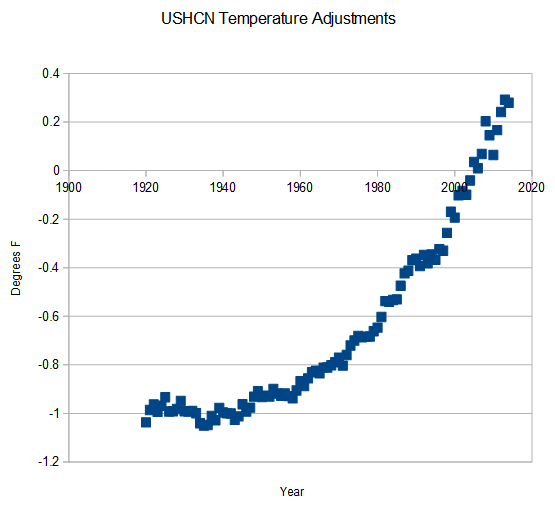
They accomplish this through a spectacular hockey stick of data tampering, which cools the past and warms the present.
Note the exponential growth of tampering, particularly over the past 15 years, which is very similar to the growth of CO2.
So I tried correlating the magnitude of the tampering with the amount of CO2 in the atmosphere, and found almost perfect correlation – shown below.
CO2 causes all kinds of great evil, but who would have guessed that it directly causes NCDC to release scientifically meaningless global warming propaganda?
Again, this sounds like a joke – but it isn’t. They are actually tampering with temperature data in unison with the rise in CO2. Difficult to believe this accidental.


This should be an obvious signal of assimilation.
Trust but verify……
Who is verifying?
We don’t have many options do we?
http://theoas.org/
Think about it….
Suggests that computer models, tuned to be CO2 sensitive, have been used to adjust temperatures.
Not only is that putting the cart before the horse, but the horse is pointing the wrong way.
in that case, the horse is before cart… ;0)
When so much of the data is fabricated by inserting values for stations that don’t report any numbers, I suppose they can use any algorithm they want to determine the “proper” trajectory the station.
They already stated that their algorithm is working as designed, clearly CO2 is a major component of that algorithm.
I have challenged both Mosher and Nick what’s his name to explain just ONE climate adjustment, with a link to the Iceland station.
When the ran and danced, flapping their arms like butterflies, I informed them I just asked them to explain the adjustments at ONE station, having failed that, I assured them that they could not explain the entire system to any reasonable person.
Galvin S. is a mathematician, and expert at manipulating numbers, lots of ways at GISS, selection process of dropping stations, filling in data, “adjusting raw,” rural station disappeared in massive station drop, so have to have more UHI, do not know about altitude or latitude at stations which were dropped by computer code, some dropped due to station moves, or in own words “These adjustments caused an increase of about 0.5°C in the US mean for the period from 1900 to 1990. … About half of that increase was due to information obtained about station moves (mostly from cities to airports where conditions were generally cooler)” You can just make up a dozen algorithms and pick the model to use which gives result you want, but I would guess there was something more scientific in methodology to lower prior temp. It was all done by computer algorism as they say, “GISS has neither the personnel nor the funding to visit weather stations or deal directly with data observations from weather stations.” “For station data to be useful for such studies, it is essential that the time series of observations are consistent, and that any non-climatic temperature jumps, introduced by station moves or equipment updates, are corrected for. In adjusted data the effect of such non-climatic influences is eliminated whenever possible. Originally, only documented cases were adjusted, however the current procedure used by NOAA/NCDC applies an automated system that uses systematic comparisons with neighboring stations to deal with undocumented instances of artificial changes.”
I do not know computerized threshold for comparative temp jump or deviation from nearby station leading GISS to drop a station, but UHI or localized AGW effect has a smaller daily variation than rural just like temp swings on moon are massive compared to earth, plus longer lived stations will statistically be more apt to be axed just by noise and normal variations as opposed to a documented moving of station to the airport or putting in a parking lot nearby since rolling the dice more often for a deviation.
Well, could only lower prior temps, but interesting the upward spike still over time follows through comparing GISS to more recent RSS satellite data and deviations in the records, so computer algorism or “adjustments” still working with upward bias on ’79 post data set intertemperally, but the game is up as more data is gathered from satellite – they will have to start explaining why the gap is getting bigger comparing GISS temp rising more than RSS, only will get worse with time as gap gets bigger. Maybe someone can get hauled in for some congressional testimony explaining things.
“It is enough that the people know there was an election. The people who cast the votes decide nothing. The people who count the votes decide everything.” Joseph Stalin
Hey JoeP! ““GISS has neither the personnel nor the funding to visit weather stations or deal directly with data observations from weather stations.”
Amazing… Just imagine what the scientific world would think if Lawrence Livermore Labs released a statement saying “we have neither the personnel nor the funding to check our lab equipment for accuracy or calibration.”
SG, Do you have any information about the new ultra-high quality temperature network in the US?
(sorry, I can’t remember the actual acronym)
I know its still only a short period, but a post on it might be interesting.
United States Climate Reference Network (USCRN):
http://wattsupwiththat.com/2012/08/08/an-incovenient-result-july-2012-not-a-record-breaker-according-to-the-new-noaancdc-national-climate-reference-network/
Currently, assuming 50% of station readings are wrong for whatever reason, then to provide an ‘accurate’ record the incorrect data must be adjusted to be in line with the correct data. As everyone knows that CO₂ is causing warming, then the incorrect data is that which shows no warming. Hence the near perfect correlation between CO₂ and the adjustments. Soon they will have sufficient data from the USCRN to be able to use that to make adjustments against, at which point I predict, global warming will cease.
What reason do they have for not adjusting every bit of data that comes in that does not correlate well with CO2?
RTF
Reblogged this on Centinel2012 and commented:
They have been doing this for a while now; I’m a late comer to this subject but it was observable in the data in 2010.
Well of COURSE it’s not accidental!
The have a concept that they have to prove. They cannot fudge the CO2 numbers that much (not sure if they’re fudging them at all, haven’t looked into it closely enough), so if temps don’t keep up with rising CO2 data, they have to do more fraud or else the spurious linear correlation between CO2 and their climatological “data” falls apart very quickly. All of their careers are riding on a continued “correlation” between temps and CO2.
They are fudging the CO2 numbers. (click on pdfs.)
http://www.warwickhughes.com/icecore/
That’s very interesting, but I was more thinking about the numbers out of Hawaii.
I remember, years before, seeing what you linked above and thinking, “That doesn’t look very good!” Still, I have not had the time to thoroughly investigate this. The results may be spurious, but it takes a lot more than that to prove scientific fraud.
Considering that we know for fact that the primary increase in CO2 (overwhelmingly) is due to outgassing from the oceans, I find it curious that they use CO2 measurements from the most remote and central part of the Pacific ocean that they can find, from one of the most volcanically active regions of the world, all the while claiming that this is justified because CO2 is a “well mixed gas”, when we also know that CO2 is not “well mixed” at all. [hmmm]…
But if you agree that CO2 is increasing, then there shouldn’t be any need for fraud to show an increasing trend in their results … ?
On the ‘reliability’ of current CO2 measurements Anna V may have an explanation for that in a comment at WUWT about the collusion going on. (Reminds me of the Temperature measurements.)
bubbagyro – an Analytical Chemist’s comment is also of interest:
http://wattsupwiththat.com/2010/06/04/under-the-volcano-over-the-volcano/#comment-403682
A comment further down is even more interesting:
Lots of info on CO2 on : http://www.co2web.info/
Historic CO2 measurements that are left out of the picture: http://www.biomind.de/realCO2/realCO2-1.htm
Allen MacRae: “… early 2008 I discovered that atmospheric dCO2/dt varied ~contemporaneously with average global temperature T, and CO2 lagged temperature by about 9 months.” – http://icecap.us/images/uploads/CO2vsTMacRae.pdf
This particular pdf looking at the dogma and politics behind the 70 years of CO2 measurement as well as the science. It is a very interesting read.
Tom V. Segalstad’s Carbon cycle modelling and the residence time of natural and anthropogenic atmospheric CO2: on the construction of the “Greenhouse Effect Global Warming” dogma. — http://www.co2web.info/ESEF3VO2.pdf
I wrote another comments on Mannua Loa CO2 measurements:
https://stevengoddard.wordpress.com/2014/08/03/arguing-about-the-accuracy-of-co2-measurements-is-pointless/#comment-401504
And finally the clincher: New Paper With Stunning Admission By Climate Alarmist Scientists: Actual CO2 Emissions Are Unknown; Please Send Money!
http://www.c3headlines.com/2010/06/new-paper-with-stunning-admission-by-climate-alarmist-scientists-actual-co2-emissions-are-unknown-pl.html
Dang, Sorry tony too many links again as usual.
This I thought was the clincher:
http://www.canada.com/nationalpost/news/story.html?id=25526754-e53a-4899-84af-5d9089a5dcb6
Since then Ferdinand Engelbeen has spent a lot of time trashing Dr. Jaworowski’s reputation with quite a bit of success. He always shows up on WUWT to make sure the CO2 record as written by Climastrologists is protected but never shows up for any other discussions. (Sort of like L. S. always shows up to protect Climastrologists declaration that the sun is constant and therefore has no effect on the climate.)
Dr. Glassman says this of Engelbeen in his article THE ACQUITTAL OF CARBON DIOXIDE (Do read the entire article plus comments)
They could just as easily have meant, “If you do work that spuriously suggests that good ice data that we believe in are really bad, then you could harm our cause.” Unethical and unscientific, yes. Proof of fraud, no. Not in my view.
I have more. It is in moderation.
“Unethical and unscientific, yes. Proof of fraud, no…”
And if no one is allowed to dig then actually proof of fraud will never appear. Mikey Mann and the millions backing him being a case in point.
It is not just one bit of evidence it is all the evidence from the cherry picking of low historic values by Callendar who in 1938 revived Arrhenius hypothesis of greenhouse warming due to man’s activity to the continued cherry picking going on today at the explicit direction of politicians.
Probably the biggest clue is that instead of actually debating the science and having open discussions and scientific investigations we have mudslinging, nasty names, science papers calling us mentally ill and worse. More important we have Senator Wirth and Jim Hansen colluding to sway the opinion of Congress. Wirth, is now president of Turner’s UN Foundation. The is the same Turner who wants to cull the human herd down to ,i>”.. total population of 250-300 million people, a 95% decline from present levels,…” What Wirth and Hansen did was find out what historically was the hottest day of summer in DC and then altered the temperature in the hearing room that day.
From an Interview with Wirth:
After that bit of subtrifuge and manipulation the US signed the UN Framework Convention on Climate Change on 12/06/92 and ratified it on 21/03/94.
From then on it is not and never was science. It is the politics (development of propaganda) of getting people to go along with the decisions already made by the politicians no matter what the actual facts are and the government scientists and academics got those ‘marching orders.’ Any who did not toe the political line were harassed or fired. Think Dr. Patrick Michaels, Dr Gray, Dr Tim Ball and Dr Salby.
Here’s the official definition of Climate Change:
That’s from the official UN Framework Convention on Climate Change (http://unfccc.int/essential_background/convention/background/items/2536.php). The term specifically excludes all natural climate change, and even excludes any caused by humans due to, for example, land clearance or city building, considering only atmospheric changes.
The IPCC mandate is similar:
So it never was about understanding the climate. It was really about ‘options for mitigation and adaptation. ‘ and this is the change wanted by the Globalists like the UN, the World Bank, and the WTO.
The IPCC’s ROLE
I did say unethical and unscientific. I also said the results may be spurious. I also said I’m not sure if they’re fudging the numbers at all, which I hoped would be seen as a suggestion that they may be fudging them somewhat.
But to convince me that CO2 is actually on the decrease, over the last 50 years, is not going to be easy for you. Because it really doesn’t pass the common sense test, in my view. Human population has increased by approximately 7.3/3.5 = 109% in the last 50 years. Oil, gas, and coal consumption have increased by more than that. Anthropogenic deforestation and urbanization of farmland are factors in that, as well.
They found the correlation! CO2 and temperature adjustments.
This graph is the most important research yet published on this blog.
http://stevengoddard.files.wordpress.com/2014/10/screenhunter_3233-oct-01-22-59.gif?
w=640
It is statistical evidence of fraud.
Yes, It is the most important graph Tony has produced especially when taken in conjunction with all the rest of his work.
The last slide of NCDC’s report explains why they’re doing this: they want more funding.
Attribution research has many values, including
advancing our understanding of how events may change
in the future
• There is great scientific value in having multiple studies
analyze the same extreme event to determine the
underlying factors that may have influenced it
• The science remains challenging, but the environmental
intelligence it yields for decision makers is invaluable and
the demand is ever?growing
http://www.ncdc.noaa.gov/sites/default/files/attachments/BAMS%20EE%20Press%20Rollout%20Slides_FINAL.pdf
Of course correlation is not causation — at least not until a plausible and understandable mechanism is brought in which ties the two factors together in a cause-and-effect sequence. In this case the mechanism which explains the correlation is psychological. “If we fraudulently adjust the temperatures to match the change in CO2, we will be given money, power and prestige.”
That is one heck of a plausible and understandable mechanism…
Could they really have an algorithm that incorporate CO2 levels in their homogenization? OMG
They may well have an informal one, but I don’t think they’d put something like that in writing or computer code. They really are not stupid.
It wouldn’t be that difficult to plant such a code so deep that only a line by line debugging would reveal it. I’ve looked at virii that are very well hidden. Has anyone ever seen their code???
Oh, that’s something that they hold very close to the vest! However, it is obtainable by either house of Congress….
Don’t bet on it Richard,
Isn’t it amazing that when Phil Jones was asked to produce the data the answer was The Dog Ate It.
When the New Zealand Climate Science Coalition sued the National Institute of Water and Atmospheric Research (NIWA) , the response was The Goat ate the Data.
Am I noticing a pattern here?
Moscow Rules: Once is an accident. Twice is coincidence. Three times is an enemy action.
Sure, well, I attribute that to incompetence. Legally, the House can issue an arrest warrant for refusal to respect its subpoenas and incarcerate the miscreants in the congressional stockade until they get what they asked for. And if they played their cards right, they also should be able to acquire the code within the Intelligence Committee under national security, have their own staff analyze it, and, publicize anything that was not in need of classification. But all of this requires that they have higher brain functions, which are a scarce commodity on Capitol Hill these days. RTF
Unfortunately, the extent of their interest in justice seems to be in taking the President to court for a single unlawful executive order. RTF
@RTF,
1. One is enough for impeachment grounds (Nixon and Clinton) and with Nixon, as far as I know; they never went after him over unconstitutional executive orders, but for tampering with the judicial process via interfering with an investigation.
2. There are likely more than one unconstitutional executive order in play here.
3. Despite the Constitutional duty to bring charges anyway (Rule of Law, after all), there is no political will to do to O a fraction of what was done to Nixon. Nixon had the wisdom to accept the necessity of resigning from office. Ford took a political risk pardoning him for the good of the country.
Sorry I missed your response. Good points, all! RTF
It seems that you have performed a brilliant and revealing little test. I would expect that your results should have had a tremendous impact by now. I hope that the data series you use are secured in a way so that they do not disappear by accident.
I also believe that it should be quite easy too replicate your test, but I find it a bit challenging to identify the right data source and data series.
I think that the argument you put forward in this post would benefit by containing a step by step description of the method and an exact identification of the source and the data series you use.
Yes I agree. I love graphs but with a finding as critical as this, a more explicit write-up and explanation would be useful. That CO2 vs adjustment graph is powerful but I would like more info so I can use it.