
It doesn’t matter how beautiful your theory is, it doesn’t matter how smart you are. If it doesn’t agree with experiment, it’s wrong.
– Richard P. Feynman
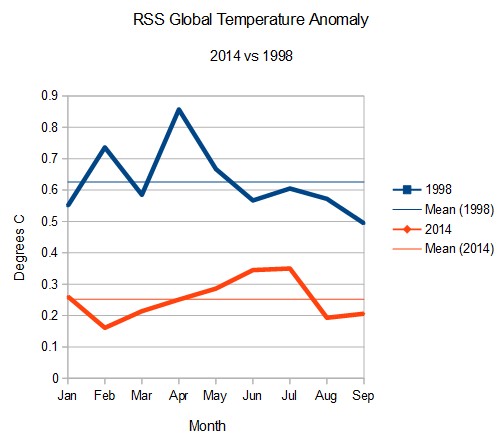
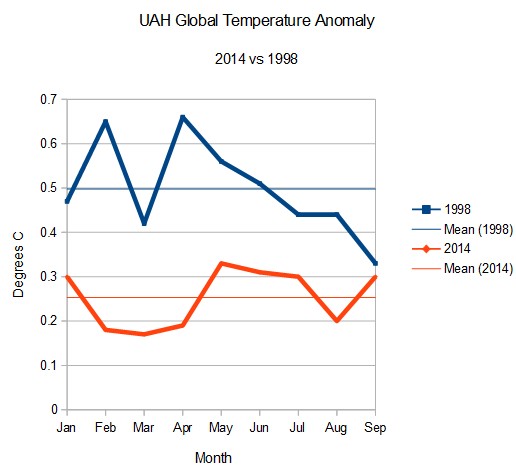
NASA and NCDC are going to claim that 2014 was the hottest year ever, when in fact satellites show that every month of the year was cooler than 1998, with the 1998 anomalies double the 2014 anomalies.
Now look at the abomination which GISS and NCDC are publishing. It shows 2014 and 1998 tied.
So how do they create this fraud? They constantly cool the past and warm the present. All temperatures before 1967 have been cooled since their 2001 version, and all post-1967 years have been warmed. Based on the 1992 to 1998 inflation rate, it seems likely that 2014 is being inflated by several tenths of a degree relative to 1998, in the current version.
2001 version : wayback.archive.org/web/20010507……FigA.txt
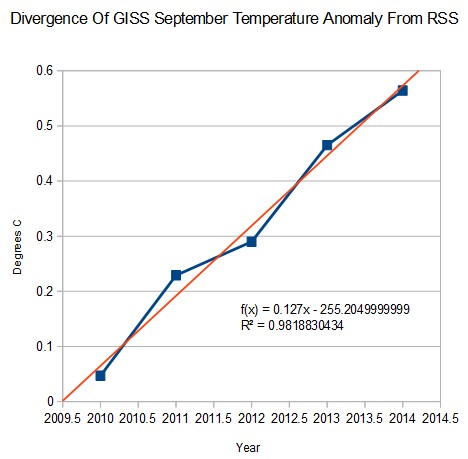
GISS is currently diverging from RSS at almost 13 degrees per century
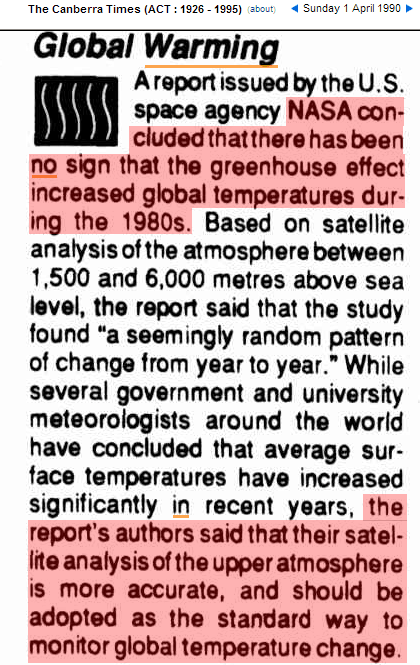
NASA has known for over 20 years that satellite temperatures are more accurate than surface temperatures, and that satellites should be used as the standard. They don’t do this, because satellites wreck their theory – and funding.
01 Apr 1990 – EARTHWEEK: A DIARY OF THE PLANET Global Warming
Why would NASA and NOAA believe their own satellites? That would make too much sense. Their surface temperature records are propaganda – not science.

What prevents them from fudging the satellite records?
Roy Spencer, John Christy and Carl Mears seem like very honest people.
Folks wasn’t there some “adjustment” of the satellites when they strayed too far off message and then the change was put down to compensating for orbit degradation? I’ll see if I can find some of the blog posts I recall reading. I think it may have been at Steve McIntyre’s climate audit blog but it was sometime ago and so I can’t be certain.
Yes, Stewart, but it was in relation to sea-level rise. Orbital degradation has little effect on temperature sensing, but when distance to sea surface and satellite are crucial, the effect is severe, especially when the satellites don’t have sufficient resolution to sense the difference.
Go to
The “Ex-NASA” Panel: http://climateconferences.heartland.org/thomas-wysmuller-iccc9/
for a 13 minute time squeezed summary of the sea-level situation!
RSS is closely tied to both NASA and NOAA. The RSS website promotes IPCC science. Corruption spreads, just like a virus….
The satellite records most interesting and relevant are those tracking changes in solar energy output. It’s pretty easy to see why we had that brief warming bump in the late 1990s – the 11 year solar minimum wasn’t as low as the previous cycle, so the Earth could not shed as much heat into space.
ACRIM Solar data shows mid-90s warming, recent solar cooling
http://acrim.com/TSI%20Monitoring.htm
Yes, what prevents that? After all, the satellite data for sea level rise has been rewritten over the last ten years.
This continual retort I keep getting that Christy, Spencer, etc. are people of integrity is a straw man. Nobody thinks that they aren’t! The question we keep asking is what prevents NASA from “adjusting” the data and then claiming their numbers are the correct ones, and what prevents the public from believing them, as so many still do regarding the instrumental surface temperature record?
Moreover, if NASA starts releasing propaganda to call the integrity of Christy, Spencer, etc. into question, what’s to stop that from working, too? So many people don’t want to face this reality. The folks who took instrumental temperature readings decades ago also had integrity. That didn’t stop NASA and others from “adjusting” their numbers and publicizing the “adjustments” as being the legitimate temperatures. Implicitly trashing the reputation/competence of all those taking the measurements.
As I’ve stated before, this is not just a physical science problem we are faced with, but a psychological one. It is not just their physical analysis that must be contradicted or resisted, but their psychological programming or brainwashing, including subliminal tactics.
RTF
+1. Eternal vigilance.
But they (Spencer et al) control the data.
Maybe you still missed it, but I was talking about adjustments. Spencer et al don’t control “adjustments” to their data. Anyone can do “adjustments” and publicize them. The only thing that can stop people from believing the “adjustments” is efforts to expose the psychopathology that is at work when people try to “take over” a data set by claiming that their “adjustments” are the legitimate data. To make these claims stick requires, not scientific arguments, but brainwashing. Therefore, to make them unstick requires deprogramming people. I’m sure that on some level you understand what I’m saying, since of your blog has been geared toward exactly that. Still, while I think that you’ve done your part, many others including myself, have not done enough. This is a very difficult problem.
much of
They do control the adjustments. It is their product.
Of course they have to adjust, the azimuth of the satellite in orbit drifts from the ground receiving station
Oh well, I guess you don’t understand what I’m saying. Too bad then, maybe all is lost. Nobody controls efforts of others to “adjust” their data and tell the public that their own “adjustments” are the legitimate data. As has happened with the surface instrumental temperature record. That is what they will try to do, because they can’t let satellite data stand as they are.
That’s where they’ll find the Missing Heat ultimately … in “errant” satellite data.
They not only get the raw data from NASA but data to calculate the temperature from the signal intensity. Cooling of the past is not possible but warming of the present is still possible. They are not up there checking the thermometer themselves.
You make an excellent point. There is nothing to stop NASA from publishing their own adjusted version of RSS and claiming some scientific reason for having done so. The imprimatur of NASA and Co will be used to override the good guys and they will use that weight to traduce the original raw data.
Bit of a bugger really.
Look at the options that Roger A. Pielke Sr. said were available to the Team in 2010, when their original “Missing Heat” press release came out (my emphasis):
http://pielkeclimatesci.wordpress.com/2010/04/16/is-there-missing-heat-in-the-climate-system-my-comments-on-this-ncar-press-release/
So two ways forward were seen by Pielke Sr.:
1) Answer the question how the Missing Joules of Heat got past the mid-ocean sensors on their way to the Deep, without being detected; or
2) The only other option he can see is to “look more critically at the satellite data”.
And all of this was in response to a press release in which Trenberth said this (my emphasis):
So in that early quote waaay back in April 2010, the groundwork was already being laid for what they would have to do. The heat was not being found in the oceans, despite efforts to find it, and despite the fact that we know they wanted to “find” it there. So what other option is there? He tells us in the first sentence of the quote.
Look for them to begin very soon claiming that the “the satellite observations are incorrect”, and building a case for that claim.
RTF
During the 1980s, the temperature-measuring satellites had a slight orbital drift issue that caused them to slowly start taking measurements during cooler parts of the day at a given location (I don’t remember whether the drift was to earlier or later times). This had not been realized at the time of the article cited above.
When this effect was compensated for, a flat/cooling trend turned into a warming trend, albeit less than the surface record. Alarmists have used this issue to try to discredit the satellite record altogether, although they give the surface record, which has had far larger adjustments, a free pass.
I am often reminded of Michael Chriction’s admonition that we have no climate data precise enough to detect the effect we are looking for.
Much better to just make up 30% of the surface data.
The really cool part is when the RSS adjustments came out, the greens were ecstatic because the flat plot turned into a warming. Of course, as soon as RSS came out, it stopped warming (as opposed to some modest warming in the Spencer and Christy set). Notice our greener friends have stopped citing RSS?
Patrick, there has to be a return to sanity someday. Communist propaganda of Lysenkoism back in the 1930’s wasn’t as bad as this.
What role do you think the increased sensitivity of the RSS/UAH satellite data to ENSO plays in the relative rank of this year’s (primarily non-ENSO) temperatures in the surface vs. satellite data compilations?
-Chip
We might wish all their fake warming was real. Antarctic sea ice set another record:
http://sunshinehours.wordpress.com/2014/10/24/sea-ice-extent-day-296-antarctica-sets-200th-daily-record-for-2014/
There is a drift in one of the two sets of data.
http://www.woodfortrees.org/plot/uah/derivative/mean:12/plot/gistemp/from:1978/derivative/mean:12
You do have to wonder about the homogenization process where the difference between raw and actual data is so great for individual stations yet they managed to get GISS LOTI to line up with UAH so well, except for the drift and the few spikes (1993, 1995).
“The current analysis uses satellite observed nightlights to identify measurement stations located in extreme darkness and adjust temperature trends of urban and peri-urban stations for non-climatic factors,” or fudge it to look more like the satellite data? Two thirds of the differences are less than 0.014 K per year after 12 month smoothing.
A more “critical” look into the satellite data may have already begun:
http://www.reportingclimatescience.com/news-stories/article/clouds-depress-satellite-warming-trend-says-study.html
Well, well.
Guess what, this Weng guy is from NOAA and he says that he and his team are using a sophisticated algoreithm to adjust Christy’s data to make it show more warming, which Weng believes to be more correct.
RTF
Weng is simply taking a known effect with little to no actual influence on RSS readings and overestimating it’s effect, much the same way they do with CO2 sensitivity. What Weng fails to mention or dispute is that the satellite data is independently verified with weather balloon readings when it is raining. If Weng’s guesswork was correct the weather balloons would report higher temps inside these rain clouds then what the satellites say, but they do not. They match the satellite data. Hard to argue with that but lets not let facts get in the way of a good story.
The real (and obvious) truth is that historical data, by its very nature, cannot change. When data that is allegedly the same is systematically revised, the answer is not “adjustments,” but fraud. Pure and simple.
Now it could be remotely possible that satellite data may need to be calibrated due to gradual degradation of the sensors, or some such possibility. But the data that comes from historical records cannot change. it can only be lied about.
http://upload.wikimedia.org/wikipedia/commons/b/b3/Temp%C3%A9rature_moyenne_par_d%C3%A9cade_annuelle_%C3%A0_Paris-Montsouris_de_1879_%C3%A0_2008.png
Where real people live… Nothing to worry about, climate change is not real… Sleep sheep