The real US temperature graph above (not to be confused with the fraudulent one generated by NCDC) shows pretty clearly that the US is on a 70 year warming and cooling cycle, and that there is no reason to believe global warming has affected the US in any way.
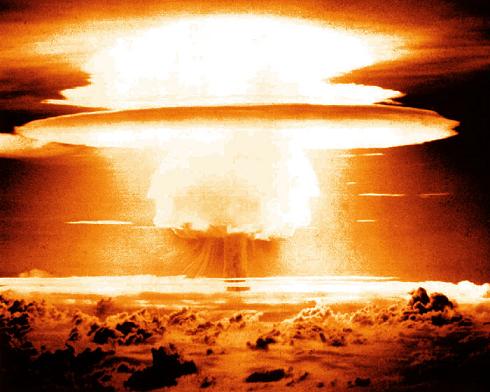
However, there is an interesting feature in the 1950s and 60s. Note that it was cooling, and there was very little year over year variability. That was the time when the USSA and USSR were blasting hundreds of nuclear weapons above ground. Imagine how much dust that put in the upper atmosphere.


How many exactly? I guess the US might tell but the Soviets? And how much dust is released compared to a random volcano? just curious.
http://upload.wikimedia.org/wikipedia/commons/thumb/0/0d/Worldwide_nuclear_testing.svg/750px-Worldwide_nuclear_testing.svg.png
The graph you give does not match the statement you made …
“That was the time when the USSA and USSR were blasting thousands and thousands of nuclear weapons above ground.”
Especially since many of the tests included in the graph were below ground.
I suggest Ex-Lax to assist your condition.
And I suggest that lay off the caffine so that you can see things clearly …
A treaty signed by the US and the Soviet Union banning above ground and underwater testing went into effect October 1963.
Here is a video that gives you a sense for it. There were 3 in 1945, 9 by 1950, about 300 by 1960, but by the time above-ground testing was ended by treaty in 1968, about a thousand above-ground nuclear weapons had been set off. And not all nuclear powers agreed to the ban on above ground testing).
https://www.youtube.com/watch?v=LLCF7vPanrY
But there is a difference in scale not obvious from the video. Some of the later bombs were hundreds of times as powerful as the first ones, in some cases several thousand times as potent. So the “Hiroshima Equivalent” in bombs detonated in the atmosphere would be on the order of a million or so.
As for Soviet testing, our instruments recorded each test — especially as they “went big” pretty quickly. There are videos about Tsar Bomba, for example, at about 58,000,000 tons of TNT equivalent compared to about 16,000 tons for the Hiroshima blast.
==============/ Keith DeHavelle
Keith,
Thanks for reminding me of this video – it’s a classic and I had lost track of it!
The Soviets did not have to tell. The tests told on them.
Imagine where that radioactive dust all ended up.
Most of the large US weapons tests 1946-1962 that were above ground were conducted over the oceans (Bikini-Enewetak, Christmas Island, Johnston Island, Aleutian Islands, and the south Atlantic area), Many were underwater detonations or airdrops or rocket-launched. None of these tests were likely to have generated much “dust”, but some vaporized coral for the atoll shots. US aboveground tests at Nevada Test Site were relatively small yield devices designed to explore effects of the shock-wave, thermal blast, and radiation on structures and such. By 1957, US had begun testing in tunnels and shafts at NTS and, by 1962, all nuclear testing was contained underground.
The French and Brits tested in oceanic locations, or in central Africa
The Soviet Union, on the other hand, did most of its aboveground testing and many of their early tests were high-yield. Tsar Bomba was the big daddy of all time [50-58 Mt] detonated 10/30/1961 at Novaya Zemlya [a hard-rock island archipeligo] in the Soviet Arctic
That warm part around 1960 always makes we wonder. It was in the middle of the negative phase of the PDO (1945-77) and yet the el-ninos dominated for a short time before the cold returned.
I’m not sure how much dust, what size or composition the above ground nukes did or how it compares to a volcano but it isn’t the only mechanism by which it could have allowed the Pacific to warm.
Just my SWAG but all those blasts could have created changes in air currents which may clear out clouds over the Pacific allowing more sunlight to hit the water? Like I said just my SWAG but I’ve always wondered about that warm spell in the middle of the negative PDO phase.
I wonder if humidity was affected by the testing. http://www.climate4you.com/images/NOAA%20ESRL%20AtmospericRelativeHumidity%20GlobalMonthlyTempSince1948%20With37monthRunningAverage.gif