Obama Recycles 1974 Global Cooling Rhetoric

if we do not act forcefully, we’ll continue to see rising oceans, longer, hotter heat waves, dangerous droughts and floods, and massive disruptions that can trigger greater migration, conflict, and hunger around the globe. The Pentagon says that climate change poses immediate risks to our national security.

This is almost identical to what the CIA said about global cooling in 1974.

ScreenHunter_6256 Jan. 20 22.41

ScreenHunter_6259 Jan. 20 22.55

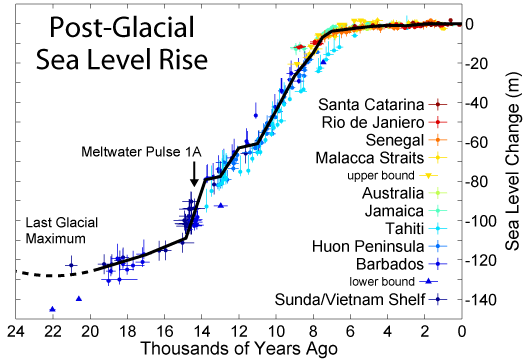
Oceans have been rising for 20,000 years. King Canute also thought he could stop the rise of the seas.

Post-Glacial_Sea_Level

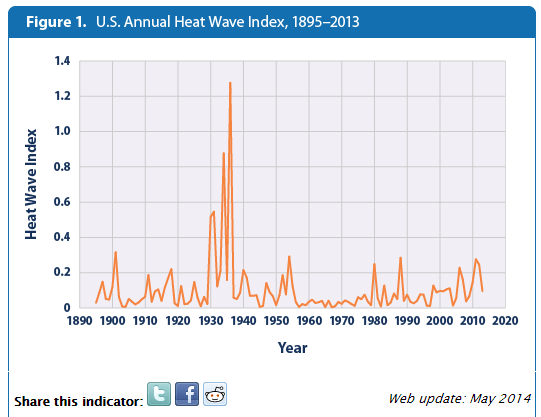
According to the EPA, heat waves in the US peaked in the 1930’s and have been declining ever since.

ScreenHunter_6255 Jan. 20 22.34

Floods and droughts show no trend. Worst droughts were in the 1930s.

I will not let this Congress endanger the health of our children

The dictator speaks. He is seizing control of the government from the evil elected representatives of the people – for the good of the kids.

2014-election-map

And thanks to lower gas prices and higher fuel standards, the typical family this year should save $750 at the pump.

The guy who promised to make energy prices skyrocket, is taking credit for lower energy prices which he tried to block.

[youtube=https://www.youtube.com/watch?v=HlTxGHn4sH4]

About Tony Heller

Just having fun
This entry was posted in Uncategorized. Bookmark the permalink.

28 Responses to Obama Recycles 1974 Global Cooling Rhetoric

  1. omanuel says:

    Obama shows how corrupt “The Great Social Experiment of 1945-2015” became just before collapse:

    https://dl.dropboxusercontent.com/u/10640850/Social_Experiment.pdf

    Unfortunately, the entire structure of government science must be rebuilt to eliminate fraud-for-funds or just eliminate government support for science.

    With kind regards,
    Oliver K. Manuel

    • omanuel says:

      The Problem: Totalitarian rule by world leaders and puppet scientists for the past seventy years (1945-2015):

      1. Created a false conflict between physical sciences and spirituality.

      2. Obscured the Sun’s control over every atom, life and world in the solar system.

      3. Destroyed the integrity of science and constitutional limits on government.

      4. Left society unprepared to survive 1 AU (astronomical unit) from a stormy pulsar.

      The Solution: ? ? ? Must extend far beyond the limits of solar, nuclear and climate science, like problems identified in “The Great Social Experiment of 1945-2015?

    • Those who don’t know Climate History are condemned… condemned…

      Condemned to remain ignorant Progressives…

  2. MrX says:

    I’m starting to think they don’t care if temperatures go up or down. I think they’ll use whatever the current trend is to justify skyrocketing fossil fuel prices. Only thing they don’t seem to realize is that energy companies are in the energy business. IOW, they don’t care if it’s “renewables” or fossil fuels, the same companies will be providing it if it’s viable. Right now, it’s not viable without subsidies (hence the need to bring up fossil fuel prices).

  3. sabretoothed says:

    I think Obama is recycling the old tricks from Darwin

    http://query.nytimes.com/gst/abstract.html?res=9A0DEED81F3EE633A25750C2A96E9C946394D6CF

    Major Darwin Predicts Civilization’s Doom Unless Century Brings Wide Eugenic Reforms

    Eugenic reforms must be adopted within the next hundred years if civilization is to go on, was the message of Major Leonard Darwin, son of Charles Darwin, founder of the modern theory of evolution, read last night at the Third International Congress of Eugenics, which opened yesterday at the American Museum of Natural History.

  4. isbobc says:

    Poor King Canute – still being blackened by history. He was showing his subjects that he was just a man, not in any way God like. The tide would no more obey him than anyone of them.
    His death with no heir prompted a power struggle that led to the Norman French invasion of England.

  5. sabretoothed says:

    Funny how just 2 or 3 guys made the whole temperature of earth lol https://www.youtube.com/watch?v=cAj_lZv4Gxc&index=407&list=FL8TNoCa__SKk7C3g34Ct9NA

  6. SMS says:

    Obama is not afraid to tell an untruth. He has done nothing that I would consider a positive accomplishment during his six years. A complete failure.

  7. Jimmy Haigh says:

    The usual fire and brimstone bullshit of the deranged.

  8. gofer says:

    Immediate risk to national security? How absolutely pathetic. Its absurd that the military has to resort to promoting this scam in order to up their budget. They have to be smart enough to understand the absurdity of it all. The country cannot withstand such blatant and outrageous corruption among those that pretend to be leaders.

  9. ntesdorf says:

    Poor Old King Canute is still being treated as if he did not know that he could not control the seas. He actually assembled his court at the sea edge to show them that there were limits to even his power. He knew that one power that he did not have was controlling the sea..
    Unlike Canute, Obama seems deluded enough to actually believe that he can control the seas and the weather and climate too.

  10. Gail Combs says:

    Sea level Rise
    Steve is using a graph from WIKI

    Perhaps a better graph from WIKI is this graph where you can actually see the Holocene Highstand and the fact that sea levels have dropped since the Holocene Optimum if you discard the Santa Catarina outlier.

    http://upload.wikimedia.org/wikipedia/commons/1/1e/Holocene_Sea_Level.png

    WIKI
    This figure shows changes in sea level during the Holocene, the time following the end of the most recent glacial period, based on data from Fleming et al. 1998, Fleming 2000, & Milne et al. 2005. These papers collected data from various reports and adjusted them for subsequent vertical geologic motions, primarily those associated with post-glacial continental and hydroisostatic rebound….

    So the data is not raw data but adjusted data. Lets look at more information on that Santa Catarina outlier that keeps the curve from showing a decrease in sea level. (After reading the entire study, I would toss all the Santa Catarina data points because they are suspect.)

    Tectonic influences on the preservation of marine terraces: Old and new evidence from Santa Catalina Island, California
    R. Randall Schumann a,?, Scott A. Minor a, Daniel R. Muhs a, Lindsey T. Groves b, John P. McGeehin

    Article history:
    Received 18 November 2011
    Received in revised form 22 August 2012
    Accepted 27 August 2012

    a b s t r a c t
    The California Channel Islands contain some of the best geologic records of past climate and sea-level changes, recorded in uplifted, fossil-bearing marine terrace deposits. Among the eight California Channel Islands and the nearby Palos Verdes Hills, only Santa Catalina Island does not exhibit prominent emergent marine terraces, though the same terrace-forming processes that acted on the other Channel Islands must also have occurred on Santa Catalina. We re-evaluated previous researchers’ field evidence and examined new topographic, bathymetric, and stream-profile data in order to find possible explanations for the lack of obvious marine terrace landforms or deposits on the island today. The most likely explanation is associated with the island’s unresolved tectonic history, with evidence for both recent uplift and subsidence being offered by different researchers. Bathymetric and seismic reflection data indicate the presence of submerged terrace-like landforms from a few meters below present sea level to depths far exceeding that of the lowest glacial lowstand, suggesting that the Catalina Island block may have subsided, submerging marine terraces that would have formed in the late Quaternary. Similar submerged marine terrace landforms exist offshore of all of the other California Channel Islands, including some at anomalously great depths, but late Quaternary uplift is well documented on those islands. Therefore, such submarine features must be more thoroughly investigated and adequately explained before they can be accepted as definitive evidence of subsidence. Nevertheless, the striking similarity of the terrace-like features around Santa Catalina Island to those surrounding the other, uplifting, Channel Islands prompted us to investigate other lines of evidence of tectonic activity, such as stream profile data. Recent uplift is suggested by disequilibrium stream profiles on the western side of the island, including nickpoints and profile convexities. Rapid uplift is also indicated by the island’s highly dissected, steep topography and abundant landslides. A likely cause of uplift is a restraining bend in the offshore Catalina strike-slip fault. Our analysis suggests that Santa Catalina Island has recently experienced, and may still be experiencing, relatively rapid uplift, causing intense landscape rejuvenation that removed nearly all traces of marine terraces by erosion. A similar research approach, incorporating submarine as well as subaerial geomorphic data, could be applied to many tectonically active coastlines in which a marine terrace record appears to be missing.

    More recent evidence suggests “Santa Catalina Island has recently experienced, and may still be experiencing, relatively rapid uplift, causing intense landscape rejuvenation that removed nearly all traces of marine terraces by erosion.” Therefore the outlier may have been ‘adjusted’ incorrectly for this period.

    From the report itself is this rather amusing tidbit.

    ….Here, alluvium from this stream overlies a layer of beach cobbles (Fig. 7B). A polystyrene foam cup embedded in the alluvium dates the layer as no more than 50–60 years old. The elevation of the cobble layer at its landward edge is 2.8 m, so it is possible that this or a similar wave-cut bench was the “10 ft strand line” described by Bailey (1941). An apparently modern storm bench occurs at roughly this elevation, making it highly doubtful that Bailey identified a Pleistocene marine terrace at this location and elevation

    The highest beach ridge preserved on Thunder Beach is mantled with a 10 to 15 cm-thick layer of sandy silt, locally covered by a thin cobble layer (Fig. 7C). Its GPS-determined elevation of 6.2 m corresponds roughly to the height of the “25 ft strand line” described by Bailey (1941). Its surface morphology is that of a flat-topped bench backed by bedrock sea cliffs, colluvial wedges, and landslides. Shells of Olivella, Serpulorbis, Conus, Balanus, and Antisabia were found in the silty layer mantling the surface of the bench. Radiocarbon dating of three samples of mollusk shells from this bench yielded essentially modern ages (Table 1). The bench appears to be above the reach of most storm waves, and the presence of the sandy silt mantle and unbroken mollusk shells is in stark contrast to the pebble- and cobble-dominated lower beach ridges, but given its modern age, this feature is most likely a storm bench…..

    Table 1
    Radiocarbon ages of mollusk shells collected from the highest beach ridge (elevation
    6.2 m) at Thunder Beach, Santa Catalina Island. Dates are corrected for ?13C.
    Sample ID ……………………Description 14 ……………C age (yr BP)
    CAT-2010-03A-01 ….. Olivella biplicata shell ………….Modern
    CAT-2010-03A-02 …. Antisabia panamensis shell …..675 ± 30
    CAT-2010-03B-01 ….Serpulorbis squamigerus shell …Modern

    If you have the time reading the study is worth it. It is an excellent example of how science should be done with readable text illustrated with good photo and graphs.

    • I think the Santa Catarina mentioned in the sealevel graph is distinct from Catalina island here in California.

      http://en.wikipedia.org/wiki/Santa_Catarina_%28state%29

      • Gail Combs says:

        Yes, you are quite correct. One is called Santa Catarina, the island off California . And the other Catalina Brazil. I was wondering if that letter was an L or an R. I temporarily lost my glasses this morning so the astigmatism struck again…GRRrrrr. However the Santa Catarina Island study was fascinating so I don’t regret the mistake. Reads like a detective mystery to me.

        The Brazil site is also quite interesting. And again the “5.1 ky BP” Holocene Highstand is evident.
        The Quaternary Geological History of the Santa Catarina Southeastern Region (Brazil) 1999

        The first part discusses drilling in several locations and analyzing samples. They mention dating prior to that was guesses. “…. A drilling campaign done in the domain permitted the sampling of material for 14C datings, and the obtained data confirmed some previously assumed ages. The sequence of events, that originated the Holocene deposits, has been also reconstructed through drilling and 14C dating of the collected peat and shell samples…”

        In the body of the text is this:

        THE HOLOCENE DEPOSITIONAL SYSTEM
        Partially abutted against the Pleistocene barrier island/lagoonal system III, there is the Holocene depositional system. This unit is attributable to the Santos Transgression of Suguio & Martin (1978), along the State of São Paulo coastline, or to the Last Transgression of Bittencourt et al. (1979) along the State of Bahia coastline, being similar to the barrier island/lagoonal system IV of Villwock et al. (1986), along the State of Rio Grande do Sul coastline.

        This system is related to the post-glacial transgressive episode whose culmination stage was attained about 5.1 ky BP, when a barrier island alignment was formed parallel to the shoreline, while drainage net was drowned. The subsequent regressive episode promoted the barrier island progradation following the lagoonal basin silting.

        The paleoshorelines limited by ancient cliffs carved within Pleistocene terraces, presently representing the inner limit of the Holocene terrace, shows that this sea-level reached about 4m above the present one. Several terraces situated in different altitudes, and truncation of past morphological features nowadays observed on Holocene deposits, as well as along present lagoonal margins suggest that small scale sea-level oscillations occurred during the last 5 ky….

        The fluvial sediments supplied by the drainage net, added to sediments reworked by coastal dynamics, gave rise to intensive silting up and consequent segmentation of the lagoonal bodies. The present shapes of these lagoons resulted from progradation of swampy margins, as well as growth of beaches and sand spits. In some places the total thicknesses of the lagoonal deposits, composed of sands, muds, biodetrital carbonates and peats, exceed 40m and many of the depositional environments are still active.

        The paludal facies of the Holocene lagoonal system is represented by organic matter rich muddy deposits, which corresponds to the terminal stage of the coastal lagoon siltation. A drilling within the paleolagoonal deposits at north of the Figueirinha lagoon (28º 39’01”S/48º 58’43”W) penetrated through peats, clays and shelly sands, from top to bottom (Fig. 6). A sample of peat from the top of the drilled section, dated in the previously mentioned laboratory, indicated an age of 1,380+70 yr. BP (NUTA-3310)….
        .
        .
        .

        G) STAGE VII

        Construction of Holocene wave-built terrace – The sea-level drop following the 5.1 ky BP culmination stage originated the wave-built terrace abutted against the original barrier island, with the consequent shoreline progradation in general as regressive beach ridges. Several truncations of these beach-ridge systems, as well as many levels of marginal lagoonal terraces suggest that the dominantly regressive trend was momentarily interrupted by minor transgressive episodes. The radiocarbon ages of the natural shell beds indicate that between 5 and 3 ky BP the relative sea-level was higher than today, with consequent expansion of the lagoonal areas frequently transformed into bays, and warmer paleotemperatures were favourable for great proliferation of mollusks in the area (Mendes 1993; Pitoni 1993)….

        So once again evidence that sea levels have dropped since the Holocene Optimum and evidence that of “warmer paleotemperatures were favourable for great proliferation of mollusks in the area”

  11. Gail Combs says:

    More on sea level.

    As with all the other data related to CAGW it has been ‘reworked’ to support instead of refute the current propaganda.

    A new study I just found:
    Late Quaternary highstand deposits of the southern Arabian Gulf: a record of sea-level and climate change

    Abstract
    ….Late Quaternary highstand deposits of the southern Arabian Gulf: a record of sea-level and climate change

    Abstract
    …..It has therefore been necessary to infer the ages of these sediments by a comparison of their stratigraphy and elevation with deposits known from other parts of the world. We regard this approach as valid because the southern Gulf coastline lacks evidence for significant widespread neotectonic uplift,…….
    …..Widespread evidence exists for a Holocene sea level higher than at present in the southern Arabian Gulf, indicating that it peaked at 1–2 m above present level, c. 5.5 ka bp…….

    Halfway around the world:
    Mid to late Holocene sea-level reconstruction of Southeast Vietnam using beachrock and beach-ridge deposits

    ….backshore deposits along the tectonically stable south-eastern Vietnamese coast document Holocene sea level changes…..reconstructed for the last 8000 years….The rates of sea-level rise decreased sharply after the rapid early Holocene rise and stabilized at a rate of 4.5 mm/year between 8.0 and 6.9 ka. Southeast Vietnam beachrocks reveal that the mid-Holocene sea-level highstand slightly above + 1.4 m was reached between 6.7 and 5.0 ka, with a peak value close to + 1.5 m around 6.0 ka….

    Sea-level highstand recorded in Holocene shoreline deposits on Oahu, Hawaii

    Unconsolidated carbonate sands and cobbles on Kapapa Island, windward Oahu, are 1.4-2.8 (+ or – 0.25) m above present mean sea level (msl)…we interpret the deposit to be a fossil beach or shoreline representing a highstand of relative sea level during middle to late Holocene time. Calibrated radiocarbon dates of coral and mollusc samples, and a consideration of the effect of wave energy setup, indicate that paleo-msl was at least 1.6 (+ or – 0.45) m above present msl prior to 3889-3665 cal. yr B.P, possibly as early as 5532-5294 cal. yr B.P., and lasted until at least 2239-1940 cal. yr B.P

    And if you missed it:

    spangled drongo says:
    January 19, 2015 at 8:20 am

    Back in 1946, the bay side house we spent summers in, in Australia, the king tides used to cover the flat lawn by about an inch and run into the well if we didn’t keep a levy bank around it. The lawn and well are still as they were in 1946. Guess where these highest astronomical tides come to now in this tectonically very stable area?

    After several recent years of checking, about 6 inches to a foot lower.

    • DD More says:

      Make sense to me. Put together the forest being revealed under the melting Alaska glaciers and IIRC most of the NE shore line glaciers in Greenland we also only aged to 4000 to 5000 years old. The ice had to come from somewhere.

      • Gail Combs says:

        Most of the Antarctic is gaining ice, Greenland is gaining ice, and Himalaya Glaciers are Growing.

        the*inc*onveni*ents*keptic(DOT)com/2012/04/himalaya-glaciers-are-growing/
        (Remove [*]s WordUnimpressed hates this website and bans links to it.)

        This study says Norway glaciers have been growing too: A new approach for reconstructing glacier variability based on lake sediments recording input from more than one glacier January 2012

        … Minimum glacier input is indicated between 6700–5700 cal yr BP, probably reflecting a situation when most glaciers in the catchment had melted away, whereas the highest glacier activity [growth] is observed around 600 and 200 cal yr BP. During the local Neoglacial interval (~ 4200 cal yr BP until present), five individual periods of significantly reduced glacier extent are identified at ~ 3400, 3000–2700, 2100–2000, 1700–1500, and ~ 900 cal yr BP….

        Note the last period of “significantly reduced glacier extent.. identified” is ” ~ 900 cal yr BP” or ~ 1100 AD = the Medieval Warm Period.

  12. Vince says:

    “The guy who promised to make energy prices skyrocket, is taking credit for lower energy prices which he tried to block.”

    I seem to recall that Obama also tried to take credit for the increase in domestic oil and natural gas production during his re-election campagain in his 1st presidential debate with Romney. I remember Romney setting Obama straight on that particular issue, saying that all of the production increases were occuring on private and state lands, while production on federal lands had actually decreased during the same time. It was one of the few moments where I was proud of Romney.

  13. dom says:

    The next two years are going to be very similar to taking a long-long road trip with a troubled 12 Y/O in the front seat; I hope we can hang on long enough.

    The graph showing the heatwave of the 1930s is awesome, it could also show the rapid expansion and reduction of the farm subsidies that was really responsible for the dust bowl (Dirty Thirties).

    The “Suitcase Farmers” leaving bare-dirt and the drought took much of the blame for the Dust Bowl but it was FDR and still is corporate hedging that is draining our coffers; food stamps, free healthcare, subsidized housing, Obama phones, free college, $7K per month to foster each illegal…

    Profits before the country right?

  14. sabretoothed says:

    The Pentagon that said there was WMDs now says there is Global Warming when in the 1970s it was Global Cooling https://www.facebook.com/video.php?v=10150522817674999&set=vb.5281959998&type=2&theater

Leave a Reply

Your email address will not be published. Required fields are marked *