
NCDC has no thermometers in most of Africa, and nearly half of the rest of the land surface, so they fabricate fake land temperatures based on sea surface temperatures more than 1,000 km away

To show how fraudulent this practice is, let’s look at the US where they do have surface data. The Atlantic was warm, while the US and Canada were very cold last year. You can not extrapolate temperatures across land/ocean boundaries.
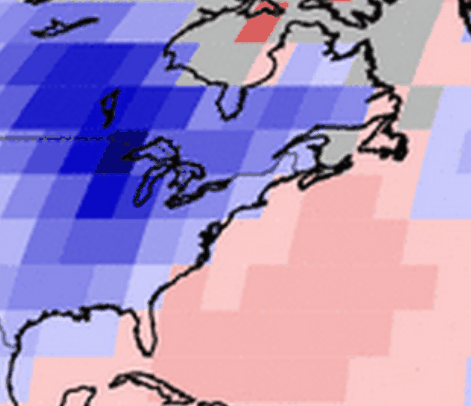
What they are doing is equivalent to measuring Death Valley temperature, based on the temperature of the cold water offshore in the Pacific.
But it gets worse – after making up these completely fake temperatures across vast swaths of the planet, they report a global temperature record of 0.02 degrees. This is scientific malfeasance – pure and simple.

You get snow, we get rain. And we are barely 100 miles apart. Yea, extrapolation over hundreds of miles works very scientifically – if your science was learned at Hogwarts.
If you have ever lived in the UK you will know about variable weather and climate. The distance between on end of the UK to the other is Land’s End to John o’ Groats is 968.618 km (605 miles) as the crow flies. Just under 1,000 km. Just off the south west of England’s coast you have the Scilly islands with palm trees and an annual average temperature of 11.8 °C. In Scotland’s Shetlands at low altitude the annual average temperature is 7 °C on Shetland. Almost 5C difference in less that 1,000km.
CORRECTION:
The distance between one end of the UK…
Help Contribute to Climate Change now by burning MORE Fossil Fuel…
http://www.breitbart.com/national-security/2015/01/20/1700-private-jets-fly-to-davos-to-discuss-global-warming/
Not only is the Krigging bogus but in the Africa map there are three readings where the dark blue (cold) areas are made much warmer.
Frank Lansner shows you have to take the topography into account. The earth is not a featureless billiard ball without oceans or mountains and that is the primary ASSumption of krigging.
http://wattsupwiththat.com/2014/01/06/the-original-temperatures-project/#comment-1526859
It’s not a featureless billiard ball they model a lot of things as if it’s a perfect black body in the form of a homogenous flat disc that is perpendicular to the sun’s radius.
The Climastrologists krig up to 500 kilometers.
The straight line distance between Wilmington, NC and Asheville, NC is 447.26 km
Asheville, NC = 35.0 °F
Wilmington, NC = 40.8 °F
And they can use that to estimate the global temperature to 0.01C???? RIIIIiiiight.
Speaking of Kriging…
From the company selling the software:
GEOSOFT:Topics in Gridding
Reading Tony’s articles is sometimes the scariest thing I do in the morning. But I have to say, Gail, that reading your well-documented posts is often down-right frightening. It paints a picture of a government that is not just out of control. There are people that are making decisions affecting our lives in all levels of government based on dark fantasies. There are practically no scientific or logical bases for decision making in any area of government. It is not that there is a conspiracy going on out there. Too many people in authority share common religious beliefs that have no grounding in reality and which give no benefit to the citizens of this country. That is frightening. Our government has a state religion, which is forbidden by the Constitution for a good reason.
+1
What’s the temperature in Florida, I need to tell those folks in Winnipeg it is actually a lot warmer there than they think.
60.6°F (+/-1.5°F) on my back deck, 10am EST at latitude ~28°35′ N.
This definitely illustrates how oceans heat slower and cool slower than land. The fact that huge land masses are colder and colder while the ocean is ‘warm’ doesn’t mean the ‘heat is hiding in the ocean’ it means that heat REMAINS in the ocean but is dissipating. I am just gobsmacked how these ‘scientists’ don’t understand the simplest things about how heat cools down.
We need to take the heated homes away from our Congress Critters and give them Hot water bottles to place at the foot of their beds for the rest of the winter. Maybe then they would have an appreciation of the heat capacity of water.
What you just said EMSNEWS is why I think Frank Lansner’s work on whether the temperature is take on the coast or in an ocean influence area vs in the middle of a continent has a lot of merit.
He and his buddies are putting together a data set
RUTI = ”Rural Unadjusted Temperature Index”
(English is not Frank’s first language)
http://hidethedecline.eu/pages/ruti.php
http://hidethedecline.eu/pages/ruti/highlights.php
A good map showing just how big an area Africa is.
http://infobeautiful2.s3.amazonaws.com/true_size_of_africa.png
Amazing. Thanks for that – visualizing these vast areas helps keep it all in perspective.
That map is a ‘Keeper’
Thanks
Africa doesn’t count, only if its hot in Australia, USA or UK then it counts 😉
Thanks, Penthouse, the map highlights the fraud very elegantly. If we happened to be right where we fit in this mosaic, it would be like NCDC took measurements from Western Atlantic, Minnesota and the American Southwest, and told us what the temperatures were in every U.S. state.
If this was any other business, the seller would end up in court.
I really wish there was a way for citizens to drag the whole blasted Congress and the rest of the bureaucracy in to court and then to send them to jail and toss away the key.
Where’s Alaska? 😉
They don’t have satellite coverage?
They do. The satellites show no warming so they don’t use them as part of “the cause”
There is little or no doubt:
1. Government scientists hid, fabricated and/or manipulated data for seventy years, but
2. “The UN’s Great Social Experiment of 1945-2015? is now defunct (obsolete):
https://dl.dropboxusercontent.com/u/10640850/Social_Experiment.pdf
In seeking a realistic solution to today’s problem, we must keep in mind that our 2015 problem was once the solution to a largely unreported 1945 problem: CHAOS and FEAR of worldwide nuclear annihilation in AUG-SEPT 1945, as the crew of an American B-29 plane was held captive by USSR troops during negotiations to establish the United Nations in OCT 1945.
https://dl.dropboxusercontent.com/u/10640850/CHAOS_and_FEAR_August_1945.pdf
May we find a realistic solution to today’s problem that will be as beneficial to society as was the formation of the United Nations in 1945, while restoring the integrity of government science and constitutional limits on national and international forms of government.
http://www.dailymail.co.uk/sciencetech/article-2919263/The-computer-predict-SUN-AI-forecasts-devastating-solar-flares-knock-power-grids-Earth.html#ixzz3PX4ZMazU
Another useless expensive computer that apparently can predict the future LOL