
In 2008, all of the temperature data sets showed that global warming rates over the last decade were “much less” than the prior decades.
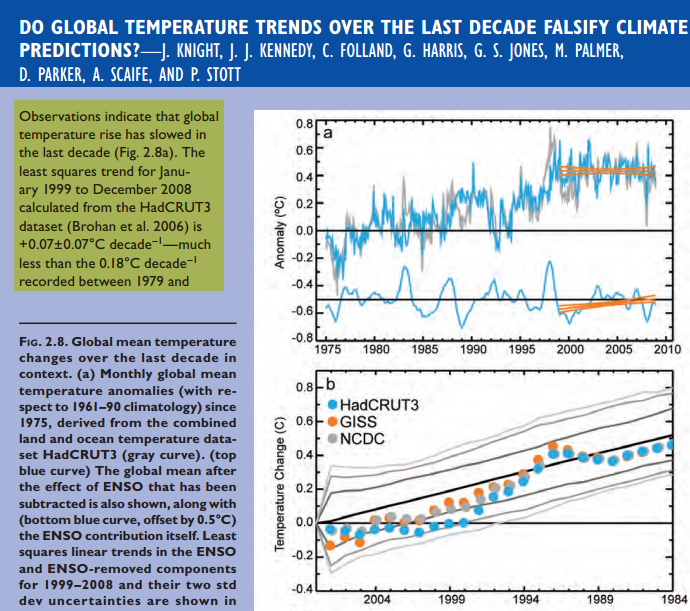
Observations indicate that global temperature rise has slowed in the last decade . The least squares trend for January 1999 to December 2008 calculated from the HadCRUT3 dataset is +0.07±0.07°C decade – much less than the 0.18°C decade – recorded between 1979 and 2005 and the 0.2°C decade – expected in the next decade . This is despite a steady increase in radiative forcing as a result of human activities and has led some to question climate predictions of substantial twenty-first century warming.
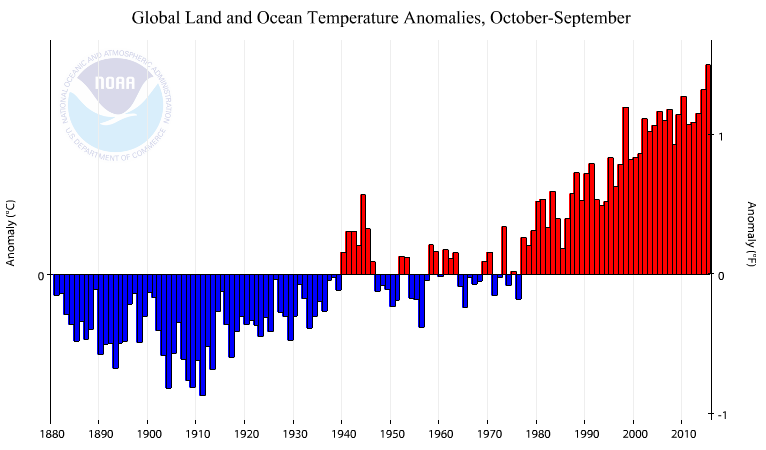
NOAA graphs showed no temperature rise after 1998.
www1.ncdc.noaa.gov/pub/data/cmb/bams-sotc/climate-assessment-2008-lo-rez.pdf

This didn’t suit the requirements of the White House ahead of Paris, so NOAA simply inverted reality, massively tampered with the data, and announced that warming was “as fast or faster” than it was previously.
Science publishes new NOAA analysis: Data show no recent slowdown in global warming.

They made the hiatus disappear, the Enron way. Via good old fashioned accounting fraud. Shameless liars.
They are under subpoena to turn over to Congress all of their E-mails related to this fraud, but are refusing to provide them.

Reblogged this on Climatism and commented:
Repeat …
“Who controls the past controls the future; who controls the present controls the past.” is the political ideology of the totalitarian government of Oceania [Obama] in George Orwell’s [Tom Karl’s] dystopian novel [Gov Agency] Nineteen Eighty-Four [NOAA].
7 years ago, the temps were flat for at least 10 years. Now they’re saying that they weren’t. So did they decide that from 1998 to 2008, people were too stupid, on a global scale, to read thermometers correctly?
How is anyone, except perhaps for Martin Smith, expected to swallow that?
You have to read the peer-reviewed research to understand the science behind AGW.
You have to read the peer-reviewed research to know that the papers being published are pure BS. For example,
Zinlun Zhang, 2006, says “an increase in surface air temperature and downward longwave radiation results in an increase in the upper-ocean temperature and {a decrease in sea ice growth}, leading to a decrease in salt rejection from ice, in the upper-ocean salinity, and in the upper-ocean density. The reduced salt rejection and upper-ocean density and the enhanced thermohaline stratification tend to suppress convective overturning, {leading to} a decrease in the upward ocean heat transport and the ocean heat flux available to melt sea ice. The ice melting from ocean heat flux decreases faster than the ice growth does in the weakly stratified Southern Ocean, leading to an increase in the net ice production and hence {an increase in sea ice mass}.”
If you read only the part I bracketed, he says a decrease in sea ice growth leads to an increase in sea ice mass. That’s the kind of pure bullshit that gets pee reviewed.
I believe you spelled his name wrong (on purpose?). He published several papers in 2006, and, because you guys don’t follow attribution rules, I don’t know which one you cherry-picked your quote from, so I can’t fact check your accusation (on purpose?)
Nevertheless, if your cherry-picked single quote is accurate, you really have discredited all of climate science. Now I see what you guys base your contrarian beliefs on. Pretty much nothing.
Paranoia, the destroyer
Silly boy, ya’ self-destroyer
https://www.youtube.com/watch?v=wRpAANsoG8I
It looks like it’s Jinlun Zhang. Being phonetically almost identical, they may both be correct translations. But since his employer, the University of Washington, lists him as Jinlun, I have to assume that’s the spelling he uses. If Morgan were trying to deceive you, as you strongly imply, he did a terrible job of it. I was able to find the correct Mr. Zhang, and the quoted paper, in roughly 10 seconds of searching:
http://citeseerx.ist.psu.edu/viewdoc/summary?doi=10.1.1.167.119
By all means, fact check away on this peer reviewed gibberish. Tell us all why we should accept that melting sea ice can directly cause more sea ice. The quote above is fully half of the abstract given by Mr. Zhang himself, and plainly representative of his conclusion. The rest of the abstract is just the usual setup information, outlining the problem he’s trying to solve.
The cherry picking argument is both scientifically invalid, and personally offensive. If you insist on calling someone a liar, you should at least make an attempt to find out whether or not he’s telling the truth. Are you here for a scientific discussion, or to call names? The former has some chance of changing minds, while the latter only forces further entrenchment. I’d be happy to discuss science with you, as would several others here. But complaints about trivially irrelevant spelling errors, and baseless (certainly in this case) claims of misrepresentation, are counterproductive to such a discussion.
That’s “Pal-reviewed” and it isn’t “science”. Science involves experimentation, total and free sharing of all information such as ALL observations and including raw data before it is “adjusted” and the complete process and reasoning for the adjustments, and replication or refutation of results by anyone and everyone interested in attempting to do so, etc.
Oh and BTW, if ALL the data is not available for these processes then it isn’t science. Thus the Hockey stick is NOT science.
I hope NOAA get busted, it is about time some serious questions were getting asked as the weather is not changing. Everyday it becomes more like a Medieval religion to worship the great god “computer model” and ignore the beautiful world outside. I blame tv!
This graph shows the changes they made just since last year:
http://oi64.tinypic.com/2eokwub.jpg
It shows that changes up or down were made every year but down changes were made only prior to 1975 effectively lowering the past to increase the trend.
The graph indicates they cooled 1998 slightly, to erase the pause.
>NOAA graphs showed no temperature rise after 1998.
Steven, the entire graph for 1998 to present, the period you call the hiatus, is well above the trend line. In other words, it is all warming. Besides that, the surface air temperature represents only 2% of global warming. About 93% goes into the oceans. Some of that is coming back out now as a major El Nino event. And finally, the 12 months ending in October 20125 are the warmest year on record.
And AGAIN Martin the Pigeon Alarmist shows he doesn’t even understand the meaning of the words in written English much less anything about climate.
ARGO data from Jan 2004 – Sept 2015 @ 2000m shows an anomaly of ~0.006C. Where is this magic ocean heat living?
Why did you pick 2000m?
What depth would you like?
Given that the graph Steven is using only goes to 2008, start by explaining why you chose 2015. Then answer my first question. Why did you pick 2000m? Or, why did you pick a specific depth? Then read this: http://www.skepticalscience.com/cooling-oceans.htm
It was you that stated that 93% of ‘global warming’ goes into the oceans and some of that ‘heat’ is now starting to come out due to a natural event called ENSO (El Nino – La Nina).
And NO …. I refuse to read any links to SkS. If I want to read a site written by a cartoonist I would much prefer to visit Peanuts (or similar).
ok, Bruce, it is your right to refuse to read the science. But it’s not me who says 93% of global warming goes into the oceans. The science you refuse to read says it.
Hey martin, you ask “Why did you pick 2000m?”
Why? Because that is the format of the reports upon which “the oceans ate the heat” meme is based. Here is the money quote from Argo’s own website.
“For the upper 700m, the increase in heat content was 16 x 10^22 J since 1961. This is consistent with the comparison by Roemmich and Gilson (2009) of Argo data with the global temperature time-series of Levitus et al (2005), finding a warming of the 0 – 2000 m ocean by 0.06°C since the (pre-XBT) early 1960’s.” http://www.argo.ucsd.edu/global_change_analysis.html
Ask yourself — why is that the idea that the oceans are heating up expressed as so many joules being sucked up? How many people are so familiar with joules that they have an intuitive grasp of 10^22 joules? Additionally, ocean measurements do not measure joules, they measure temperature. Why do a conversion of degrees changed into joules added? I even asked about this change on one of the popular warmist site (I forget whether it was Sceptical Science or Climate Progress. I was told that “there are always ways to make a big number seem like a small number”. Anyway, those were certainly the questions that immediately occurred to me when I first saw the ocean heat claims — so I did the math, and honestly, the math is very simple, no more than junior high level. What you find is that the frightening “ocean ate the heat” idea comes to this: over the last half century or so, our measurements show that the average temperature of the ocean volume which we now (for only the last decade or so) have even reasonably accurate data, have risen about 0.06 degrees. That’s it. Less than one tenth of one degree over the last half century. Now, ask yourself this question: with what accuracy do we even know what the average temperature of the total oceans of the planet was down to a depth of two kilometers half a century ago. Do you really think that we have that information to an accuracy of one hundredth of a degree? Really? I suspect that a more reasonable answer would be maybe with one degree or one half a degree. Certainly not so close that the currently reported 0.06 degrees has any real meaning.
Martin, I have gone to great trouble to be as unoffensive as possible with you, but speaking plainly, if you have fallen for the 20 X 10^22 joules of heat fiasco, you show very poor skills regarding science.
SKS SCIENCE??? ROTFLMAO!!~!!
http://2.bp.blogspot.com/-YYVrr8BJIj4/U3CA_pKUGjI/AAAAAAAABKE/o8O69K9MHng/s1600/Cook+Cartoonist.gif
Cook even says he is a CARTOONIST.
He is laughing at you and the rest of the Useful Idiots.
http://3.bp.blogspot.com/-lbw90JPZq6Q/U3B9roVxLAI/AAAAAAAABJ4/swCjiaMzqFk/s1600/Herr+Cook.gif
Cook has the ethics of a CONMAN. He doesn’t believe in a fair debate but instead REWRITES HISTORY and even modifies people’s comments!
I actually read the words, Gail, the ones in the report that go with the graph Steven posted. The words he didn’t post. I do understand them.
Martin, you said “Steven, the entire graph for 1998 to present, the period you call the hiatus, is well above the trend line. In other words, it is all warming.“
>>>>>>>>>>>>>>>
This is an incorrect use of the English language and completely mucks up the meaning which of course was you intention. This is a common Progressive trait. They change the meaning of words in order to confuse, cover-up or deflect the conversation.
A Phd Physicist in the Czech Republic will explain this to the people you are trying to confuse:
You misunderstood the remark, Gail. There is a trend line through the data, which, when extended into the future projects where the global average temperature should be. The current trend line has not change since the beginning of Steven’s cherry-picked period, even though his cherry-picked period ends several year before the present. Nevertheless, before that period, the trend line was established, and the global average temperature for each year in his cherry-picked period is well above the projected temperature for that year. In that sense, all of the area under that portion of the graph represents warming.
However, the presences of this relatively flat period in the data does not mean warming has stopped. This animation illustrates the point. There have been many hiatuses (is that the right form?): http://www.skepticalscience.com/graphics.php?g=47
WOW!
Look at Martin twist and turn and he STILL misses the point of it all!…. Or is he just playing the usual Progressive word games meant to confuse?
It is NOT WARMING MARTIN! It is cooling with a bit of a roll a coaster effect. The hiatus is more than likely the peak of the Modern Warm Period. And the Modern Warm Period WILL peak just like all the other warm periods during the Holocene.
http://jonova.s3.amazonaws.com/graphs/lappi/gisp-last-10000-new.png
CO2 is out gassed by the ocean and LAGS the temperature over the long term by about 800 years. Heck CO2 doesn’t even match the temperatures of the Modern warm period!
http://icecap.us/images/uploads/USHCNvsCO2.jpg
This of course is why NOAA has to make adjustments.
https://stevengoddard.files.wordpress.com/2014/10/screenhunter_3233-oct-01-22-59.gif
An R= to 1 is a perfect correlation. To any HONEST scientist this is evidence of FRAUD especially when all the rest of the evidence shows no reason for the adjustments.
Martin “….There is a trend line through the data, which, when extended into the future projects where the global average temperature should be….”
>>>>>>>>>>>>>>>
Well Martin, it would seem that the Earth never got the memo of where the global average temperature should be….”
http://jonova.s3.amazonaws.com/graphs/lappi/Five_Myr_Climate_Change_Rev.jpg
Hey Gail! “To any HONEST scientist this is evidence of FRAUD especially when all the rest of the evidence shows no reason for the adjustments.”
Yes, exactly! Not proof, not in an absolute, mathematical sense — but proof in the “beyond a reasonable shadow of doubt” sense. If one uses the standard of absolute proof, even a full confession does not meet that standard. Real word, real people, use reasonable doubt as a criteria.
Well above which trend line? Here are some words from that report you read:
” The trend in the ENSO-related component for 1999–2008 is +0.08±0.07°C decade, fully accounting for the overall observed trend. The trend after removing ENSO (the “ENSO-adjusted” trend) is 0.00°±0.05°C decade, implying much greater disagreement with anticipated global temperature rise.”
For those with reading comprehension issues (Martin), the above says what they predicted did not happen. There is absolutely no CO2 signal in the recent temperature trend.
The trend through all the data since, say 1975, Doug. And you have cherry-picked a quote from the entire piece again. Read the entire discussion. Furthermore, the graph and paper are quite old. A lot of research has been done since then. In fact, we have had at least three hottest years on record, and we are working on a fourth.
We all tire of this cherry picking claim. It’s a direct quote, in context, from peer reviewed study. If said quote isn’t supported by the evidence, why was it allowed to stand? Can you show us where one of the reviewers invalidated it? Can you even explain why you don’t think the quote isn’t representative of the facts presented in the paper?
Actually, Tony has given you plenty of reasons to doubt the peer review process. But you’ve so far rejected them all. Have you changed your position on that subject? If so, can you tell us why?
In fact, we have had at least three hottest years on record, and we are working on a fourth.
What a very odd sentence. Are you the Winston Smith of NOAA editing the temperature history for Big Brother in the Ministry of Truth?
“In fact, we have had at least three hottest years on record, and we are working on a fourth.”
What a load of unmitigated garbage.
Only in the fantasy fabricated world of GISS do these records exist, and even then the current temperature is well below the temps if the MWP, RWP and most of the first 3/4 of the Holocene.
We are actually only just above the COLDEST period in the last 10,000 years
You really need to get a basic education, little Gore bot, because you are making a moronic fool of yourself with your ignorance of basically everything.
Here is start.. from real sciences at the ice face.
https://vimeo.com/14366077
https://krissycakes.files.wordpress.com/2014/01/caudron1.jpg
(It is even eatable!)
Maritn says “…besides that, the surface air temperature represents only 2% of global warming. About 93% goes into the oceans…..”
>>>>>>>>>>>>
WOW, thanks Martin for PROVING the Modern Warm Period has natural causes!!!
Note that not even all wavelengths of sunlight penetrate into the oceans to warm it. (Original graph from The SORCE Mission, LASP, University of Colorado.)
https://web.archive.org/web/20130506055716/http://lasp.colorado.edu/sorce/images/instruments/sim/fig01.gif
Enlargement of the blue line area annotated:
http://www.john-daly.com/sverdrup.gif
Note the legend says:
In other words all back radiation in the far infra-red from the Greehouse Effect does is aid evaporation. The energy penetrating the ocean are at the sun’s short wavelengths, EUV, UV and VIS AND THOSE WAVELENGTHS VARY OVER TIME!
NASA: SORCE’s Solar Spectral Surprise
http://www.co2science.org/articles/V17/N32/Usoskinetal2014b.jpg
PAPER:
A History of Solar Activity over Millennia
You will have to list the natural causes for me, Gail. We know it’s not the sun because the sun’s output has been dropping slightly.
Total output is only one part of the question. Another part is how that energy is distributed among various wavelengths. Another part is solar wind intensity and cosmic ray shielding, which affects cloud formation.
Seems Martin wants an instantaneous change from the solar imput into the oceans.
If that were the case there would be no life on the planet.
Ever hear of Heat Capacity and 326,000,000,000,000,000,000 gallons (326 million trillion gallons ) of water?
So Martin wants an explanation?
https://media2.stickersmalin.com/produit/100/stickers-devil-smile-R1-143760-2.png
Start reading Martin just like I did and connect the dots. When you finished those I have more….
digitool(DOT)library.colostate.edu/exlibris/dtl/d3_1/apache_media/L2V4bGlicmlzL2R0bC9kM18xL2FwYWNoZV9tZWRpYS8zNjYwMw==.pdf
onlinelibrary(DOT)wiley.com/doi/10.1002/2013JD021065/abstract
(wwwDOT)giss.nasa.gov/research/features/200402_tango/
iopscience(DOT)iop.org/1748-9326/5/3/034008/pdf/1748-9326_5_3_034008.pdf
(wwwDOT)atmos-chem-phys.net/11/11679/2011/acp-11-11679-2011.pdf
(wwwDOT)columbia.edu/~lmp/paps/previdi+polvani-QJRMS-2014-inpress.pdf
scitation(DOT)aip.org/content/aip/magazine/physicstoday/article/67/7/10.1063/PT.3.2449?dm_i=1Y69,2LFVV,E4CSKB,9H5SN,1
www(DOT)nature.com/ngeo/journal/v5/n6/abs/ngeo1460.html
onlinelibrary(DOT)wiley.com/enhanced/doi/10.1002/2014SW001084/
(wwwDOT)sciencedirect.com/science/article/pii/S0273117713005474
(www)-pord.ucsd.edu/~sgille/pub_dir/i1520-0442-21-18-4749.pdf
cordis(DOT)europa.eu/news/rcn/30377_en.html
iopscience(DOT)iop.org/0004-637X/792/1/12/
heliophysics(DOT)nasa.gov/SolarMinimum24/papers/Abstracts_Selection_CCMSC.pdf
/onlinelibrary(DOT)wiley.com/doi/10.1029/2009JD012375/pdf
geo(DOT)phys.spbu.ru/materials_of_a_conference_2012/STP2012/Veretenenko_%20et_all_Geocosmos2012proceedings.pdf
Oh, and Martin those are ALL PEER-reviewed Papers. I like to read science papers. It is my hobby….
I feel the need to channel Gator:
“{Martin}, please do me two favors.
1- List all climate forcings, order them from most to least effectual, and then quantify them all.
2- Please provide even one peer reviewed paper that refutes natural variability as the cause of recent, or any, global climate changes.
There is nothing unusual or unprecedented about our climate, or how we got here. For 4,500,000,000 years climates have always changed, naturally. This means there has been a set precedent, and the burden of proof falls on natural climate change deniers like yourself.”
https://www.youtube.com/watch?v=UA0kNGaYrtg
I just got my ticket yesterday. No need to camp out this time, like I had to 16 years ago. THAT flaming turd was a disturbance in the force. Hopefully this one will be better.
If I hear one mention of “midichlorians,” I’m walking out.
The last 2nd of last century, when there was slight warming” has been classified as a GRANND SOLAR MAXIMUM, by some of the world’s top solar scientists.
That Grand Solar Maximum has now ended to be replaced by a very sleep Sol.
, and with the lag of about 10-15 years, the Earth is starting to cool in any REAL DATA.
But we all know how allergic the little Gore bot troll is to any REAL DATA.
Gail, for Martin the Gore troll, you need to provide a page with numbered dots and a crayon.
That’s the only sort of “join the dots” he is capable of ….. even then, only maybe.
http://medallionanimalclinic.com/sites/site-4620/images/CTD-4.jpg
Gail – However, instruments similar to TIM and SIM have made clear that the sun’s output actually fluctuates in sync with changes in the sun’s magnetic field.
And to connect those dots ..
Resonant absorption is a process where two different types of magnetically driven waves resonate, strengthening one of them. In particular this research looked at a type of magnetic waves known as Alfvénic waves which can propagate through a prominence (a filamentary structure of cool, dense gas floating in the corona). Here, for the first time, researchers were able to directly observe resonant absorption between transverse waves and torsional waves, leading to a turbulent flow which heats the prominence. Hinode observed the transverse motion and IRIS observed the torsional motion; these results would not have been possible without both satellites.
This new information can help explain how the solar corona reaches temperatures of 1,000,000 degrees Celsius; the so called “coronal heating problem.”
And what is the type of radiation created at 1 million degrees. X-ray, EUV, UV. Take a look at the A180 pictures on a solar page. See the extra area recorded at that wavelength. And that is what heats the ocean storage.
Side laugh. They should have just asked Dr. S as he knows everything about the sun.
forgot the link – http://www.sciencedaily.com/releases/2015/08/150824064742.htm
Thanks DD
That adds one more ‘Dot’ to the picture.
Too bad CAGW and the race towards poverty and 17th century living has stunted scientific discovery during the last forty years.
We should be mining Mars and asteroids for raw materials by now.
I grew up on science fiction and the NASA space missions. In the late 1970s I met a woman who had gone from horse drawn buggies, outdoor plumbing and one room schools to watching a man walk on the moon. AMAZING!
What has our generation done? We elected Clinton who hand our technology to China and the other Progressives who trash our education system, our manufacturing and our economy. Not a legacy to be proud of.
Prior to MLO the atmospheric CO2 concentrations, both paleo ice cores and inconsistent contemporary grab samples, were massive wags. Data at some of NOAA’s tall towers passed through 400 ppm years before MLO reached that level. IPCC AR5 TS.6 claims uncertainty in CO2 concentrations over land. Preliminary data from OCO-2 suggests that CO2 is not as well mixed as assumed. Per IPCC AR5 WG1 chapter 6 mankind’s share of the atmosphere’s CO2 is basically unknown, could be anywhere from 4% to 96%. (IPCC AR5 Ch 6, Figure 6.1, Table 6.1)
The major global C/CO2 reservoirs (not CO2 per se, C is a precursor proxy for CO2), i.e. oceans, atmosphere, vegetation & soil, contain over 42,000 Pg (Gt) of C/CO2. Over 90% of this C/CO2 reserve is in the oceans. Between these reservoirs ebb and flow hundreds of Pg C/CO2 per year, the great fluxes. For instance, vegetation absorbs C/CO2 for photosynthesis producing plants and O2. When the plants die and decay they release C/CO2. A divinely maintained balance of perfection for thousands of years, now unbalanced by mankind’s evil use of fossil fuels.
So just how much net C/CO2 does mankind’s evil fossil fuel consumption add to this perfectly balanced 42,000 Gt cauldron of churning, boiling, fluxing C/CO2? 3 Gt C/CO2. That’s correct, 3. Not 3,000, not 300, 3! How are we supposed to take this seriously?
IPCC AR5 attributes 2 W/m^2 of unbalancing RF due to the increased CO2 concentration between 1750 and 2011. In the overall global heat balance 2 W (watt is power, not energy) is lost in the magnitude and uncertainty of: ToA, 340 +/- 10, fluctuating albedo of clouds, snow and ice, and the absorption and release of heat from evaporation and condensation of the ocean and water vapor cycle. (IPCC AR5 Ch 8, FAQ 8.1)
IPCC AR5 acknowledges the LTT pause in Text Box 9.2 and laments the failure of the GCMs to model it. IPCC GCMs don’t work because they exaggerate the role, i.e. climate sensitivity, of CO2/GHGs RF in the heat balance and dismiss the role of water vapor because man does not cause nor control it.
The sea ice and sheet ice is expanding not shrinking, polar bear population is the highest in decades, the weather (30 years = climate) is less extreme not more, the sea level rise is not accelerating, the GCM’s are repeat failures, the CAGW hypothesis is coming unraveled, COP21 has all the makings of yet another embarrassing fiasco, IPCC AR6 will mimic SNL’s Rosanna Rosanna Dana, “Well, neeeveeer mind!!”
Nicholas Schroeder, your candid comments here may help humanity.
1. “Is there convincing evidence for AGW?” https://www.researchgate.net/post/Is_there_convincing_evidence_of_AGW
2. “Geoethics: the principles of ethics in Natural Sciences”
https://www.researchgate.net/publication/283641399_Geoethics_the_principles_of_ethics_in_Natural_Sciences