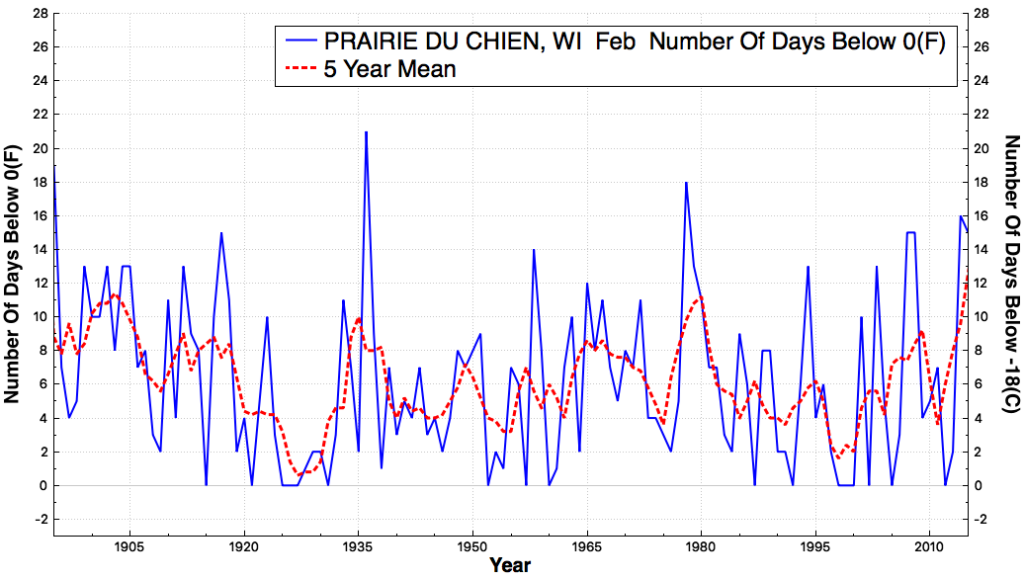
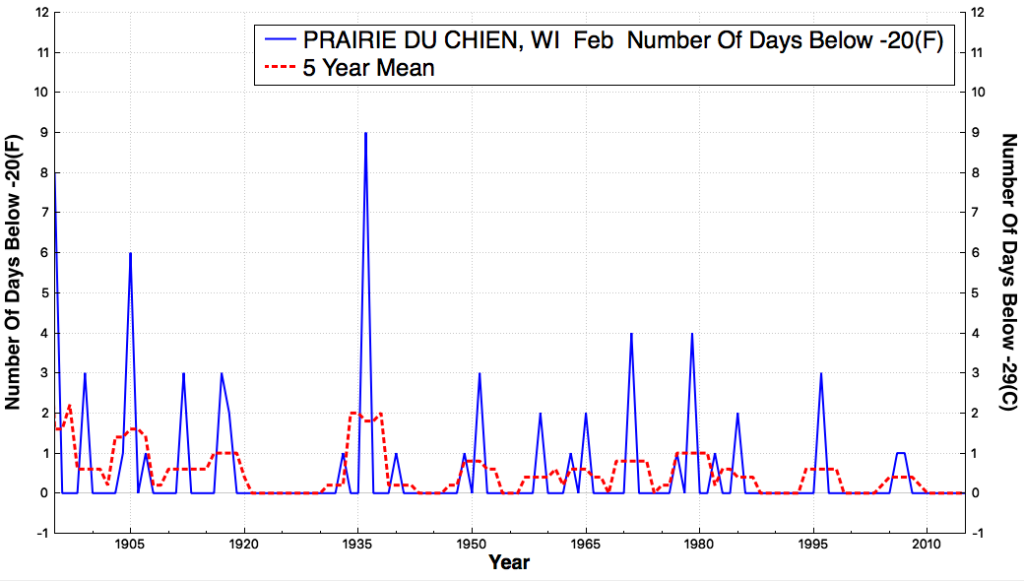
Eighty years ago this month was one of the coldest months in US history. Prairie du Chien Wisconsin had 21 nights below 0F, and nine nights below -20F
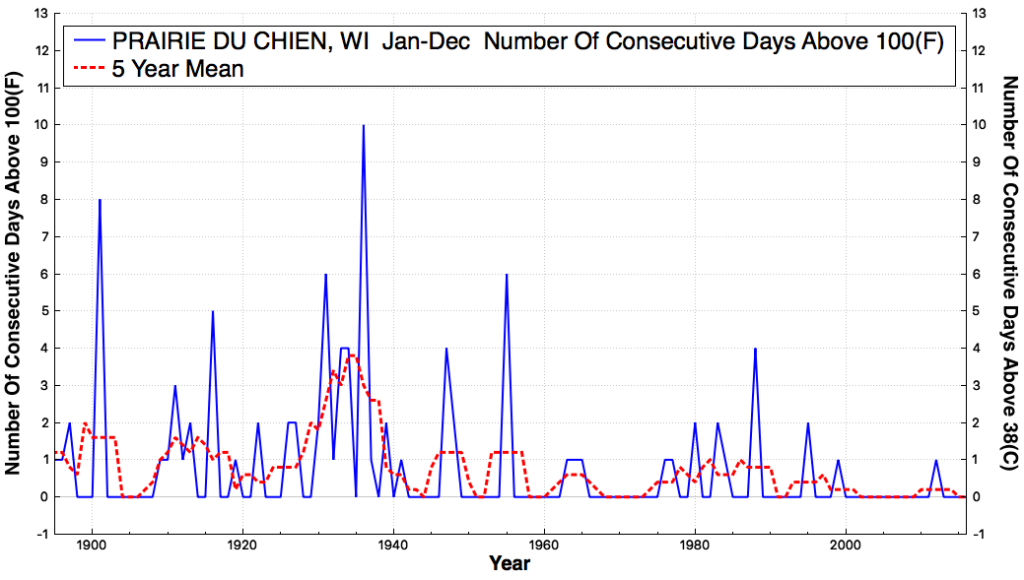
The summer of 1936 was the hottest in history. Prairie du Chien recorded 10 consecutive days over 100F.


Which just goes to show that our impotent politicians do not, in fact, control the weather … that must frustrate the heck out of them.
It was never about controlling the weather but the issue does allow them to blame their opposition. If it weren’t for us evil deniers they would already be well on the way to controlling the climate they say.
jonrappoport.wordpress.com/2016/02/02/zika-the-cdc-is-the-medical-cia/
http://www.jonrappoport.wordpress.com/2016/02/02/zika-the-cdc-is-the-medical-cia/
If these climate clowns want to talk about extreme weather, nothing in recent times can come close to 1936. Of course, we all know that in 1936, evil white males caused the extreme weather by raping the soil with their plows. Every idiot knows that if it had been people of color plowing the soil, the results would have been FAR better.
Are you going to make the program available for us to use, Tony?
Yes!
The
Thanks, Steven aka Tony, for this reminder of the extreme temperatures my parents suffered the year I was born.
In some ways humanity was better off knowing that they did not know the forces that control Earth’s variable weather. Modern science is plagued with artificial knowledge.
We are seeing something like that again in the current US data.
Not for hot days. Look at the graphs.
I’m looking at the same location using the NOW data. And I am talking about the days below 0
http://w2.weather.gov/climate/xmacis.php?wfo=arx
It’s not matching your graphs at all. What the heck?
Shows 1978, 1963, 2008 and 2014 had more nights below 0 than 1936
February. Please read carefully.
also shows 1936 as 14 days below -20
February. please read carefully.
Ah, now it makes sense. My bad, Apologies and all that.
(smack self)
STUPID! STUPID! STUPID!
The Tmax data for WI definitely shows it was much hotter in the thirties. We see this same thing all over the map.
I’d be willing to bet that the Pacific was cold that year (low moisture = more extreme cold and heat)
do notjudge the Russians too harshly tney are very pro Israel https://www.youtube.com/watch?v=eR-xRwPvU6I
Anyone have a link to the DMI 15% sea ice graph?
Do you mean this ?
http://Ocean.dMi.Dk/arctic/plots/icecover/icecover_current_new.png
That was … Ocean.dMi.Dk/arctic/plots/icecover/icecover_current_new.png
As opposed to the 30% which is
http://Ocean.dMi.Dk/arctic/plots/icecover/icecover_current.png
at Ocean.dMi.Dk/arctic/plots/icecover/icecover_current.png
The lower one is what I meant the other is still where it has been for some time. Thanks Neal S. I appreciate it. Saved the link.
Not even Lake Erie is frozen this year.
http://www.glerl.noaa.gov/res/glcfs/compare_years/
Reblogged this on Climate Collections.
Thank you, Steven, for reminding the public that extreme weather is not necessarily man-made.