
Contrary to the lies of a few key government scientists propagandists, the US climate has been getting less extreme over time.
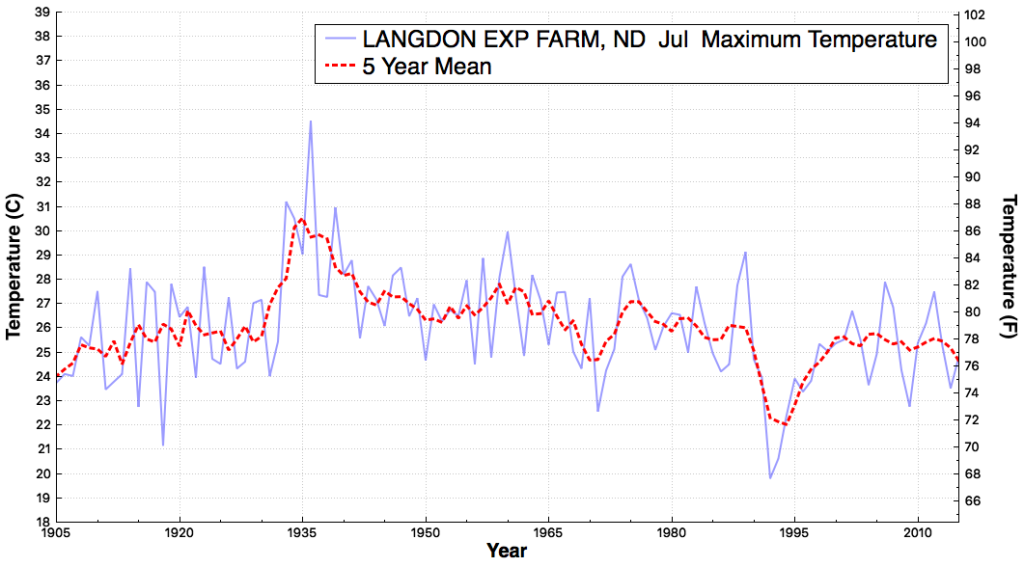
But it wasn’t always that way. During July, 1936 afternoons at Langdon Exp Farm, North Dakota averaged nearly 95F (35C)
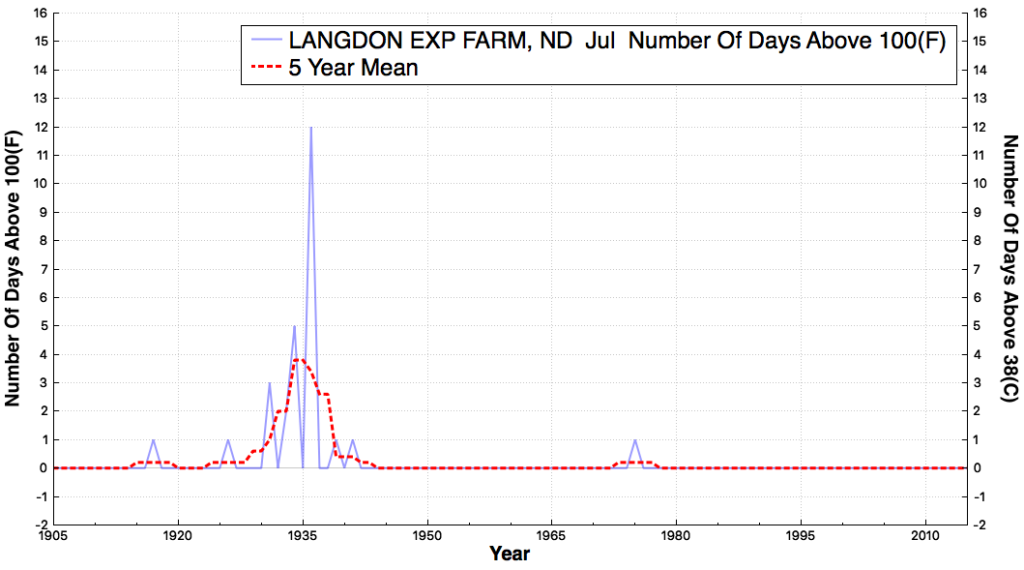
Nearly half of the days were over 100F
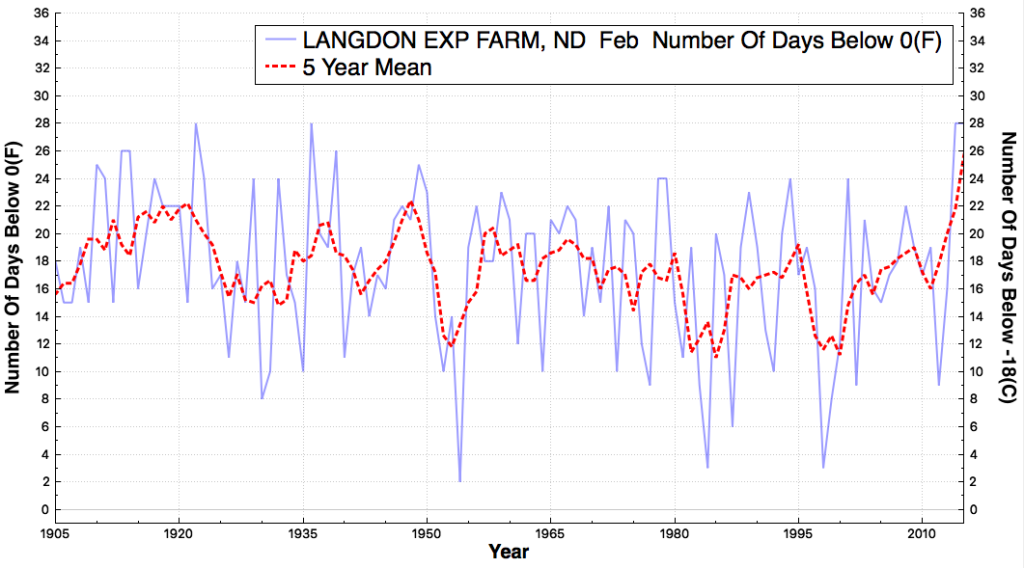
During February, 1936 every single night was below 0F
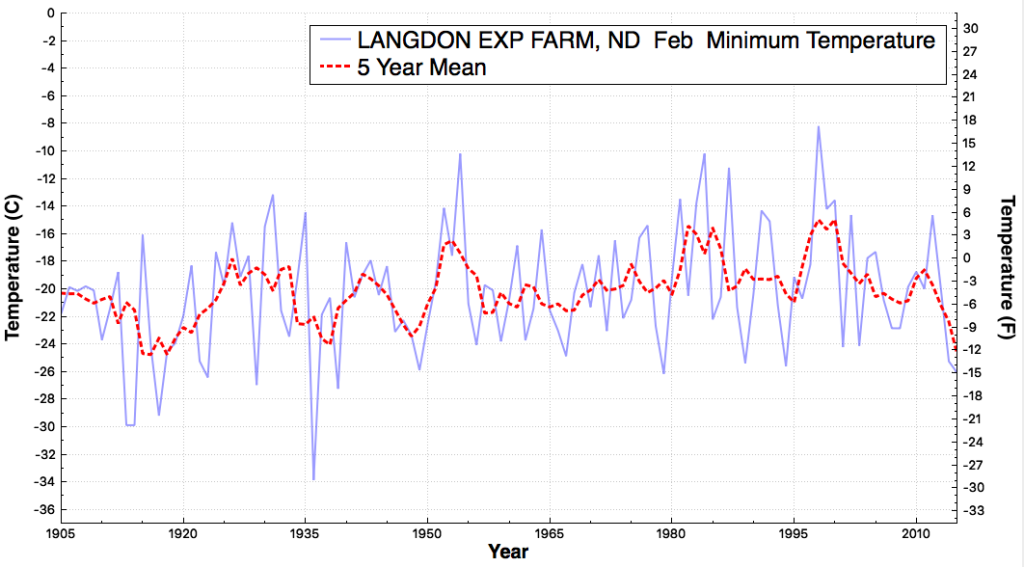
And nights averaged an unbelievable -29F that month.
A few weeks later, fifteen eastern states were underwater.
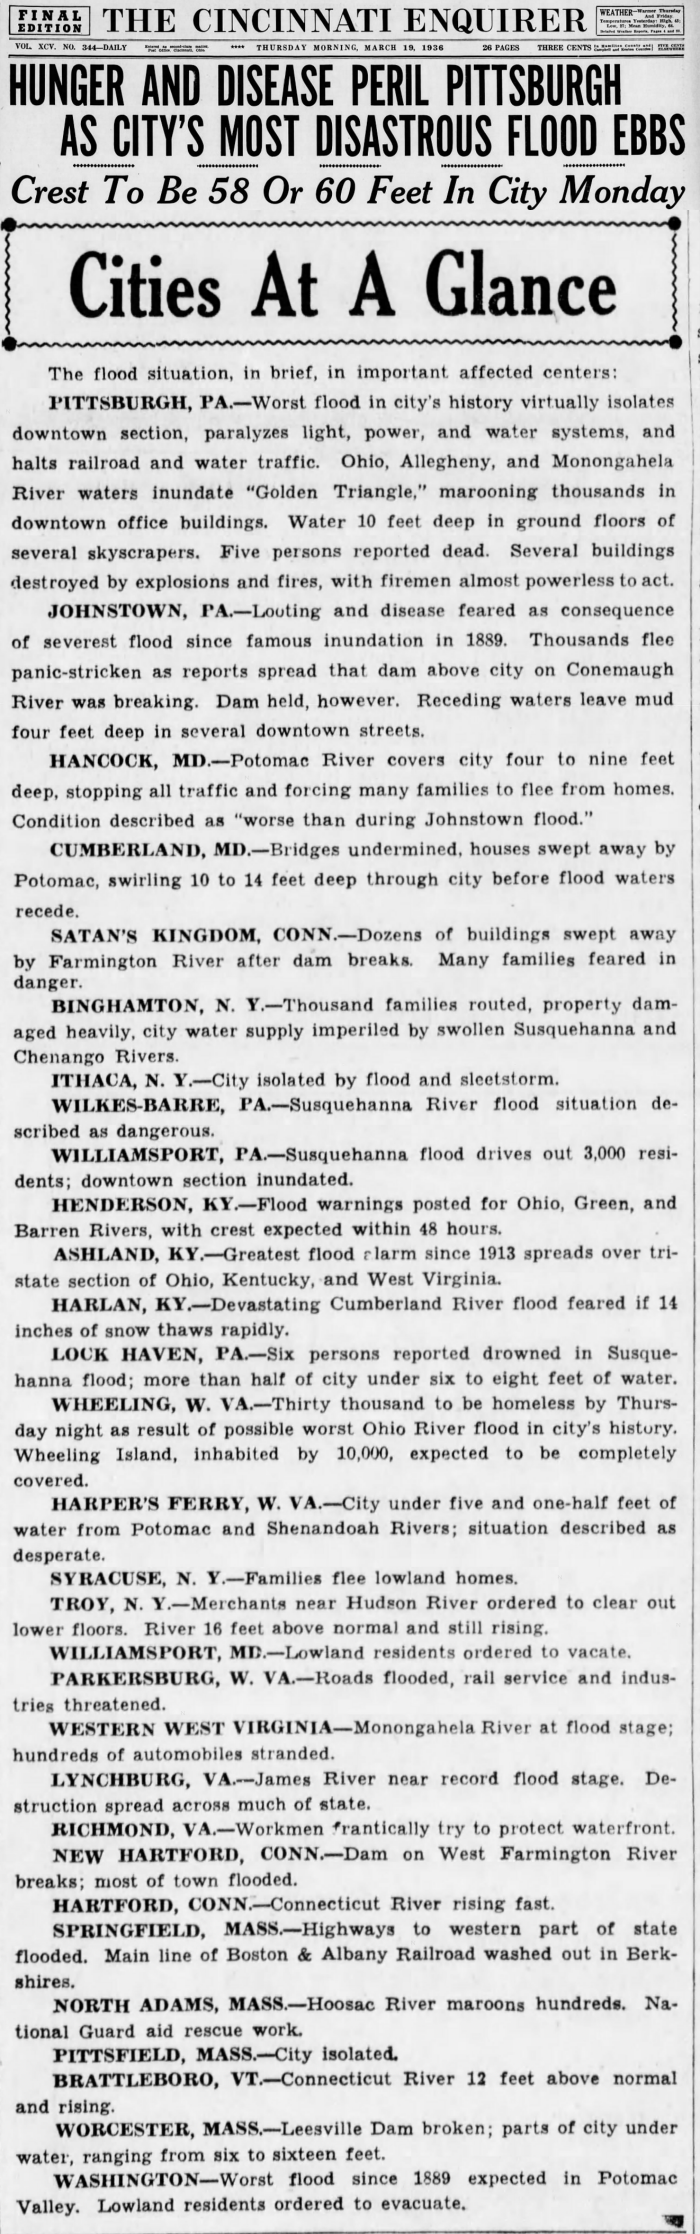
19 Mar 1936, Page 1 – at Newspapers.com
Not to mention the rise of Nazi Germany, The Depression and The Dust Bowl. We live in very mild times. The most extreme thing is the stream of lies coming out of Washington DC.

I wish to disagree with your statement, “Contrary to the lies of a few key government scientists/propagandists, the US climate has been getting less extreme over time,” . . .
but unfortunately your statement correctly reflects the reality of current government funded climatology.
As far as extreme weather, it has been going on since the earth existed, and for claimed climate change, the IPCC said itself that any the fraction of a degree per decade forecasted would be unnoticeable by humans. And as far as RSS, any temperature change is statistically insignificant now for last 20 years if look at data and reality instead of unproven theory.
It is amazing how gov. and news media can twist almost anything into some extreme catastrophe story like a science fiction novel.
Not to mention tornadoes on consecutive days killing over 400 in April 1936. One hit Tupelo, MS and almost took out the infant Elvis Presley and the second hit Gainesville, GA, wiping out a factory, back in the days when we had factories.
Or the Labor Day hurricane of September 1935, the most intense in US history.
All while CO2 was at very safe levels.
“All while CO2 was at very safe levels.”
Sorry, but that is wrong.
CO2 was dangerously low back then, and it is still dangerously low.
A “safe” level would be somewhere above 700ppm, preferably a lot more.
About the historical record of tornado numbers and intensity.
Really for numbers the record has to be divided into at least three distinct segments.
Pre weather radar, post weather radar, and post national coverage by Doppler radar.
We detect many more tornadoes now that we used to and even with all are technology today there are times that damage is caused and the determination of it was a tornado or straight line winds can only be made by visual inspection of the damage and path.
For intensity the Fujita scale only came into existence in 1971 and the enhanced Fujita scale in 2007. Both yield only approximations of wind speeds based on engineering assessments of damage, swirl patterns, etc.