
arctic.atmos.uiuc.edu/cryosphere/timeseries.anom.1979-2008
These hacks known as government scientists are wrong year after year, so they tamper with data and double down on their fraud.
arctic.atmos.uiuc.edu/cryosphere/timeseries.anom.1979-2008
These hacks known as government scientists are wrong year after year, so they tamper with data and double down on their fraud.

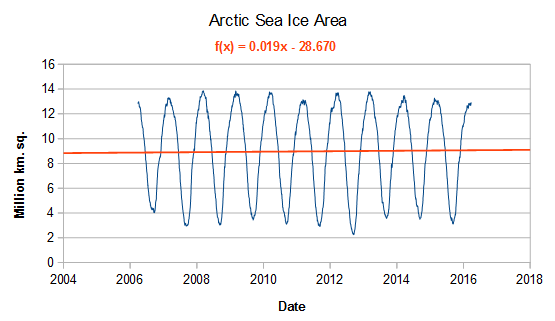
So, from 2006 it gained 0.02 million km sq / year on average, 0.2 million km sq in total.
That is not so small?
It is like I said.
we are globally cooling.
Also, I noticed that we are cooling from the top latitudes downward.
That means more arctic ice AND more antarctic ice.
If all ice on earth was gone, how would it affect temperature globally on earth? it wouldn’t… are you saying it would? are you saying that the earth at it’s equator controls the polar regions?
This has the potential to make me laugh uncontrollably, so be careful if you reply Henry
dear Sparks
in terms of AGW [which implies an increase in minima]
I have determined it is not at all happening
https://i0.wp.com/oi62.tinypic.com/33kd6k2.jpg
minima are going down
just about everywhere….
Of course they are Henry, my point is, like all other reasonable aspects being relative, warming or cooling are the effect of natural processes unrelated to earth’s atmospheric composition, there is a reason for ice, there is a reason for no ice, planetary composition of gas does not fit at all. the human equation, even in terms of volcanic activity, human production seems pretty pitiful. turn your heating up and cause more cooling does not fly with me, turn your air conditioning up and cause more warming does not fly with me either. I’m thinking someone has their arm in, that’s what it comes down to… thanks for the laugh 😉
Here is the antarctic ice chart.
http://nsidc.org/data/seaice_index/images/daily_images/S_timeseries.png
Note that the grey line is the average 1981-2010
So, in 2014 we already had considerable more antarctic ice than the average.
This year (2015) we are more or less on the average, but bear in mind that 2015 was a hot year, most probably to do with the el-nino effect. Already, we can see that for 2016, the ice is growing again, [it passed the grey line] compared to the the 1981-2010 average.
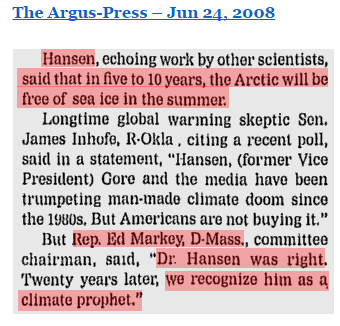
“We see a tipping point occurring right before our eyes,” Hansen told the AP before the luncheon. “The Arctic is the first tipping point and it’s occurring exactly the way we said it would.”
Hansen, echoing work by other scientists, said that in five to 10 years, the Arctic will be free of sea ice in the summer.
-James Hansen : ‘This is the last chance’: 6/23/2008
http://usatoday30.usatoday.com/tech/science/2008-06-23-1642922053_x.htm
So according to Hansen, the Arctic will be ice free in the next two years.
James “Harold Camping” Hansen.
At least Harold Camping was smart enough to quit after a couple of failed predictions. Hansen is like the Energizer Bunny, he just keeps going and going and going…. Maybe he thinks if he makes enough predictions, one of them will have to be right.
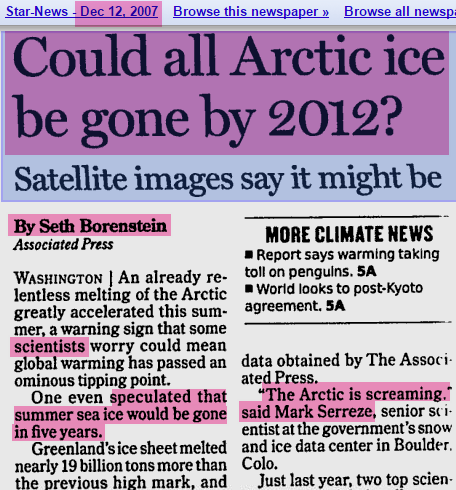
The Arctic keeps screaming. Mark Serreze is screaming. Meanwhile, nothing meaningful is happening. To me it sounds more like a lunatic asylum than anything remotely scientific.
The Arctic keeps screaming. Mark Serreze is screaming.
I think you will find that Serreze is simply a ventriloquist.
lol
+1
NOAA’s Sea Ice Index continues to underestimate ice extent, as it has all year:
https://rclutz.files.wordpress.com/2016/03/masie-sii-2016-day88.jpg
Another “Ship Of Fools” sets sail:
http://www.theguardian.com/us-news/2016/mar/28/us-canada-arctic-cruise-ship-titanic-emergency-training-coast-guard
Crazy. They have not got a clue about the weather. This is going to end on a disaster of some sorts….
“1,700 passengers and crew” and an icebreaker to clear the way. Why would they do such a thing?
Ahem….maybe this explains it: “Prices for the journey aboard the 14-deck luxury liner start at nearly $22,000 rising to $120,000 for a deluxe stateroom – and this year’s cruise is sold out, according to the company.”
In the wake of that ship will be the gray-water waste of 1,700 people, but in the bow people will clasp their hands and go on and on about how folk like you and I harm the environment, by staying home and working.
Guess who will be working as tour guides?
“Ice pilots, polar bear researchers, and veterans of other Arctic expeditions will be aboard to ensure passengers’ safety and to protect the local wildlife, environment and customs, the company said.” (They may not call themselves “tour guides”, but I’m green with envy, so I do.) (I suppose that, if you love the arctic, you will do anything to avoid getting a Real Job down south.)
At least they’ll give me a subject for posts. (And I can be wicked, when venting my jealousy.)
https://stevengoddard.wordpress.com/2016/03/12/nsidcs-arctic-illusion/#comment-576680
The claim is that it is lowest since they started sat records…..but you are saying it was lower in 2006?
If Arctic sea ice is increasing since 2006 why is the Cryosphere graph below negative for that range?
http://arctic.atmos.uiuc.edu/cryosphere/IMAGES/seaice.anomaly.arctic.png
Andy
Because it was cooling from its highest extent as shown very clearly with the AMO index, which was at its lowest in 1979.
The utter STUPIDITY of continually to repeatedly displaying your IGNORANCE is getting very boring.
The statement “it was cooling from it’s highest extent” is nonsensical. That is temperature and area in one sentence.
SG’s statement was that over the last 10 years Arctic sea ice area has increased. Forget AMO or 1979, it’s irrelevant to that statement. Just look at the graph above. Has it increased since 2006?
” of continually to repeatedly displaying” is an interesting use of words. Not quite as bad as cooling from it’s highest extent though.
Andy
The fact that you think that the AMO is irrelevant to the Arctic, proves you are an ignorant goose.
And yes it HAS increased since 2006 ! The graph shows that.
Meanwhile, DMI’s new and improved! Arctic Sea Ice Extent graph is not doing too well. I hope they won’t have to put it down like the other one.
https://coloradowellington.files.wordpress.com/2016/04/dmi-arctic-sea-ice-extent-20161104.png
http://ocean.dmi.dk/arctic/icecover.php
Something is rotten in the Kingdom of Denmark and a few other fiefdoms.
———-
H/T Anthony Watts