
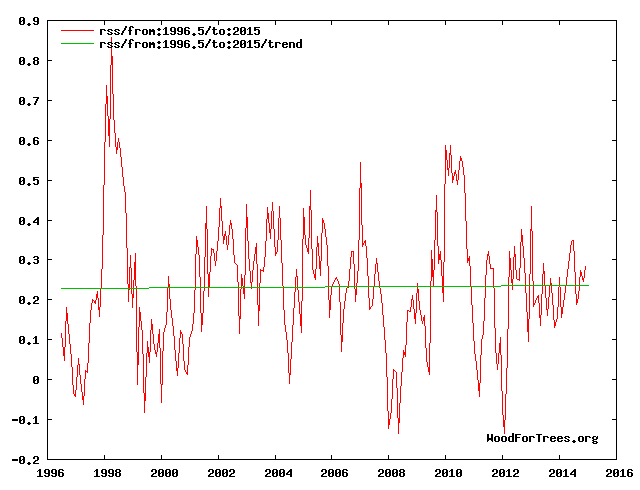
Another 16 year hiatus which was erased retroactively.
There was no warming from 1979 to 1995. There was also no warming from 1996 to 2015. When did this magical global warming occur?
Another 16 year hiatus which was erased retroactively.
There was no warming from 1979 to 1995. There was also no warming from 1996 to 2015. When did this magical global warming occur?

When did this magical global warming occur?
The question is where did it occur.
Here…
https://upload.wikimedia.org/wikipedia/commons/0/0a/Atlanta_thermal.jpg
And here…
http://climatestate.com/wp-content/uploads/2013/09/Super-Computer-NASA-Climate-Models.jpg
I notice an Erik Hansen also contributed to this. I can’t find anything about him (there are too many of them out there apparently), but I wondered if he is any relation to James or if it’s just a coincidence.
Didn’t he list one of his grand kids as a co-author on one of his papers?
Could it be the Hansen triplets?
Very appropriate!
There seems to be a baseline shift in temps around 2000-2003. There was also one in 77-78. The small warming appears to be stair stepped.
http://www.drroyspencer.com/wp-content/uploads/UAH_LT_1979_thru_February_2016_v6.gif
I picked the wrong day to quit sniffing glue!
https://www.youtube.com/watch?v=hd1ciPnTGKg
Yea because I really sniff glue, I’m glad you got that reference… awesome 🙂
hahaha
Tomorrow arctic air will attack the northern United States.
http://www.cpc.ncep.noaa.gov/products/stratosphere/strat_a_f/gif_files/gfs_z100_nh_f24.png
http://vortex.accuweather.com/adc2004/pub/includes/columns/newsstory/2016/650x366_03290839_hd33.jpg
Thanks for reminders of reality.
Reblogged this on TheFlippinTruth.
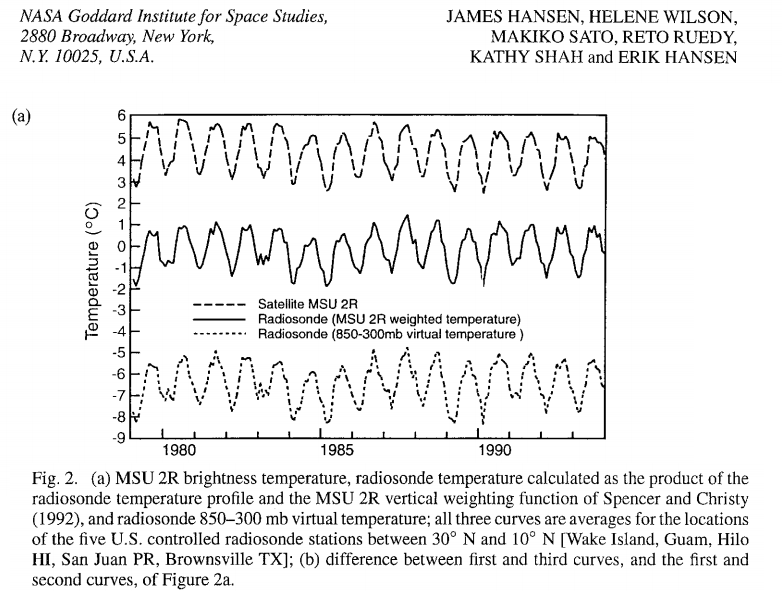
NOAA or NASA never mentions or takes into account or adjusts for the Urban Heat Island but Hasen admits in this paper that it would be on the order of plus .1 degrees per century, I believe that we have more UHI now then we did back in 1916, why no adjustment downward in surface temperatures .
From page 115
“Urban warming of surface air, if of the order of 0.1 °C/century (IPCC, 1990; Hansen and Lebedeff, 1987)”
Hansen and Mann are puppets. The real problem is the National Academy of Sciences reviewing annual budgets of government agencies for Congress and directing research funds of diverse agencies to align US policies with UN’s Agenda21. It does not matter who we elect as President if NAS continues to control US policies through control of the budgets of government research agencies.
Satellite “temperature” measurements are prone to errors from multiple sources. As shown in a table in Wikipedia ( https://en.wikipedia.org/wiki/Satellite_temperature_measurements ) the early years of satellite measurements measured “cooling” when in fact, there wasn’t cooling. The “cooling” turned out to be measurement errors.
Also see:
“Which is a more reliable measure of global temperature: thermometers or satellites?” http://www.skepticalscience.com/Satellite-record-vs-thermometers.htm
Overall, satellite “measurements” should be interpreted as “open to further adjustments” in the future.
Weather balloon observations have used “old fashion”, easy to calibrate thermometers for decades. Here are the complete weather balloon (radiosonde) anomalies for the 3 lowest atmospheric layers. (These constitute the lowest 1/2 of the atmosphere.)
850 mb level: http://www.durangobill.com/GwdLiars/GwdRATPAC850.jpg
700 mb level: http://www.durangobill.com/GwdLiars/GwdRATPAC700.jpg
500 mb level: http://www.durangobill.com/GwdLiars/GwdRATPAC500.jpg
(Radiosonde Atmospheric Temperature Products for Accessing Climate (RATPAC))
The stratosphere is cooling as per global warming models. (The 100 mb level averages a little over 50,000 feet above sea level.)
http://www.durangobill.com/GwdLiars/GwdRATPAC100.jpg
The description for the above charts can be found at:
https://www.ncdc.noaa.gov/data-access/weather-balloon/radiosonde-atmospheric-temperature-products-accessing-climate
If you follow a couple of links at the above webpage, you can access the source data for the above charts. It’s the 850 mb, 700mb, and 500 mb data in the “Globe” section at:
http://www1.ncdc.noaa.gov/pub/data/ratpac/ratpac-a/RATPAC-A-annual-levels.txt
U.S. solar company SunEdison, whose aggressive acquisition strategy has saddled it with more than $11 billion of debt, is at “substantial risk” of bankruptcy, one of its two publicly listed units warned on Tuesday.
SunEdison’s shares—already reeling from a Wall Street Journal report that the company was being investigated for overstating its cash position—fell more than 40 percent.
http://www.cnbc.com/2016/03/29/sunedison-at-risk-of-bankruptcy-shares-plummet.html
https://youtu.be/QWBPQSSiuzU
Snow can reach the Atlantic coast.
http://www.accuweather.com/en/weather-news/subfreezing-highs-to-return-to-northeastern-us-great-lakes-early-april/56335323
Kevin Sealy · St. John’s University
“The winter of 2015-16 has has a strange winter, especially the NewYork City metro area getting from 30-45 inches of snow in an El Nino winter. I’ve heard we may be in the stages of a La Nina.”