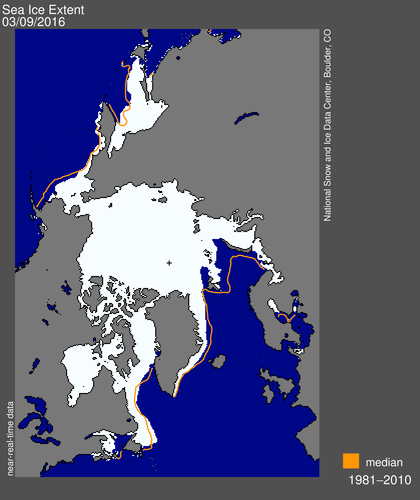
NSIDC continues their hysterics, hinting that theArctic is crashing and doomed, due to record heat.

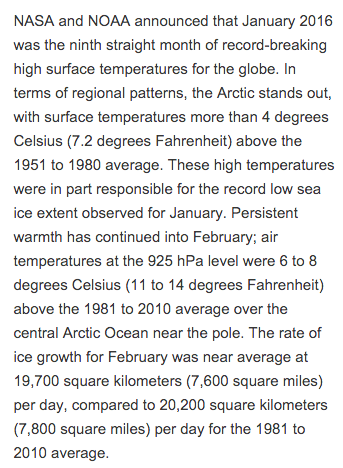
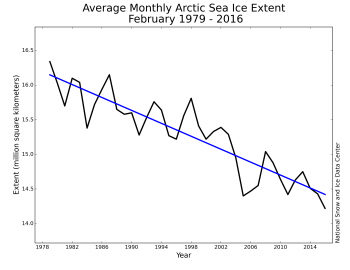
Arctic Sea Ice News and Analysis
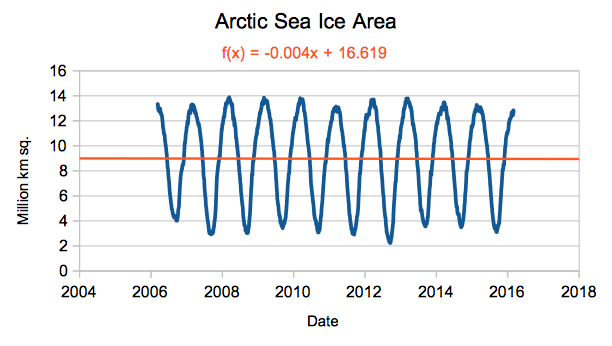
Scary stuff – except that the area of ice in the Arctic hasn’t changed for a decade. Decadal trend is ice-free in 2,250 years.
The record Arctic heat is actually about -25C.
Ocean and Ice Services | Danmarks Meteorologiske Institut
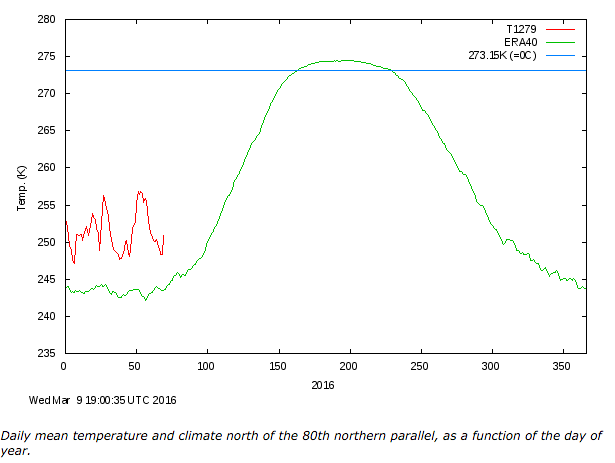
Ocean and Ice Services | Danmarks Meteorologiske Institut
Arctic ice extent is essentially at the 30 year mean, except for the Barents Sea – where winds have been pushing the ice edge towards the pole. This is hardly cause for alarm.
Nothing significant is changing with the Arctic climate, yet NSIDC finds a way to spin it into a disaster. And to enhance their fantasy, they ignore all pre-1979 data and start their graphs right at the 1979 peak. The graph below is from the 1990 IPCC report, and shows that ice extent was much lower earlier in the 1970’s.
1990 IPCC : Chapter 7



They cannot even settle on a cherry picked average! First they cherry pick 1950-1980, and then in the same paragraph they cherry pick 1981-2010.
That’s settled science for ya!
If the Arctic is crashing how come the number of ships transiting the Northern Sea Route is dropping?
Northern Sea Route transits
2011 41
2012 46
2013 71
2014 53
2015 18
PDFs of shipping for the past 5 years at link.
http://www.arctic-lio.com/nsr_transits
That would be a “cool” Cruise….
Wonder how many submarines lately?
https://youtu.be/HTxo6kN7Wbg
Good thought. That might be part of it.
That dude looks like Ed Asner’s character Carl Fredricksen in the Pixar movie “Up”.
back in 1937 the Husdon bay company used the north west passage, tow ships met from either direction and exchanged goods, it was company policy not to continue using the route.
AGW is crashing and doomed, as are the careers of pseudo-scientists and politicians who vainly tried for the past seventy years (1946-2016) to hide the pulsar core of the Sun from the public.
False pride and blind arrogance keeps them unwilling to accept amnesty and admit they can no longer hide information that is indelibly recorded in exact rest masses of 3,000 atoms that compromise all matter.
False pride and blind arrogance are parts of the human condition that isolate humans from reality, i.e., induce insanity.
I will ask the President of the American Geophysical Union (Margaret Leinen), President of the US National Academy of Sciences (Ralph J. Cicerone) and the Editor of Nature to
1. Publicly receive and publicly respond to precise and undeniable evidence that undercuts AGU and show the Sun is the pulsar remnant of a supernova that made our elements and birthed the solar system: http://crescopublications.org/ pdf/ASSOA/ASSOA-2-005.pdf
2. Refrain from prosecution of scientists who disagree with their AGW dogma.
http://www.breitbart.com/big-government/2016/03/10/us-attorney-general-we-may-prosecute-climate-change-deniers/
http://crescopublications.org/pdf/ASSOA/ASSOA-2-005.pdf
Could you shut up? I apologize the inconvenience, but I’m probably not the only one who doesn’t f***ing care about your pulsar core or rest mass.
Roy Spencer has just shut comments on his blog because of Doug Cotton taking over the blog under numerous changing sock-puppets.
I hope SG/TH has something in place to block him when he tries to find somewhere else to sprout his crap. Oliver is a tiny version of Doug Cotton.
Where’s the “Like” button when you need it?
I suppose we should be thankful that OM doesn’t use sock puppets & multiple IPs to post from, so those who want to ban him can.
and it’s making it thicker at the pole….
If the wind was blowing the other way….they would just be claiming it’s thinner
https://youtu.be/vWwgrjjIMXA
I once (1978) took a piss while snow-shoeing on a Colorado Rockies Glacier in January. Temperature DOWN at the nearby Ski Resort was -27 deg F.. (-33 C?) that day. Pee was solid yellow ice, before it hit the ground. I am pretty sure 5 degrees warming would not have had ANY measurable effect, either on the yellow ice, or the shrinkage! Is there any such thing as common sense any more???
I spent a lot of time in bad weather in the mountains but I never ran a full battery of such experiments. How did you estimate your shrinkage?
Heh. “Shrinkage”. 🙂
Actually, the US Navy forecasted an ice free Arctic by September 2016. The military is hardly clairvoyant, but they (and other military forces) are responding in a fashion that is taking that forecast rather seriously.
Who, exactly? Source?
It is likely their job depends on being PC and not a climate change denier.
If you start the Arctic sea ice charts in 1974, 1954 or 1934, the drop since 1979 would be put in proper perspective and would not look nearly as frightening. One of the great cherry picks of all time!
Have you got a graph from 1974 Andy DC? I think Steve showed one previously but cannot recall the link.
If they were cherry picking why not pick 2000 AD ?
http://arctic.atmos.uiuc.edu/cryosphere/IMAGES/seaice.anomaly.arctic.png
Andy
They wish it to be so. So. It is so.
These alarmists are worse then petulant children.
“Arctic ice extent is essentially at the 30 year mean, except for the Barents Sea – where winds have been pushing the ice edge towards the pole.”
Any data to back up this claim? From the pattern in that area it seems more associated with melting from the North Atlantic Drift in conjunction with warmer temps.
Andy
PS I see everyone is no longer quoting the DMI ice extent graph now … cough. 😉
“I see everyone is no longer quoting the DMI ice extent graph now”
The scammers and liars managed to put so much pressure on , that it was removed.
And please remember that the Arctic was ICE FREE fro most of the first 3/4 of the Holocene.
The tiny period out of the COLDEST period of the last 10,000 years is meaningless and irrelevant.. Just like you.
“And please remember that the Arctic was ICE FREE fro most of the first 3/4 of the Holocene.”
Yeah, but that was safe natural global warming (sngw), complete different animal than cagw.
Sorry Andy, but SST are not the reason as they are actually cool in the region. Try this,
http://r.duckduckgo.com/l/?kh=-1&uddg=http%3A%2F%2Fwww.surfline.com%2Fsurfdata%2Fchart_viewer%2F%3Fchart%3Dglobalwind%26id%3D3253%26zone%3D-6
In the next week the wind currents may well change, but they have been strongly consolidating as of late.
Once this El Nino subsides, the Arctic sea ice should start to increase markedly over the next few years. The alarmist KNOW this, that is the cause of their DESPERATION.
The RECOVERY from the massive extents of the LIA will be over, worse luck.
The people living in the Arctic region are in for a tough several decades, icebound and frozen.
“Hiatus” and Arctic sea-ice “recovery” are both over, and it wasn’t the Sun:
http://psc.apl.uw.edu/wordpress/wp-content/uploads/schweiger/ice_volume/BPIOMASIceVolumeAnomalyCurrentV2.1.png
I see that we might have an ice free arctic in only 2,250 years. But I am old now and can’t wait that long! I wish it were only 2,250 minutes. After all, what is wrong with the present ice age ending and a return to a nice warm earth that nurtured the dinosaurs for so long?
Looks like the arctic sea ice recovery is over
http://psc.apl.uw.edu/wordpress/wp-content/uploads/schweiger/ice_volume/BPIOMASIceVolumeAnomalyCurrentV2.1.png
..massive melting predicted this summer.
ps. the pseudo-hiatus is dead, LOL
I thought we weren’t going to use/quote DMI for anything anymore! just being nasty LOL
Did anyone find an answer to the DMI 15% baseline question that was raised earlier?
The DMI 30% chart with coastal zones masked out was the standard for decades, because the ice detection algorithm was not accurate enough to include coast and presumably not the 15% area as well. And yet when they switched to the new 15% chart they had a long term baseline. If the algorithm was not accurate enough for reporting all those years, how did they get the baseline? Or perhaps a better question is, “how accurate is the baseline?”.
A very good question, Jason
I doubt you will get an answer.. way too inconvenient and too much hard work.
http://psc.apl.uw.edu/wordpress/wp-content/uploads/schweiger/ice_volume/BPIOMASIceVolumeAnomalyCurrentV2.1.png
OT, More modelling based sillimess from EOS
https://eos.org/research-spotlights/how-oceans-could-change-if-we-reverse-anthropogenic-warming
https://eos.org/research-spotlights/how-oceans-could-change-if-we-reverse-anthropogenic-warming
DMI graph for Feb compared to the NSIDC above shows a little different story.
http://ocean.dmi.dk/arctic/plots/icecover/osisaf_nh_iceextent_monthly-02_en.png
And March is ahead of last year. The last decade has seen a stable to increasing extents in all months according to DMI.
http://ocean.dmi.dk/arctic/icecover_30y.uk.php
http://ocean.dmi.dk/arctic/plots/icecover/osisaf_nh_iceextent_monthly-03_en.png
Hello again Steve,
At the risk of repeating myself, if you will keep on regurgitating the same old Porky Pies I suppose I will have to appraise you of the latest data from the Arctic yet again²? Let’s start with CT area shall we?
http://greatwhitecon.info/wp-content/uploads/2016/02/CT-20160308.jpg
As you can see, currently it’s the lowest it’s *ever been for the date:
http://GreatWhiteCon.info/2016/02/the-2016-arctic-winter-sea-ice-puzzle/#comment-213802
Apparently you failed to read the post, or look at the graphic posted…
https://stevengoddard.files.wordpress.com/2016/03/n_daily_extent-4.png?w=640
what part of that graphic do you disagree with?
Apparently you failed to click my link and look at the pretty pictures?
My graph was of quantitative AREA. Your graphic shows qualitative EXTENT. Here’s the accompanying quantitative graph of NSIDC extent:
http://greatwhitecon.info/wp-content/uploads/2016/02/NSIDC-20160308.jpg
As you can see, currently it’s also near as damn it the lowest it’s *ever been for the date. What part of either graph do you disagree with?
How about the part where your graph starts at 1979 and then you say “it’s near as damn it the lowest it’s ever been for the date”. In fact that pretty much an perfect example of my objection to your site and out hyperbolic outlook that of about every other alarmist site when it comes to Arctic ice. It is all a lot of hype about something that is not remarkable at all when one looks at even the last 100 years as it has been show many times here at that blog and elsewhere. Bottom line the current level of Arctic ice is not indicative of substantive long term climate change and you folks are claiming it is and are trying to mislead people.
Wow. One metric that indicates the lowest sea ice in… wait for it… a whopping, 37 years. Zzzzzzzzzzzz…
Jim is a New Earther, who hates human beings, and would rather tilt at windmills than save a starving child. Jim ignores natural cycles, and selfishly wraps himself in a green flag, as innocent humans starve to death.
Bjorn Lomborg, a Nobel Laureate warmist, also says that Jim is wrongheaded. Lomborg explains how we could save millions of lives each year by ignoring the trivial issue of global warming.
https://www.youtube.com/watch?v=Dtbn9zBfJSs
Yet Jim charges on! Advocating for the mass starvation of millions each year. What a POS.
True, but let’s also acknowledge there is nothing new about New Earthers as they stand on the shoulders of progressive giants. They just carry on the central project of all right-thinking people that began long time ago. The vocabulary changes but the exalted end remains. What is a starving child when you are reshaping humanity and creating the New Man?
Creating the New Man: From Enlightenment Ideals to Socialist Realities
And who better to lead the charge than enlightened progressive intelligentsia?
https://www.youtube.com/watch?v=nLqplbwD644
@Jim Hunt
I agree with the sentiments expressed by a few us here, but want to take it a bit further.
There are countless test records showing the so-called 87 year Gleissberg cycle,
for example here,
http://www.nonlin-processes-geophys.net/17/585/2010/npg-17-585-2010.htmlhttp://www.nasa.gov/vision/earth/lookingatearth/nilef-20070319.html
This was picked up by Yousef, I refer specifically to tables II and III
http://virtualacademia.com/pdf/cli267_293.pdf
As you can see, countless records showing a 80-100 year weather cycle.
Going by the most accurate isotope investigations the cycle was pinpointed at between 86-88 year, let us make it 87 years on average. Now 2016-87= 1929. This was also confirmed by myself looking at specific records on maximum temperatures.
look at my latest comment here:
https://stevengoddard.wordpress.com/2016/03/10/noaa-hockey-in-north-dakota/#comment-574873
Now, unfortunately, we do not have any record of ice around 1929. But there was an eyewitness report of the melting of ice around 1923:
http://wattsupwiththat.com/2008/03/16/you-ask-i-provide-november-2nd-1922-arctic-ocean-getting-warm-seals-vanish-and-icebergs-melt/
Noting that antarctic ice is currently increasing, my question to you Jim is simply this: why do you think that arctic melt now is more than 87 years ago?
Best regards,
Henry
sorry, it seems the first link I gave does not work properly
try this
http://www.nonlin-processes-geophys.net/17/585/2010/npg-17-585-2010.html