
NOAA created a fake hottest winter ever through an impressive hockey stick of data tampering, but nowhere more so than North Dakota.
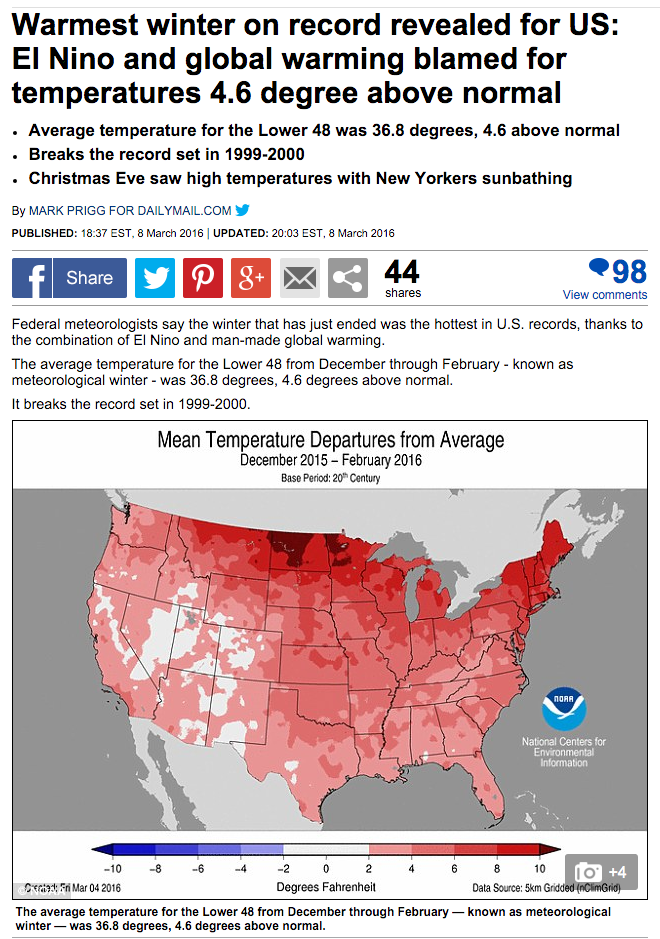
global warming blamed for temperatures 4.6 degree above normal
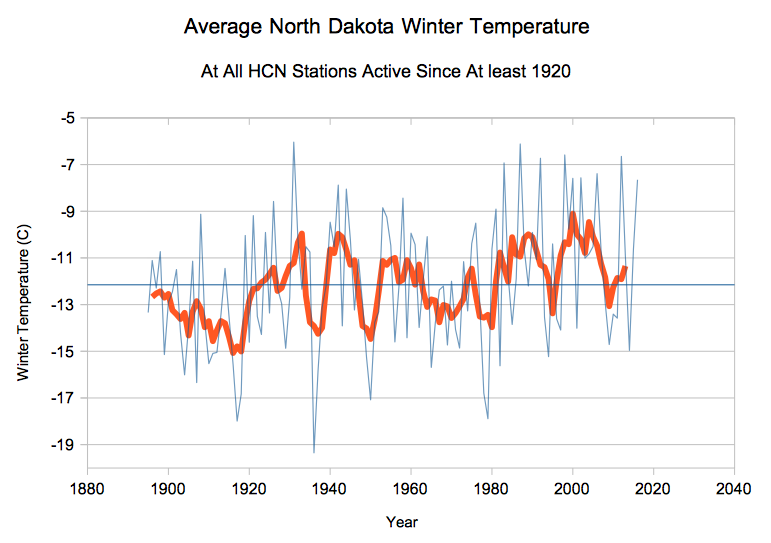
This past winter was tenth warmest in North Dakota, nearly 2C cooler than 1931. Two years ago was one of their coldest winters on record.
NOAA created the hottest winter ever, by adding more than two degrees F on to 2016 temperatures, and subtracting -0.4F from 1931.
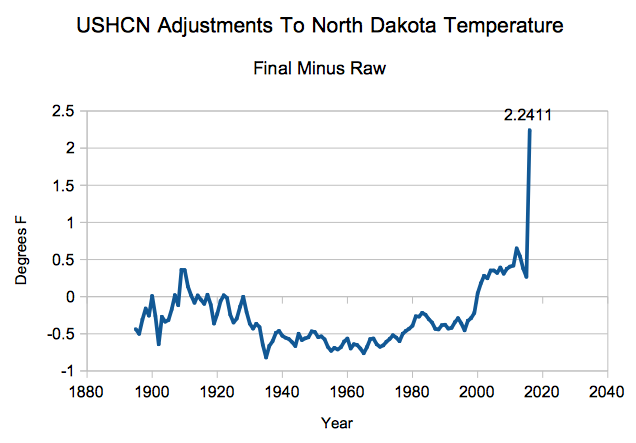
Threatened by funding loss after the next election, NOAA is massively ramping up their hockey game. More updates on this soon.

I put all my faith in Al Gore. I believe we’ll all be dead of sunstroke by next Thursday at 2:35 PM.
OT but Martin Smith’s efforts here to get the DMI 30% ice off the web succeeded. Let us hope DMI ice ect now disappears from the web unless as a junk site LOL
The official NCDC data for ND shows a 30 yr cooling trend for winter (1987-2016)
Tmax -5.5F
Tmin -1.8F
http://www.ncdc.noaa.gov/cag/time-series/us
Because with 2016 now being the end date, 1987 is the start date for a 30 year trend.
But 1985-2014 shows a cooling trend
So does 1986-2015
This is also true for the Upper Midwest, and the Ohio Valley climate region, using the official NCDC data.
Even the Rockies show winter cooling for Tmax, for the thirty year trend.
Strange days.
HEAD SCRATCHER Design…
Hockey stick please don’t demean those magic sports devices…
This is a thorny upside down instrument of…..?
That is a…..
Wow, because I was there looking at the ND winter temps, went ahead and looked at the annual trends.
For North Dakota. This is the official climate NOAA NCDC data.
30 year trend is cooling. The annual mean shows cooling, for a thirty year trend, I was all like, wtf? Seriously?
The Tmax is the main reason, -3.6F
Tmin shows -.01F
1986-2015 trend for the average is -1.9F
Also noticed the 2006-2015 average is 41F, but the previous decade, 1997-2006 is 41.9F, so the last decade was cooler than the previous one.
I know, I know, North Dakota is not the world. But it’s till North Dakota.
And it has been cooling. Using a thirty year trend. Somebody needs to get to adjusting them temps. People will get the wrong idea. Especially with the snow data showing more snow, as the winters cool.
>>> Tmin shows -0.1F
I wish I could edit my posts, after I post, because that’s the moment I finally see the mistake.
After
Damn it, the above should read
Tmin shows -.0.1F
Delete! Delete that!
I’ll ask again. Why bother with measuring temperatures, if you are just going to make the numbers up anyway? Since the science is settled, and we are not going to use the data we collect, just shut down all temperature measuring activities and save us some money. It’s like having an election in North Korea.
You know that untrustworthy lube-and-oil shop down the street? You know how the mechanic pretends to be busy under the car even when he is not actually “replacing your fuel filter”?
Same thing with climatologists.
That evokes some disturbing mental images, Jason …
Let me fix it right away:
https://www.youtube.com/watch?v=tqI4NKLhhvU
Can you imagine what she could do with an Elephant!
Since Ringling Brothers Barnum & Bailey bailed on the big ones….new Elephant Centric Circus!
Politics won’t last for ever but fun will…
I’ve added February to the USCRN/satellite data graph. Nothing unusually warm happening.
http://s19.postimg.org/kqrzeig4z/USA_Feb.png
A quick analysis of UAH USA48 gives the following DJF anomalies (deg C)
1999 … 0.970
2000 … 0.913
2015 … 0.780
1992 … 0.757
2016 … 0.717
Got too get ready for work, will look at USCRN, RSS etc later.
I cannot remember the map now
is Winnipeg near North Dakota?
I did notice that in Winnipeg, rainfall has been dropping at an alarming [average] rate of -2mm/annum since 1982.
Anyone here know why?
Winnipeg near North Dakota? Hmmm… Let me check my map. 🙂
http://xkcd.com/1653/
your map is wrong
It is just a simple adjusted, homogenized and krigged map, now accurate to 0.3 millimeters.
🙂
Winnipeg rain data
http://winnipeg.weatherstats.ca/charts/precipitation-25years.html
I realize 25 years seems like a long time, but it really isn’t. If you look about 200 miles SW of Winnipeg you’ll find Devils Lake. It’s land locked now, but it’s been in a wet cycle since ’93 and has been growing. It’s almost to it’s natural breakout elevation where it’s waters will eventually pass through Winnipeg. Eventually there’ll be another dry cycle (maybe it starts this year?) and it will shrink back down.
https://www.youtube.com/watch?v=R70IyTjETAg
NOAA’s question isn’t, “What’s the temperature?”, it’s, “What do you want it to be?”
The NOAA is either becoming increasingly fraudulent…or your method of subtracting raw temperatures from gridded temperatures without accounting for missing stations is incorrect.
Hey Billy! If you find something substantively wrong, please let us know! As near as I can tell, Tony has a pretty solid case. Remember that he is not subtracting raw from gridded; he is subtracting average raw from average gridded and “adjusted”. The HCN stations were chosen (in part) for their fairly even spatial distribution, so gridding should not (in an honest analysis) make much difference. Likewise, the HCN stations were also chosen (in part) for their high quality site characteristics, so adjustments should not (in an honest analysis) make much difference. Lastly, the HCN stations were chosen (in part) for their long and fairly complete records, so missing stations should not (in an honest analysis) make much difference either. The fact that the official product consistently produces cooling in the past and warming in the present is an absolute red flag. If the “climatologists” were accountants they would be indicted in a heartbeat.
While it was warm here in ND this winter (Bismarck hit 70 in February for the first time), it’s nothing special. It’s an el Nino year. A couple of years ago it was brutally cold. It was nothing special then either. It happens.
@kamas
my investigations show a long term cooling trend, which is more apparent at the higher latitudes.
http://oi60.tinypic.com/2d7ja79.jpg
Because the trend is global, it means [statistically] a smaller chance of precipitation at the higher latitudes and more rainfall at lower latitudes, per solar cycle. Hence, rainfall is down in Winnipeg, by about 100mm per year since 1982.
How to explain the increase of your lake? It puzzled me a bit. My theory is that less clouds and rain mean more sunshine hours during the day and more misty conditions during the night which in turn actually then causes more snow to melt.
That is all I can think of. The climate IS changing.
It is going to get a lot cooler and drier in your area soon.and a return of the “dust bowl drought’ era towards the end of this decade. If I were a big farmer up there I would look for greener pastures southwards.
Henry said
Hence, rainfall is down in Winnipeg, by about 100mm per year since 1982
Henry says
Sorry, this statement can be misunderstood.
I added the last 3 years of the data obtained here,
https://stevengoddard.wordpress.com/2016/03/10/noaa-hockey-in-north-dakota/#comment-574652
to my own original data set on Winnipeg
and obtained a result of -3.2 mm/annum since 1982.
So, in total, that is 100 mm lower now than in 1982….