
Wood for Trees: Interactive Graphs
Contrary to the endless lies of government climate scientists, there has been little or no troposphere warming since 1990. There was also no troposphere warming from the 1950s to 1990 or 2000.
When did this imaginary global warming occur?

Unusual warm in the Arctic area during this winter. Must bee the sun heating up!
Or could it bee the warm water coming from the open sea in the Atlantic and the Pacific during an El Nino Year?
Winter 2015/16 brought a lot of warm wet winds across the Atlantic over Britain up the north Sea over Scandinavia towards the Barents Sea….where the ice melted.
the rest of the Arctic has been as cold as a witches tit.
N pole today is -28°C
& 80N 144W it’s -37°C
see more – http://earth.nullschool.net/#current/wind/surface/level/overlay=temp/orthographic=-1.26,85.20,277/loc=-164.740,89.272
It is in the water-not in the air!
Temperature has been high but still 20 degrees below zero
Se more http://earth.nullschool.net/#current/ocean/surface/currents/orthographic=4.41,79.04,3000/loc=23.393,72.364
Reblogged this on Climatism.
El Niño affects the increase in pressure in the Arctic in January. Polar vortex was strong. In February, occurred a sudden rise in temperature in the stratosphere and winds in the stratosphere weakened.
http://www.cpc.ncep.noaa.gov/products/stratosphere/strat-trop/gif_files/time_pres_HGT_ANOM_JFM_NH_2016.png
http://www.cpc.ncep.noaa.gov/products/stratosphere/strat-trop/gif_files/time_pres_UGRD_MEAN_JFM_NH_2016.png
This correlates with a decrease in solar activity.
http://cosmicrays.oulu.fi/webform/query.cgi?startday=02&startmonth=12&startyear=2015&starttime=00%3A00&endday=31&endmonth=03&endyear=2016&endtime=00%3A00&resolution=Automatic+choice&picture=on
Sunday: Cardinals vs. Pirates
The first pitch of the 2016 MLB season will take place on a chilly and breezy afternoon in Pittsburgh as the Cardinals head to Pennsylvania to take on the Pirates at 1:05 p.m. EDT.
People in the grandstands will want to bundle up as it may be one of the coldest home openers of any team this season due to the shifting polar vortex unleashing cold in the Great Lakes region.
“High temperatures Sunday afternoon will reach the lower 40s F, which is about 15 degrees below average,” AccuWeather Meteorologist Brian Edwards said.
Gusty winds will put an extra chill in the air, making it feel more like winter rather than spring.
“RealFeel® Temperatures will be in the 20s during pre-game tailgates and in the 30s during the game,” Edwards added.
Weather conditions may impact play during the game. Gusty winds can alter the path of fly balls while the cold air impacts the way that pitchers grip baseballs.
http://www.accuweather.com/en/features/trend/mlb_opening_day_forecast_fans/56374389
There was some warming from 1980 through most of the 1990’s, but that was after approximately 40 years of cooling from 1940-1980. So net result was basically flat.
Here’s a hypothesis I trust; it is relied on World War II: in the autumn of 1939, the naval warfare ended within four war months which reversed the two decade warming trend and determined the cooling phenomenon which started with three extreme war winters in Northern Europe and which lasted four decades, until 1980. For me, it is very clear that there’s a strong connection between oceans, the war at sea and climate change, and here are many arguments to sustain this theory: http://1ocean-1climate.com/wp-content/uploads/book.pdf.
Not this crap again.
The latest abuse of science to promote false information was driven by fear of nuclear annihilation in Dear friends,
Below is a pdf file of the message sent to the UN Secretary General, Presidents of the US National Academy of Sciences and the UK’s Royal Society, and Nature’s editor yesterday:
https://dl.dropboxusercontent.com/u/10640850/Ethics_and_Human_Rights_in_the_Scientific_Revolution.pdf
My goal is to remove any and all doubt about the intentions of current holders of high offices and bring the AGW debate to conclusion.
The history of Ancient science has evidence of earlier disconnects in science, long before fear of nuclear annihilation disrupted science again in AUG-OCT 1945:
http://mathisencorollary.blogspot.com/2011/11/copernicus-aristarchus-and-lost.html
The latest abuse of science to promote false information was driven by fear of nuclear annihilation in AUG-OCT 1945.
Here is the truth behind global schwarming:
http://www.investors.com/politics/editorials/another-climate-alarmist-admits-real-motive-behind-warming-scare/
Here’s more proof:
http://www.zombietime.com/climate_movement_drops_mask_admits_communist_agenda/
Ah Zombietime! One of my favorite sites for mocking brainless leftists.
CO2 sucks at keeping me warm this March.
They gave you the wrong gas. Go back and ask for CH4.
The current temperature in the Antarctic.
http://oi63.tinypic.com/b51ij7.jpg
Reblogged this on TheFlippinTruth.
Hey, what if the El Nino itself it caused by underwater volcanic action? I discounted this some time ago – the scales are just off – ocean enormous; volcanoes small and localized. But more volcanoes are being found. And there is a huge finding of underwater volcanic action beneath Antarctica.
https://www.ecomagazine.com/news/science/new-deep-sea-vents-and-volcanic-activity-discovered-in-the-mariana-back-arc
And and interesting take on it here: http://www.climatechangedispatch.com/how-geological-forces-rock-the-earth-s-climate.html
So. If something else, not CO2 is driving El Nino; and what minute Man-Made Global Warming we see vanishes when we correct for El Nino; then CO2, the Man-Made kind, isn’t doing much of anything, if it is doing anything at all.
Exactly, CO2 is not driving the climate, they AGW crowd does know that but it been a good sell after all it has brought in Billions. AGW is just another bottle of snake oil it doing what is intended lining the pockets of the sellers and of course, the side effects of the snake oil is the same it alway does, making people sick and even killing them but the seller doesn’t care after all they are all getting rich, the worst part most of it on the taxpayer’s dime.
I cannot place my hands on the paper right now, but I remember reading a new estimate of undersea volcanoes, and it was somewhere around 3.3 million. I know it’s not an impressive number like the number of ships in WWII, but nonetheless it is significant.
Hey maybe all the prop driven airplanes produced during WW II are responsible for climate change? After all the US produced 324,750 of them during WW II. As for ships The US alone produced 141 Aircraft carriers (the majority smaller types), 8 battleships, 807 cruisers- destroyers- destroyer escorts, 203 submarines, 52 million tons of commercial shipping including 2,710 Liberty Ships along with numerous large tankers. Also over 1,000 LSTs and 1,000s upon 1,000s of smaller vessels. By 1945 the output of the US in all of the above exceeded the output of the rest of the nations in the world combined. But then again it could have been the 88,410 tanks, tank destroyers and self propelled guns or the 257,000 artillery pieces or 2.4 million trucks and 2.6 million machine guns and the 41 billion rounds of ammo to go with all of that.
Hi gator, is it this one ??
https://www.newscientist.com/article/dn12218-thousand-of-new-volcanoes-revealed-beneath-the-waves/
See also –
How many volcanoes are there in the world? Start with this lot –
http://www.volcanodiscovery.com/volcanoes/faq/how_many_volcanoes.html
Alphabetical list of volcanoes – http://www.volcanodiscovery.com/volcanoes/alphabetical-list/a-z.html
Illustrated Volcano Glossary – http://www.volcanodiscovery.com/photoglossary.html
What’s Erupting today – http://www.volcanodiscovery.com/volcanoes/today.html
Yes, thanks, your first link is the reference I mentioned.
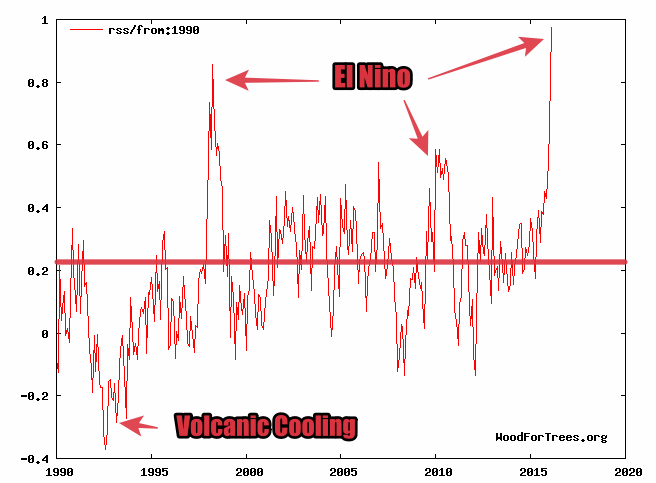
The graph shows that without the El Ninos, there would be absolutely nothing to talk about. We have to be grateful to El Ninos.
is that chart from 1990 adjusted satelite data or raw data? any explanation of all that as it seems like ihave seen conflicting satelite data..
“i have seen conflicting satellite data..”
Show us where..
i saved this chart off this site from one of his previous blog.posts.
http://mini-ice-age-observer.simplesite.com/426751619
what is that down-trending line exactly? it appears to be similar to the official chart that i often see “no warming for 19 years..” and the one that says ‘no warming’ appears to show a net change of exactly or almost exactly 0.00 ??
Ok, this comes from “woodfortrees” and the actual graph you have is from 2001 to 2015.2 with a couple of other settings and a linear trend added
http://woodfortrees.org/plot/rss/from:2001/mean:12/to:2015.2/plot/rss/from:2001/to:2015.2/trend.
SG’s graph is 1990 to now, the peak of the current El Nino.
The real issue with strict linear trends is that they don’t take into account any short term events like El Ninos, volcanic cooling events etc. and are a purely mathematic (non-thinking) straight line dependant heavily on the end points used.
The current El Nino has a large impact on short term trend calculations, just like the 1998 one did. This is used by AGWers to attempt to show CO2 based warming where there really isn’t any. (El Ninos are a solar/cloud forced warming)
Hope that helps a bit.
Where did that trend line come from? Here is the WFT linear regression line:
http://woodfortrees.org/plot/rss/from:1990/to:2016.1/plot/rss/from:1990/to:2016.1/trend
Trend: 0.119 ±0.109 °C/decade
An update:
http://woodfortrees.org/plot/rss/from:1990/plot/rss/from:1990/trend
Trend: 0.136 ±0.108 °C/decade
Plus data and trend from 1979. (Difficult to distinguish the trend lines. They are almost identical.)
http://woodfortrees.org/plot/rss/from/plot/rss/from:1990/trend/plot/rss/trend
Trend: 0.135 ±0.062 °C/decade