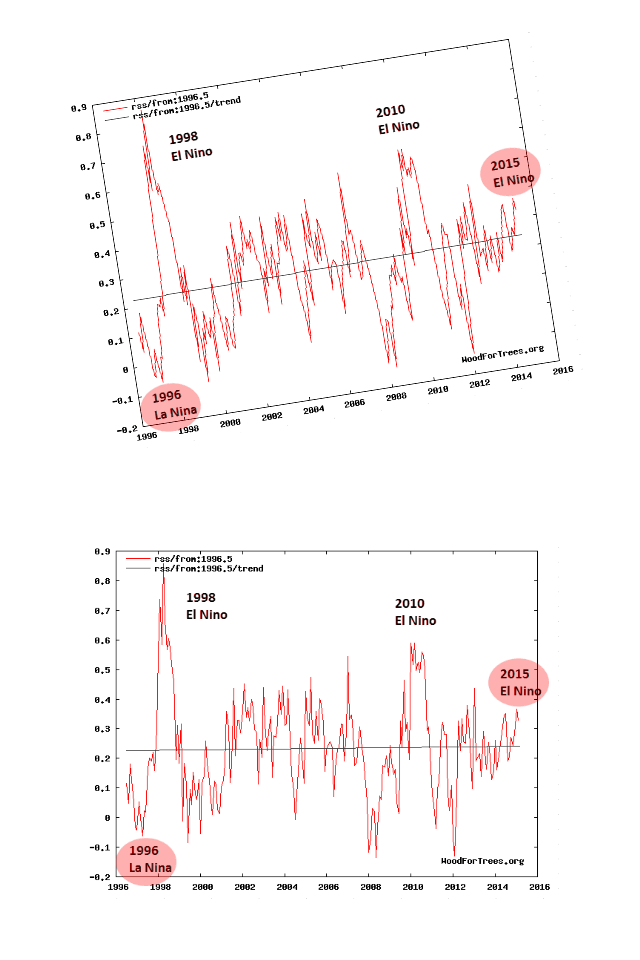
I don’t make climate forecasts. I do make forecasts of future climate fraud. Here is one from this month last year, where I predicted the tampering which has just occurred at RSS. March 27, 2015
—————————————————————————————-
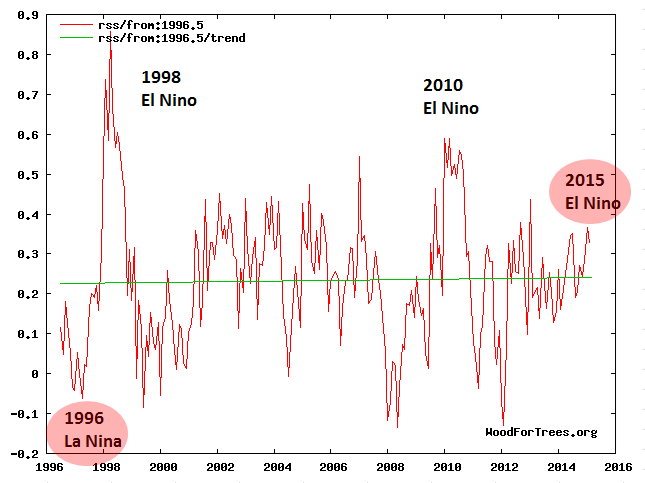
One of the biggest scams alarmists are trying to pull is the claim that the surface data sets are independent, and they all show the same thing. Carl Mears used that as an excuse to ignore his own satellite data – which shows no warming for 19 years.
There is nothing independent about the data sets. GISS uses the same adjusted GHCN data as NCDC. But it is worse than it seems.
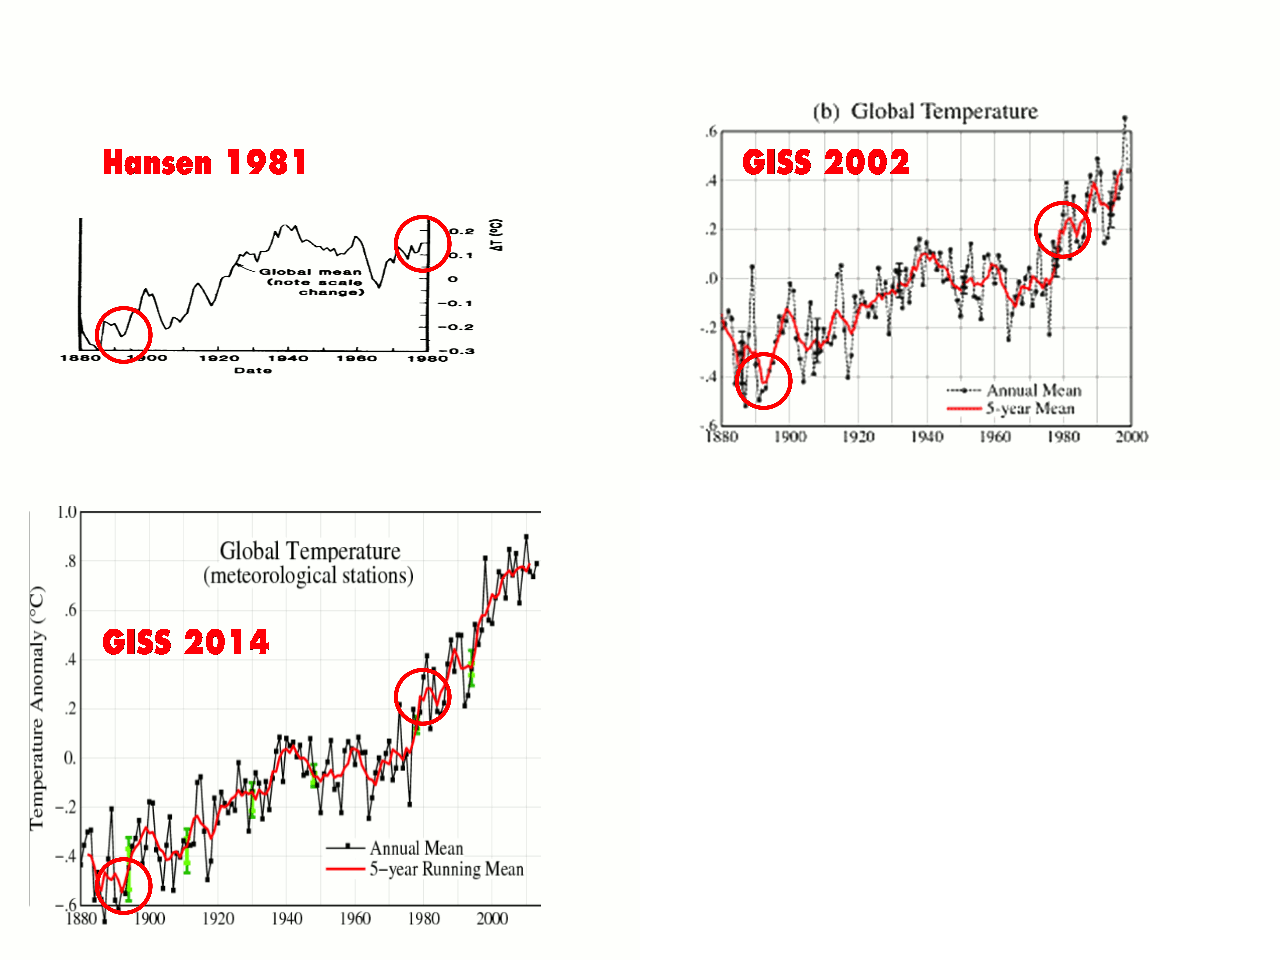
HadCrut didn’t used to agree with GISS, and they were upset about it – so they changed HadCrut to make it match GHCN.
The data sets have been carefully and repeatedly tampered with to bring them to their current fully fraudulent state.
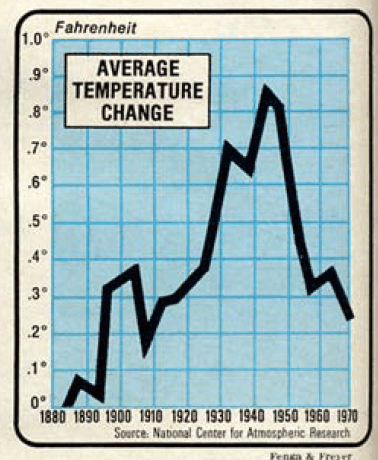
1974
They have almost completely eliminated the 1940 to 1970 cooling.
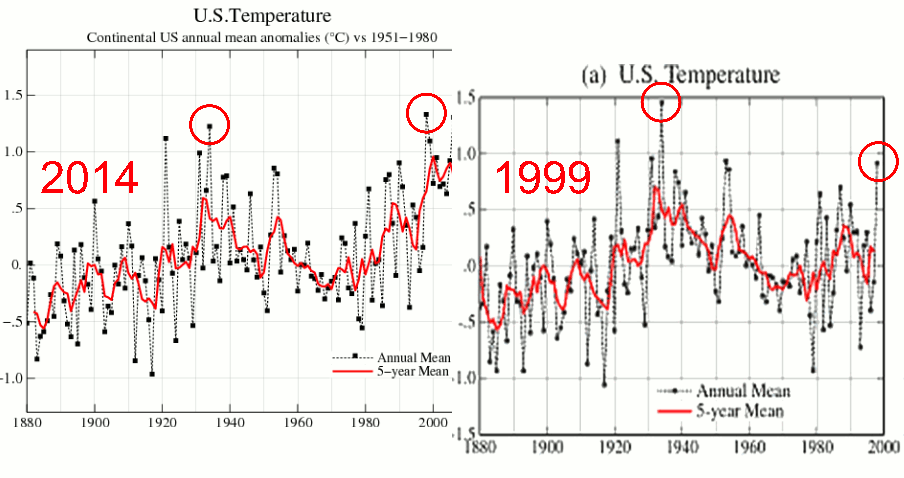
But it is worse than it seems. In 1999, Hansen lamented that the US data set didn’t show any warming. So he and NCDC got together and changed the US data set.
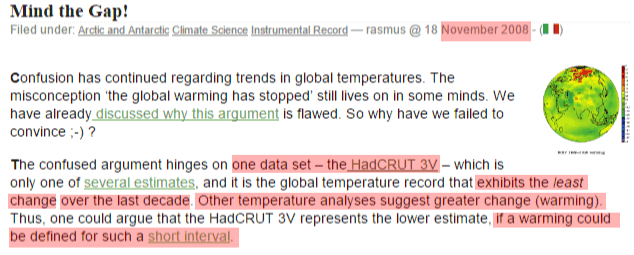
And in 2008, Real Climate said that the HadCrut decadal pause was too short. RSS is up to 19 years, so they simply ignore it.
Enron accountants would blush at these tactics.
Look for the satellite data to be adjusted to bring it into compliance with the fully fraudulent surface temperatures. The Guardian is now working to discredit UAH, so it seems likely that RSS will soon be making big changes – to match the needs of the climate mafia. Bookmark this post.


Keep up the good work. 🙂
He’s cracked the code
https://www.youtube.com/watch?v=w-0TEJMJOhk&feature=youtu.be&t=75
HA! That guy’s still around?
November/December of 1980, Phase I of the Special Forces Qualification course at a wired in compound at Camp Mackall, NC in the back woods at Ft. Bragg. When they let us lay down for a few hours rest in the unheated tar paper shacks in our sleeping bags on wooden platforms they would pipe ‘Another One Rides the Bus’ over the PA system. The whole song played once for each wannabe that quit or failed that day. 202 went in and I was one of the 98 that graduated so I heard the song a whole bunch of times. It was pretty effective psyops for raising the stress level and helping with sleep depravation.
🙂
Enron accounting:
my.telegraph.co.uk/reasonmclucus/reasonmclucus/15835722/enrons-global-warming-scam-survived-its-bankruptcy/
www. ?
http://www.quidsapio.wordpress.com/2012/06/06/how-goldman-sachs-invented-cap-and-trade/
“The data sets have been carefully and repeatedly tampered with to bring them to their current fully fraudulent state.”
Not so fast. We need to wait for a fraud hiatus of at least fifteen years before declaring them fully fraudulent.
This is the only way to have a fraud hiatus…
http://www.dinamina.lk/sites/default/files/news/2015/11/30/lady.jpg
I think 15 years is not enough, Doug.
Didn’t Phil Jones say that longer periods are much better and that their temperature record fraud should last at least 20-30 years to be statistically significant?
According to the NOAA State of the Climate 2008 report, climate computer model simulations show that if observations find that the globe has not warmed for periods of 15 years or more, the climate models predicting man-made warming from CO2 will be falsified at a confidence level of 95%:
“Near-zero and even negative trends are common for intervals of a decade or less in the simulations, due to the model’s internal climate variability. The simulations rule out (at the 95% level) zero trends for intervals of 15 yr or more, suggesting that an observed absence of warming of this duration is needed to create a discrepancy with the expected present-day warming rate.”
http://www1.ncdc.noaa.gov/pub/data/cmb/bams-sotc/climate-assessment-2008-lo-rez.pdf
Page 24, Middle column
According to Phil Jones, there has been no statistically significant warming since 1995 [16 years, 3 months ago]. Ergo, the climate models have already been falsified at the 95% confidence level and it’s time to revert to the null hypothesis that man made CO2 is not causing global warming.
He further admitted that in the last 15 years there had been no ‘statistically significant’ warming, although he argued this was a blip rather than the long-term trend.
http://www.dailymail.co.uk/news/article-1250872/Climategate-U-turn-Astonishment-scientist-centre-global-warming-email-row-admits-data-organised.html
We are now past 18 years and counting.
Yes, I know about Phil’s 2010 BBC interview that gave The Team and their supporters constipation and hemorrhoids. I was referring to his 2011 damage control:
They need more time. Synchronizing all the data adjustments among the team players is a hard job. Nature doesn’t behave as predicted and saboteurs like Goddard keep destroying the work. Everything would go much smoother if Shukla, Trenberth and the other RICO 20 signers succeeded in jailing the wreckers.
And even the glaciers are part of “The Great Conspiracy”.
Look at the deceit that has been involved in going from this:
http://www.durangobill.com/SwindlePics/SwindleGlBay1941.jpg
to this:
http://www.durangobill.com/SwindlePics/SwindleGlBay2004.jpg
Must have taken hours of Photoshop time.
Even the famous Matterhorn is part of “The Great Conspiracy”.
http://www.durangobill.com/SwindlePics/SwindleFurggGlacier.jpg
Claims about rising sea level are also part of “The Great Conspiracy”.
Look at what happens when somebody left their hose on and then “The Great Conspiracy” attributed it to Global Warming.
“Miami Beach Sea Level Rise, Paradise Lost!”
http://www.youtube.com/watch?v=H4UueAile5A
P.S. Here’s a hint. The real world is not interested in Global Warming Deniers’ fabricated conspiracies and/or their paranoia.
So glaciers never melted before 1979? And oceans started rising with industrailization?
Fascinating! 😆
Here is a hint for you, Bill. The real world is not interested in your arm waving and bloviating. Watchers will assume from your “contribution” that you have nothing to say about these strange record adjustments but Tony’s post gave you a real butt hurt so you chose to obfuscate.
Hey Bill Butler! “P.S. Here’s a hint. The real world is not interested in Global Warming Deniers’ fabricated conspiracies and/or their paranoia.”
Here’s another hint. The world is doing exactly the same things it has always done. Glaciers mostly melt during interglacials. Icy mountains have less ice during the summer. Cities built next to the ocean experience higher water during high tides and storms. Sceptics will admit that the world has changed only when there is evidence that the world has changed.
in the meantime, how do you explain the monotonic increasing changes to the actual measurements of temperature? Do you think that the alterations of data are acceptable? Why or why not, is it OK to change the scientific evidence?
Glacier Bay retreated 50 miles from 1760 to 1860. You are a total fraud Bill. You should be ashamed of yourself pushing these sorts of lies.
http://soundwaves.usgs.gov/2001/07/glacierbaymap.gif
Pity there aren’t any pictures from the first 3/4 of the Holocene…
Only the tail end of the warming from the LIA, the COLDEST period in the last 10,000 years.
How do we know that any of the “changes” you are showing are outside the range of natural variability?
Which of those pictures of Glacier Bay looks more hospitable for life?
Here’s a hint for you, Billy boy, in actuality the real world is not interested in the continuous streams of mendacious, scientifically claptrap pouring out of you bedwetters any more..
Out in the real world, we’ve seen ‘Peak Oil’, now we’re seeing ‘Peak CAGW’, and the CAGW hoax is losing credibility fast.
This from the BBC just before the COP21 mega-pissup with a carbon footprint in excess of many a third world state, for example:
Public support for a strong global deal on climate change has declined, according to a poll carried out in 20 countries.
Only four now have majorities in favour of their governments setting ambitious targets at a global conference in Paris.
In a similar poll before the Copenhagen meeting in 2009, eight countries had majorities favouring tough action.
The poll has been provided to the BBC by research group GlobeScan.
Just under half of all those surveyed viewed climate change as a “very serious” problem this year, compared with 63% in 2009.
The findings will make sober reading for global political leaders, who will gather in Paris next week for the start of the United Nations climate conference, known as COP21.
http://www.bbc.co.uk/news/science-environment-34900474
The 2015 United Nations ‘My World’ global survey of causes for concern currently covering 9,721,093 respondents shows ‘action on climate change’ flat last, 16th of 16 categories.
http://data.myworld2015.org/
Crying “WOLF!” can only work for so long, and as not a single one of the catastrophic predictions of the Warmist religion over the last 3 decades has actually happened – in fact in the majority of cases such as hurricane landfall frequency and polar ice disappearance they have been diametrically wrong – their credibility is rapidly approaching zero.
Of course, most people realise that there are plenty of really clear and present dangers in the World without worrying about a superannuated scare story that hasn’t managed to get a single one of its apocalyptic predictions right since the 1980s and has now degenerated into crackpot prognostications of doom and gloom not just tens, not just hundreds but thousands of years in the future.
The real problem is that these scammers and the credulous bedwetters that unquestioningly support them are destroying the credibility of real science – and not just in the field of climate either, and just as in the fable, when a real wolf does come – and it will, sooner or later, nobody will believe them.
You lot are the deniers now, sunshine.
Live with it.
Even without the adjustment your “19 year hiatus” has evaporated. The RSS TLT for February 2016 is 0.97 degrees C, exceeding the warmest month of 1998 by 0.11 degrees. There is no date to start from that will give a negative trend.
Up until 2005 RSS satellite temperatures were always slightly warmer than UAH data. After 2007 the temperatures are almost the same. That suggests errors in one of the two data sets.
http://dailycaller.com/wp-content/uploads/2015/01/RSSUAHdata.png
There was a much larger correction made to UAH data in 1998. The period of 1979 to 1995 went from showing -0.05C per decade cooling to +0.13C per decade warming. I doubt you would accuse Roy Spencer of manipulating UAH data support global warming.
They cannot even be referred to as “data bases”, these days. They are more like fairy tales constructed out of old wives’ tales.
Once data has been adjusted, it is no longer data, it is an artifact of analysis.
The grantologists point to artifacts, and claim it is ‘data’.
da·ta ?dad?,?d?d?/ noun
1- facts and statistics collected together for reference or analysis.
ar·ti·fact ?ärd?fakt/ noun
1- an object made by a human being…
So how can there be any satellite “data”? UAH data is as adjusted as RSS and more so than any thermometer based data. If Roy Spencer only published monthly averages of microwave radiation hitting satellites from below it wouldn’t be useful to many scientists.
Once adjusted, dat is an artifact. Period. What part of this do you not understand?
Satellites measure microwaves in the 23.8, 31.4 and 89 GHz range and send that data to Earth. How that data becomes temperature values was described in a 1963 paper. “The relationship between the emission spectrum and the temperature as a function of height demonstrates that the emission at a given frequency represents the average temperature in a layer of air roughly 10 km deep.”
http://onlinelibrary.wiley.com/doi/10.1029/JZ068i006p01683/abstract
In 1998 the UAH made a massive adjustment when it was shown orbital decay was giving the temperature data an artificial downward trend. When the corrections were made the data went from showing a cooling of -0.05K per decade to a warming of +0.07K per decade.
Would you prefer to only see the raw data of microwave measurements? Anything else seems to be an artifact to you.
Would you prefer to only see the raw data…
(Sigh) There is no “raw” data, there is only “data”.
And yes, I would like to see the data, as well as the adjustments, and error bars. Or is that too much to ask? Sheep much?
Here’s your data from each channel of each satellite on each day. Let us know what you find.
ftp://disc1.sci.gsfc.nasa.gov/data/s4pa/msu/MSULST_HDF/doc/README.lim93.pdf
I find you obtuse.
gator69: “I find you obtuse.”
I suppose that’s one way of putting it.
Reblogged this on Climatism and commented:
If you don’t like the data, adjust it!
And that’s exactly what RSS’ Carl Mears has done – bringing out a new version, that measures Mid Troposphere temperatures, TMT, and not the TLT (lower troposphere) which inconveniently shows no warming for 19 years.
Their explanation paper for new TMT dataset says it like this:
The new dataset shows substantially increased global-scale warming relative to the previous version of the dataset, particularly after 1998.
Global warming is the biggest pseudoscientific fraud in history.
Einstein knew about it years ago : “If the facts don’t fit the theory, change the facts” in this case, the dataset.
How is TLT derived?
Lower troposphere 0-10km. The area where global warming theory is (was) supposed to be measured.
Are you saying that RSS used to measure the TLT and now measures the TMT? RSS and UAH have measured both the TMT and TLT since 1979. RSS has not updated the TLT data set to version 4.
Starting with February 2016 and going back 19 years gives a warming of 0.02C per decade. This is the old unadjusted version 3.3 data. We’ll see how much that goes up between now and April. April 1998 was the warmest month in the data set (0.87C) before last month’s 0.97C.
Don’t forget that from April 1997 to April 1998 the TLT temperature went up 0.92 degrees. That massive spike of the 1998 El Nino makes comparisons complicated until this El Nino has run it’s course.