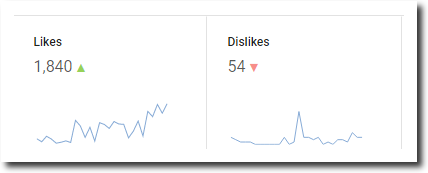
Ninety seven percent of YouTube experts like my climate videos.
https://www.youtube.com/c/TonyHeller
My videos are being watched about once every fifteen seconds now. Word about the global warming scam is getting out, particularly to the key decision makers controlling funding.
Excellent! Keep it up!
Great Work ! And Fantastic News !
Don’t Stop, and Keep Safe !
This is exactly why the left wants to control the internet.
Hey Tony! I was slumming over at WUWT, and saw this…
Steven Mosher July 7, 2017 at 4:05 pm
Heller is wrong and misleading in every single chart he produces.
Further he never produces work that can be reproduced.
He FAILS the Mcintyre test.
as does you work.
https://wattsupwiththat.com/2017/07/07/comments-on-the-new-rss-lower-tropospheric-temperature-dataset/
And Stevie has a PhD in English literature. I wonder what his expertise could be? We may never know…
His PhD in English literature certainly hasn’t helped him with his spelling and grammar.
My mistake, he left the PhD program, and only has a BA.
To be fair, English grammar and spelling are difficult, and Mosher is busy saving the planet from a climate catastrophe.
Only the brainwashed Climate Jugend and the New World Order Brown shirts still are behind the scam. Maybe time to teach science at school again. Only a well educated People can make America great again. Big government has never been the solution.
Yes, 97% of people would rather hear truth than lies!
;-)
A YouTube view every 15 seconds? That’s quite a lot for this type of video! Usually a scientific, educational video with a narrow target audience receives about 200-300 hits at best, so that’s fantastic!
Get ready to be sued for defamation/slander, violating some little known interstate e-commerce law, or otherwise intimidated in your personal affairs, because you’re hitting people in the wallet
This is good news. I’m adding links to Tony’s videos on my Portuguese-language blog. One of the IPCC reports is already circulating in Brazilian Portuguese. That AR5 WG1 report does not contain a single graph of actual temperatures measured in degrees. But it does superimpose a thermometer image on artificial “trend” data rising sharply by less than an imaginary degree. http://www.faloingles.com