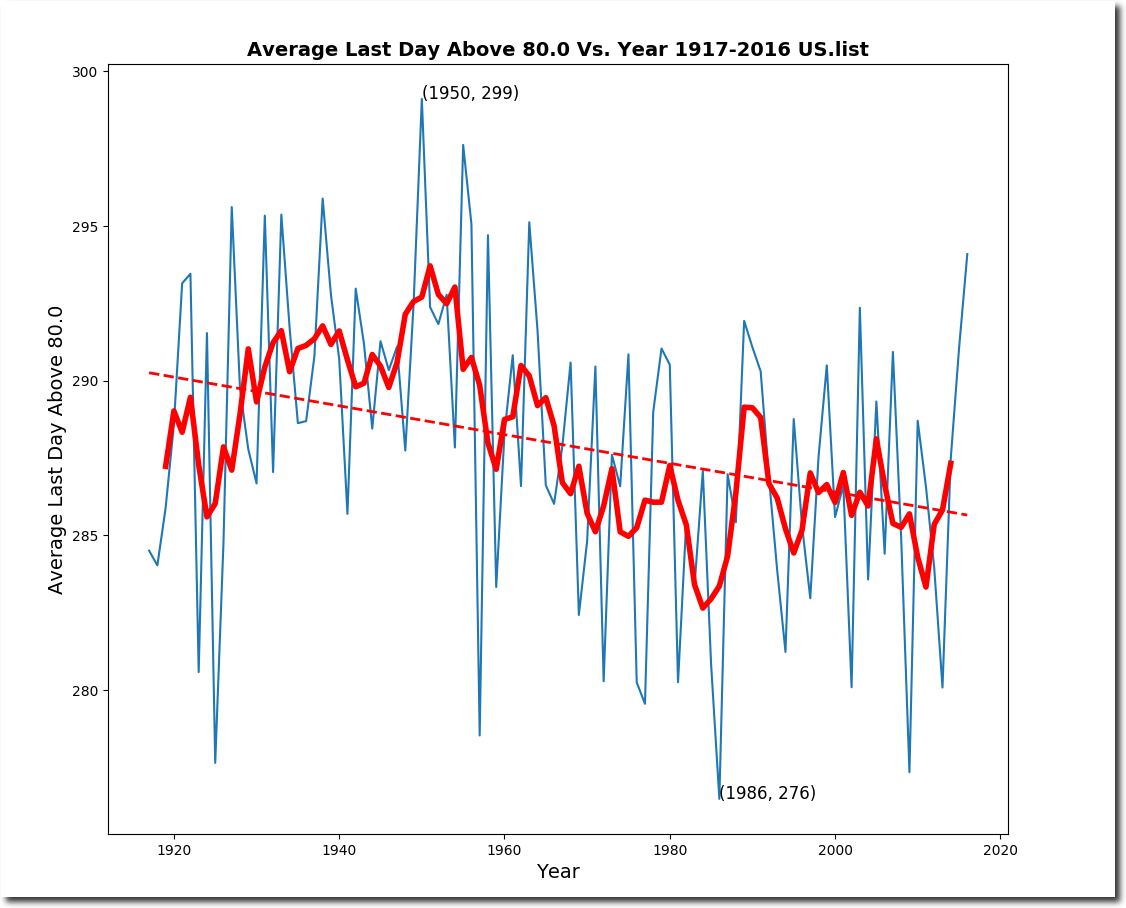
Autumn arrives several days earlier in the US than it did a century ago.
This shouldn’t surprise anyone, because autumn snow cover is increasing and is at record highs – indicating that Arctic air is intruding further and further south.
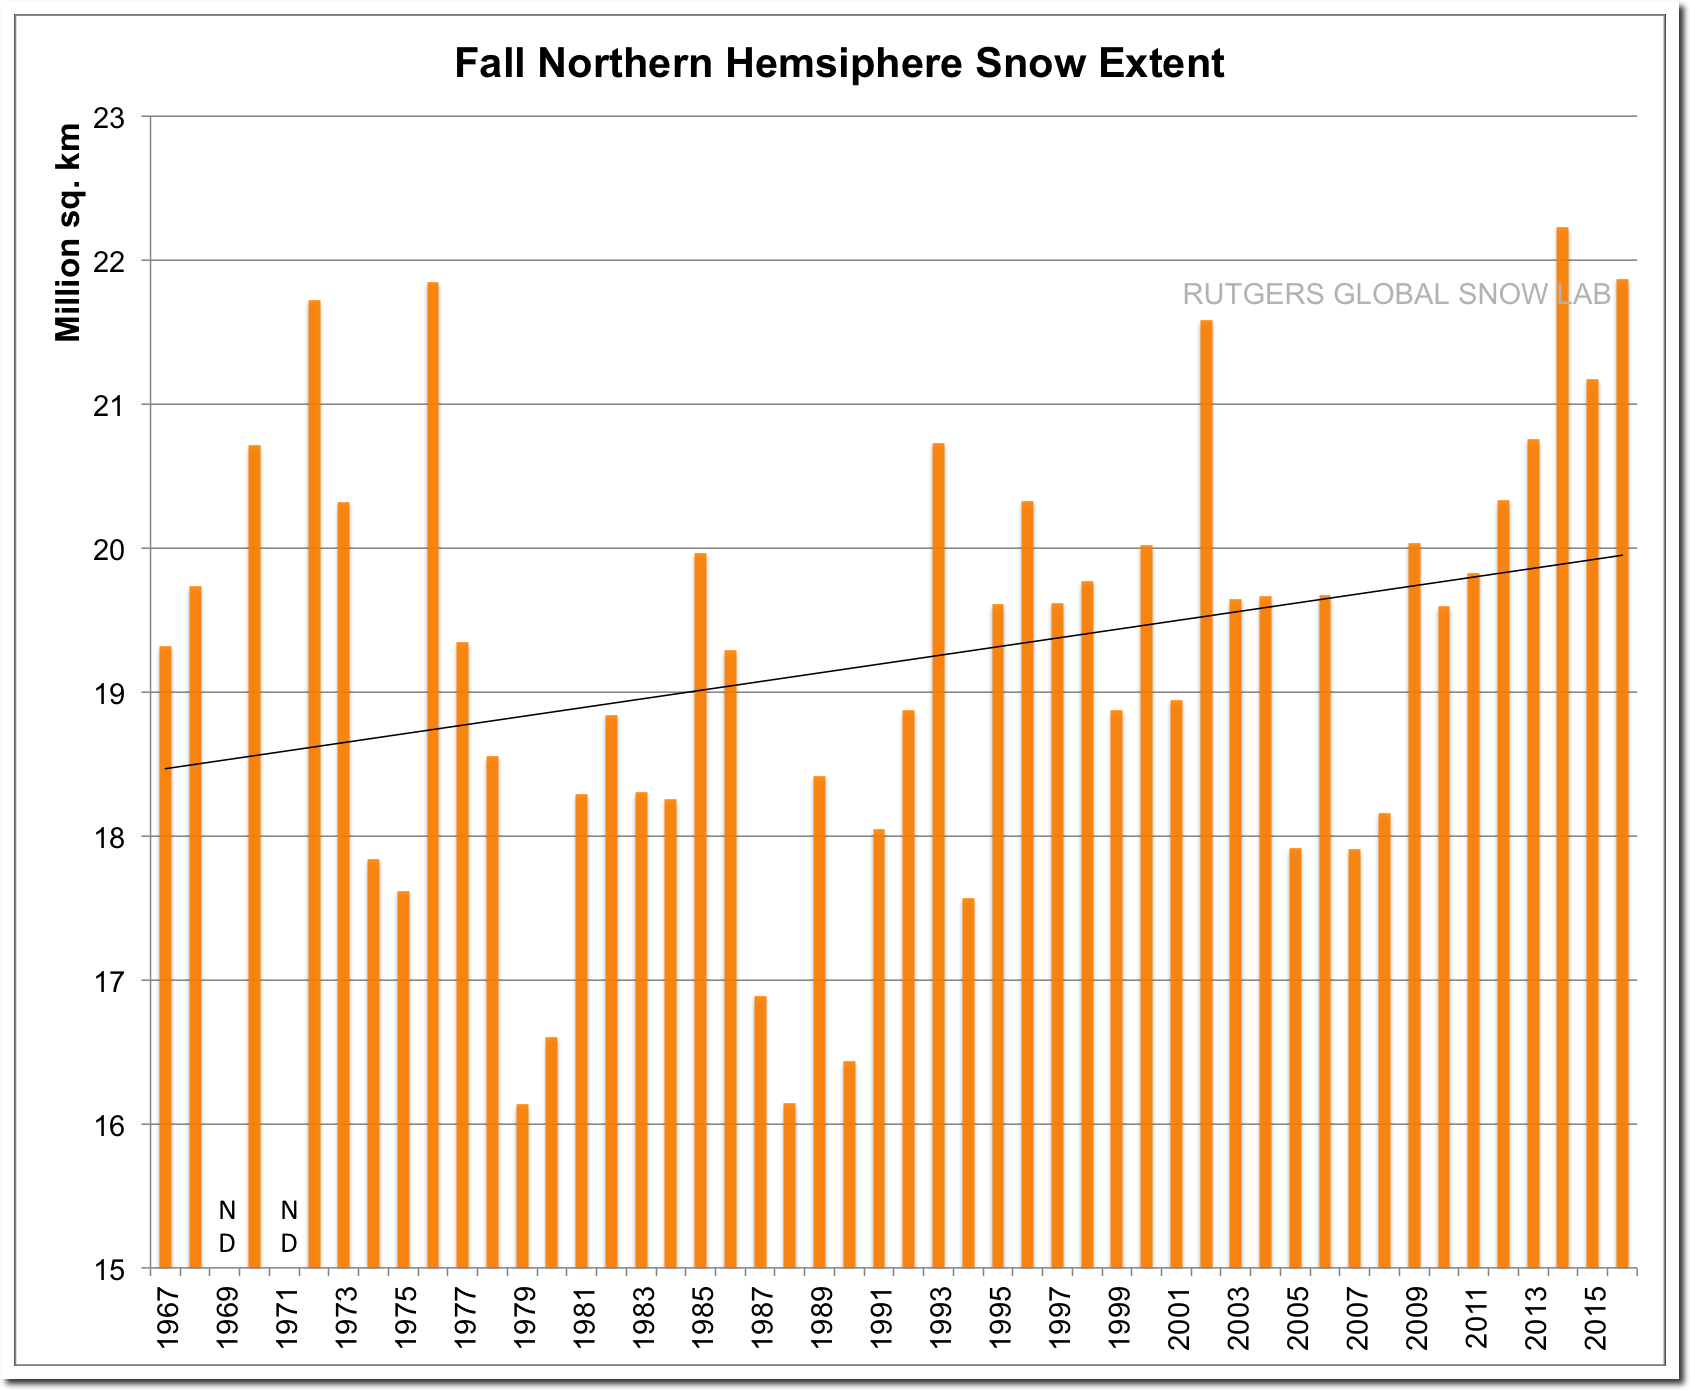
Rutgers University Climate Lab :: Global Snow Lab
Heidi Cullen’s gang of fraudsters claim the exact opposite, because their job is to spread propaganda – not inform the public.
So how long before we see an ice cap beginning to form on the Canadian main land?
500-1,000 years.
Canadian mountain glaciers along with a farly new Greenland glacier,have showed up in the last 2000 years,that were not there the previous 8,000 years.
A big to do was made about last Sunday’s football game in Green Bay being the hottest game in Green Bay history. It was an unusually warm day by Green Bay standards for late September, 90 degrees. Only thing was that 90 degrees was not even the high temperature record for that date. That record still stands at 92, set back in 1891, long before Green Bay had a football team.
“Nick Stokes
September 26, 2017 at 3:53 pm Edit
Steven Goddard produces these plots, and they seem to circulate endlessly, with no attempt at fact-checking, or even sourcing. I try, but it’s wearing. The first GISS plot is not the usual land/ocean data; it’s a little used Met Stations only, essentially an update of a 1987 paper. I don’t know if it’s right. But the second shows what is claimed to be a NCAR plot, or at least based on NCAR data. That plot isn’t from any NCAR publication, and the data is not available anywhere. Instead it is from the famous Newsweek 1975 article on “global cooling”. And that just said it was a temperature plot; didn’t even say what it was temperature of. From the context, it seemed to be US, which figures. There was very little digidised global data in 1974.”
Nick Stokes, says this chart is NOT from NCAR but from the Metoffice:
https://realclimatescience.com/wp-content/uploads/2016/01/CTdUc4vWEAAxgDt-1.png
It says NCAR at the bottom. Tried to find Fenga & Freyer that is below the charts.
Hmmmm.
Can you help us Tony?
Here are the links to his several complains about your charts:
https://wattsupwiththat.com/2017/09/26/gavins-twitter-trick/comment-page-1/#comment-2621310
https://wattsupwiththat.com/2017/09/26/gavins-twitter-trick/comment-page-1/#comment-2621347
https://realclimatescience.com/2017/09/nick-stokes-busted/
Nick has no clue what he is talking about. Just like Zeke and the rest of his friends.
Thank you,Tony.
https://imgur.com/a/Jz0Vv
Texas permanent drought now causing flooding. This is serious. We need to act now.
http://bit.ly/2xG8Lrd