The coldest year on record in the Eastern Arctic was 1979. Since then, there has been a small decline in the area of the Arctic covered by sea ice.
Charctic Interactive Sea Ice Graph | Arctic Sea Ice News and Analysis
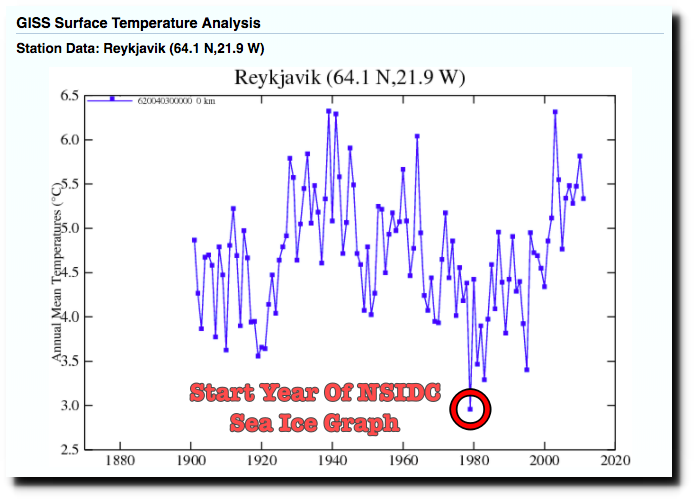
Data.GISS: GISS Surface Temperature Analysis
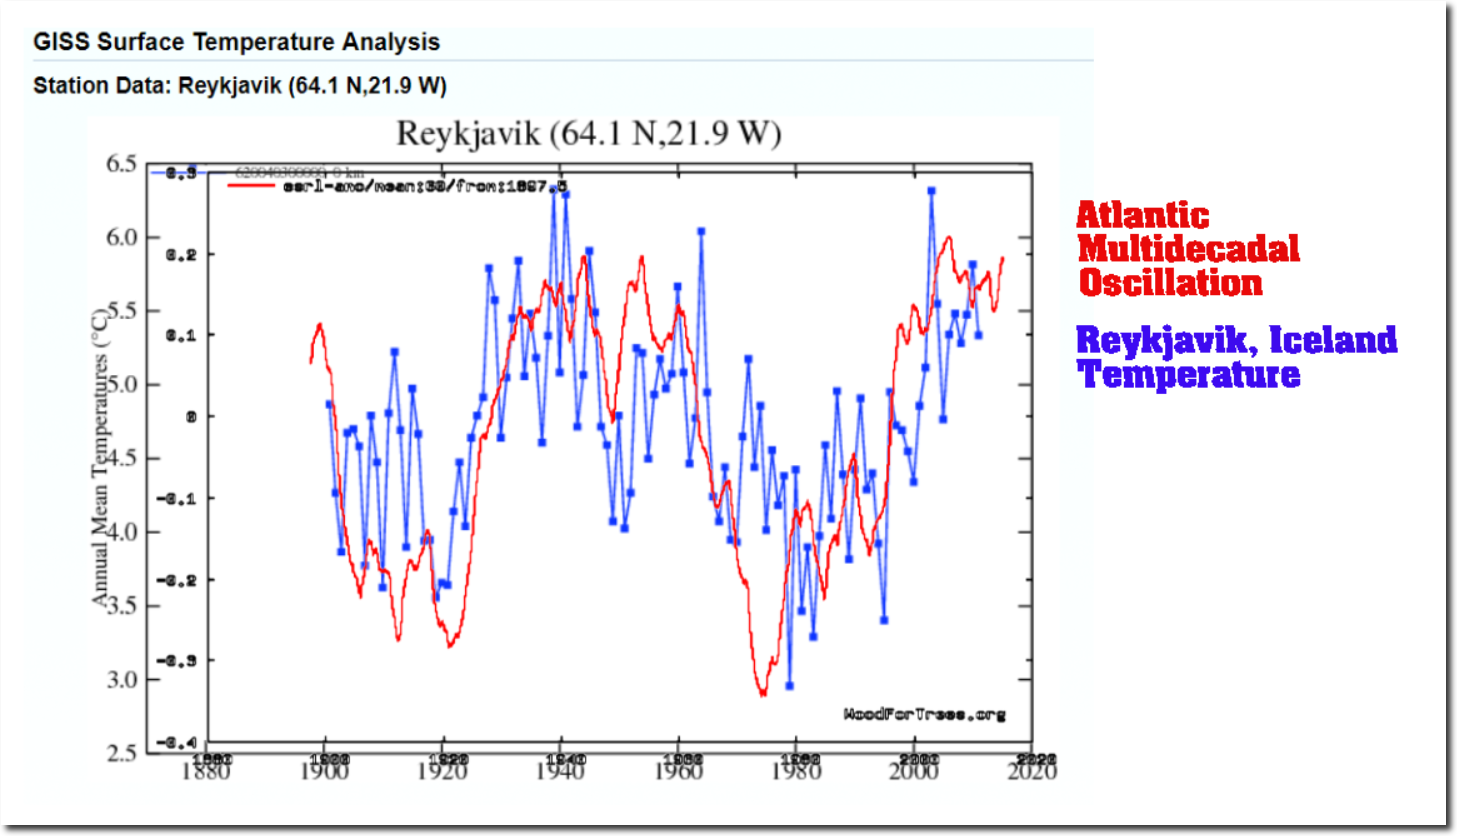
Arctic sea ice and temperature tracks the Atlantic Multidecadal Oscillation (AMO) which has a 70 year cycle and is currently at a peak. It is quite likely that Arctic sea ice extent will increase over the few decades, as the AMO starts downwards.
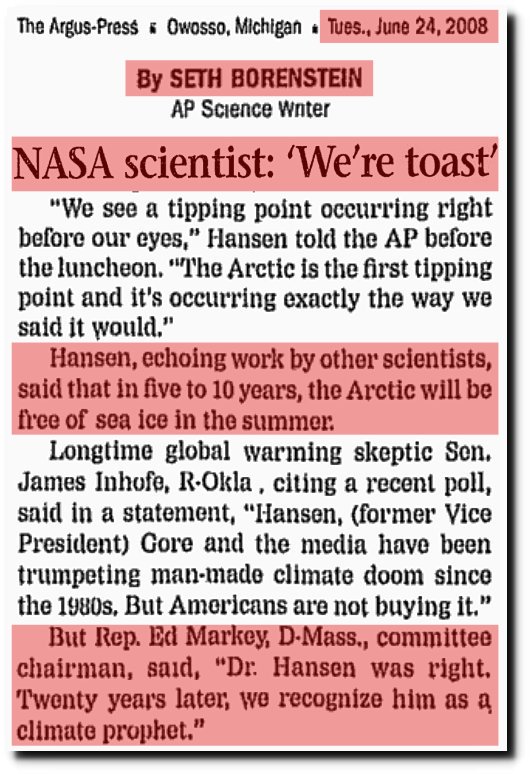
Climate experts forecast that the Arctic will be come ice-free in the future, because they aren’t actual scientists.
It’s incredible that ‘scientists’ ignore such a clear correlation between ice extent and an observable, measurable AMO and instead pretend it’s a mole-fraction of CO2-wot-done-it. Quite astonishing and can only be explained by the clash between nature and commercial vested interests.
Same for other places in the region
Here’s some temperatures from around the Arctic
https://s19.postimg.org/vws4z68s3/arctic_temp.png
And 8 from Iceland
https://s19.postimg.org/5ffms4j1v/iceland_8.jpg
Greenland December temperatures
https://s19.postimg.org/jftrrchtf/Greenland_Dec_temps.png
USA NDCD measured temperatures
https://s19.postimg.org/o1d61lfoz/Ncdc_measured.jpg
Even the most blinkered of AGW fools should be able to see the pattern
oops.. Link site seems to the temporarily down.
Sorry !
These are great plots, which clearly indicate that we are indeed in a warming phase; however, when looking at the numbers historically and comparing them to the 1930’s its within normal fluctuations! Like Tony’s always says, weather oscillates and is not linear!!!
Can anyone run the temperatures from Canadian stations in the Arctic? e.g. Eureka. It would only be from about 1950 which would miss the earlier warming.
Thanks.
Eureka, Feb. 1979 – set the record for the Coldest Mean temp in North America, -47.9C (thankfully I arrived in March)…so, yes, a cold winter up north…
February 1979 was an extreme cold month over most of North America.
January 1977, 1978 and 1979 were the top three coldest Januaries in the history of Waterloo, Iowa. It is astounding that a place would have their three coldest Januaries on record back to back to back.
The climate scam is largely based on the alarmists cherry picking 1979. How clever of them!
Jan. 1978 I walked across the Ohio River
The left hangs itself better than anyone. They’re experts. These newspaper clippings just keep on giving and giving. Priceless! And, Homer Simpson is perfect. You’re a master at it, Tony. Keep it up!
In today’s America, Seth is allowed to self identify as anything he likes, and apparently he likes toast.
https://www.youtube.com/watch?v=c0NdwzdOLkE
The climate is remarkably stable over geographic time scales, but not perfectly so because of our relation to that big burning thing in the sky.
How can we not factor Milankovitch cycles into climate conversations?
And why do we speak of weather cycles, 10, 20, 50 years in terms of climate which should be measured in 1,000s?
Tony:
These graphs seem to put the current sea ice extent close-to-or-below 2 standard deviations. That doesn’t give credibility to the “ice free” alarmism. But it seems to lend credibility to the stating the sea is much lower than normal, yes?
That notwithstanding, is there a downward trend and is it simply part of the natural cycle of changes in sea ice extent? Does rate of year-to-year change seem to be positive, negative, or stable? Is there a valid way to compare rate of change from year to year?
Just curious, as always. LOL
Cheers,
Marc
What is “normal”?
The big problem is that the late 1970’s level was decidedly NOT NORMAL.
The Little Ice Age was the COLDEST period in 10,000 years, so expectedly, that was a period of extreme Arctic sea ice extent. Thing is that the Icelandic sea ice index shows that the late 1970s was up there with the extremes of the LIA
https://s19.postimg.org/bkgbf2prn/Icelandic_sea_ice_index_2.png
REALITY is that while we have lost a bit of sea ice since the most extreme extents in the Holocene, the current level is still FAR ABOVE NORMAL for the current interglacial.
https://s19.postimg.org/vgdnb299v/Arctic-_Sea-_Ice-_Holocene-_Stein-17.jpg
Those people who insist of using a piddlingly short period out of the COLDEST period in 10,000 years, to push some sort of anti-human agenda, need their butts kicked good and hard..
Don’t be one of them, Marc.
What part of “following the AMO cycle” do you not understand? Or do you just wish to stir the pot whilst showing your ignorance?
Speaking of “following the AMO cycle”
Swiss glaciers…
https://s19.postimg.org/xxtc8onhv/swiss_glaciers.png
Mt Baker glaciers
https://s19.postimg.org/j23ct07zn/mt_baker.png
Marc,
What is normal is for the amount of ice to fluctuate over various time scales.
Just like the temperature at any given place does, and the amount of rain, the number of days with fog.
There are probably zero natural phenomenon which do not fluctuate both randomly and with some periodicity or another.
And these are all superimposed on each other.
If one has a very long period of very good observations and measurement records, one might be able to arrive at some sort of “average”, but that number is as likely to be meaningless or misleading as to give anyone any useful information.
There are a lot of places that have wet years and dry years. The number of years that the exact average amount of rain falls may be zero.
Just like no one has 2.5 children.
2.5 children – nought.5 isn’t the red-headed step child?
Disillusioned again. ;-P
jk
Just to be explicit, that chart is the Real Reykjavik temp chart and not the phony “corrected” version, yes.
There’s nothing imaginary here in Tsiigehtchic. Out walking around in -20 weather and you soon find out how effective your winter clothing is. A heavy winter coat to us Southerners is inadequate here. Here you know to pull the liners out of your boots and get them dried out at night time. Perspiration you know.
The drive down from Inuvik at up to 120 km/h at times was surprisingly smooth. When it’s frozen, it’s like pavement.
When crossing the Mackenzie, they were flooding other lanes to make thicker ice.
It’s so suppose to be a little milder here in the -teens for the balance of the week.
I’m so glad I’m a Canadian.
So, it’s been warming since we hit bottom in the late 1970s (which Heidi Cullen and the rest of the climatists call “normal”). Got it.
Bbbbbut wait… scientists and their trusty graphs were indicating at the time that it was cooler than ‘normal’ (caused by anthropogenic CO2 and pollution). They were telling us it was going to get even cooler. Did it?
Now climate scientologists are telling us that not only is it warmer than ‘normal’ now, it’s going to get even warmer (because of… drum roll… “carbon pollution”).
‘Normal’ – it’s that [changing] perfect place that’s always in the past – that you can never get back to.
Oops. That last sentence above about what is normal (in climate) is missing the key element. It should say…
‘Normal’ – it’s that [changing] perfect place that’s always in the past – that you can never get back to – because it never existed in the first place.
The AMO-seaice cycle is clear for anyone with an open mind to see. What will the alarmists say when the sea ice increases as predicted? New Ice age scare? Why not , for alarmists CO2 is the bogeyman to be blamed for everything.
I remain convinced they do know it and knew it all along. In fact, they were counting on it to sell their scam. These repeated, ever moving, and increasingly shrill claims of deadlines to act before a “carbon tipping point” is reach are based more upon when the next downward movement comes. That is the real tipping point. They know good and well they must tie America to their scam or it will fail.
I hate to sound like a tin foil hat wearer, but I can’t help thinking this is a big part of why the media and politicians from both sides of the aisle hate the Trump presidency so much. They know 8 years of Trump could put a permanent end to the entire BS party. It may very well be impossible to hide the decline at that point. That would be a huge blow to Globalism.
Or would they just pivot back to an impending ice age?
I became convinced of the intentional malfeasance on the part of at least some of these people when I made a deep dive on the temperature records used by the Berkeley Earth group. Pardon my profanity, but there is a group of people in there who know damn well the data set is mostly worthless crap. Every chart they put out is bullshit in its purest form. It is either that or incompetence and stupidity in staggering, unbelievable amounts.
Thank you Mark
The best journal to publish a Global Cooling article would be?
Would like to publish a small peer review paper, what’s the best way to do this?
Thank’s…
It is obvious by far the very worst threat to humanity is another Ice Age. It is mind boggling that only 15,000 years ago that there was a mile or more thick sheet of ice down to NYC and Chicago. That is a blink of the eye in geological terms. The scary aspect is that no one really knows was triggered it. A big volcanic eruption? A decrease in solar activity like we are having now? Various cycles interfacing at the same time? Cosmic rays? I believe that we should thank our lucky stars if man made CO2 can mitigate any of these factors by a couple of degrees (which it may or may not be capable of doing).
With this extremely cold pattern setting up at present for both the US and Europe, by the end of December, global warming will not seem at all like an undesirable concept.
Remember, that kids are completely different as people;
with distinct learning types as in comparison with their siblings and even mother and
father https://math-problem-solver.com/ . Recess at public faculties have gotten shorter and shorter,
however it is a crucial time in your baby.