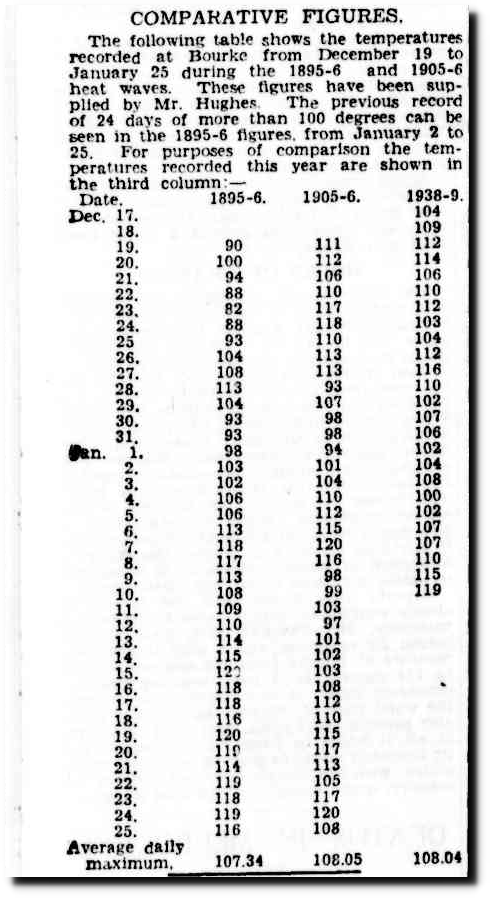
The average maximum temperature at Bourke, NSW this year has been 105.8F, with a peak of 113.7F. The years 1896, 1906 and 1939 were all much hotter, with peak temperatures of 120 degrees in 1896 and 1906. BOM hides all the pre-1910 data which wrecks their global warming scam.
Email Subscribe
Disrupting the Borg is expensive and time consuming!
-
Recent Posts
Recent Comments
- Mike on 400% Energy Inflation In Europe
- Heretic Jones on Soros Says Democracy Is Far Right Extremism
- Disillusioned on Tropical Heatwave In New York
- Rah on “Great University of Unlearning”
- Jeff L. on 400% Energy Inflation In Europe
Archives
- July 2022
- June 2022
- May 2022
- April 2022
- March 2022
- February 2022
- January 2022
- December 2021
- November 2021
- October 2021
- September 2021
- August 2021
- July 2021
- June 2021
- May 2021
- April 2021
- March 2021
- February 2021
- January 2021
- December 2020
- November 2020
- October 2020
- September 2020
- August 2020
- July 2020
- June 2020
- May 2020
- April 2020
- March 2020
- February 2020
- January 2020
- December 2019
- November 2019
- October 2019
- September 2019
- August 2019
- July 2019
- June 2019
- May 2019
- April 2019
- March 2019
- February 2019
- January 2019
- December 2018
- November 2018
- October 2018
- September 2018
- August 2018
- July 2018
- June 2018
- May 2018
- April 2018
- March 2018
- February 2018
- January 2018
- December 2017
- November 2017
- October 2017
- September 2017
- August 2017
- July 2017
- June 2017
- May 2017
- April 2017
- March 2017
- February 2017
- January 2017
- December 2016
- November 2016
- October 2016
- September 2016
- August 2016
- July 2016
- June 2016
- May 2016
- April 2016
- March 2016
- February 2016
- January 2016
- December 2015
- November 2015
- October 2015
- September 2015
- August 2015
- July 2015
- June 2015
- May 2015
- March 2015
- January 2015
Tony, Weatherzone has Bourke day records tabulated for each month (see link below) . Place cursor on the temperature data and you get the year of the record. E.g. for January, record maximum of 49.7 deg C ( 121.46 F) on 13th, 1878.
Just in case it helps, Cheers.
http://www.weatherzone.com.au/climate/station.jsp?lt=site&lc=48013
Thanks!
Great post Tony!
Have you seen this in the Canadian MSM?
https://globalnews.ca/news/3955038/danielle-smith-what-if-the-earth-is-actually-cooling/amp/
That was a great podcast – Tim Ball was excellent!
Sydney had an extremely hot day on Sunday (1/7) where the high temp reached 110F. However, the Washington Post published 117F and didn’t mention that instead using the official airport temp, they instead used the temperature recorded at Penrith, an outpost city located 54km (1-hour drive) west.
Textbook definition of fake news! https://www.washingtonpost.com/news/worldviews/wp/2018/01/09/its-so-hot-in-australia-that-bats-brains-are-frying/?utm_term=.769a448d6307
But par for the course when dealing with true believers !
During the 1939 heatwave, Adelaide set its highest temperature recorded, Melbourne’s highest Jan temperature was recorded (while still at the botanic Gardens. Its highest temperature ever was recorded in Feb in the city surrounded by roads and concrete with new electronic equipment that can pick up short lived spikes of a couple of degrees). Alice Springs had 26 days over 100 F (and most over 40 C) during that period. Mildura had 14 days over 100 F in the first few weeks of Jan that year with 6 over 45 C (113 F) and a few people died of the heat. And while the 1939 data for Suburban Sydney has gone missing, the Richmond record for suburban Sydney was set that month and it looks like there was about 5 days of 45 C + during that period looking at newspapers.
The corner of SE Australia was in a massive heat wave but it was barely hotter in recent times.
I just checked this against the BOM data for Bourke Post office.
The 1938-39 temperatures were EXACTLY the same as in that newspaper clipping.
And the Bourke data goes back to 1871, utterly wrecking the claim that “BOM hides all the pre-1910 data”.
Check it out for yourself:
http://www.bom.gov.au/climate/data/stations/
You will have to search for Bourke then select Bourke Post Office.
Look at everyone who just believes what you have written without a semblance of a check.
BOM temperature graphs begin in 1910. They are hiding the pre-1910 data. But thanks for your misinformed comment.
BOM declares pre 1910 data is unreliable.
So because you are incapable of looking beyond the graphs and checking the actual data, then the data is being “hidden”? Interesting concept – that whether person A performs action X depends solely on whether a self-appointed higher authority B actually bothers to look for X.
So because you feel that BOM is justified in omitting inconvenient data and publishing misleading graphs to support the global warming narrative—-something they wouldn’t be able to do if they used the complete record—-you feel that Tony is incapable of looking beyond the graphs and checking the actual data?
Interesting concept, Ms Des. Do you use this kind of feeling-your-way-to-a-conclusion method routinely or at random? And would you mind telling me in what industry or for which company you work so I know whose product to avoid?
As I’ve said, no one has shown here that BOM has not used all the data.
You feel you’ve said that, Ms Des.
It is a well known FACT that BOM does not use data before 1910.
It HAS to, to sell the AGW scam, because the late 1800’s were MEASURED as being warmer than now.
Let’s have a look at UAH for Australia, shall we, see how much BOM are fudging the last 20 years.
You can remain ignorant of FACTS , ms Desperate, or you can actually do some research of your own.
Not sure what you believe that graph says specifically about Bourke in 1896 or 1939. You are clearly confused.
And your graph displays only how much Christy and Spencer have fudged their data. Satellite data is the easiest to fudge – when they come up with their magic figures, there is NOTHING to reference them against to check for correctness.
You really are getting DESPERATE now.
Is DESPERATION all you have in your life as the AGW starts to unravel :-)
UAH checks with most real data.
GISS et al, the surface fabrications and homogenisations are a proven load of junk.
UAH matches NOAA’s own satellites
(which NOAA don’t use because they match UAH)
Des says:
January 12, 2018 at 3:13 am
And your graph displays only how much Christy and Spencer have fudged their data. Satellite data is the easiest to fudge – when they come up with their magic figures, there is NOTHING to reference them against to check for correctness.
Rah says:
Dr. Christy and Dr. Spencer are both luke warmers and UAH is most probably the best representation of global temperature (what ever that is) of all the satellite data sets. Prove your contention that they have “fudged their data”. Lay out your evidence for that or be recognized as just another dumb troll who spews what ever crap comes to their mind at the time and thus not worth the time.
Ms Des says…
Satellite data is the easiest to fudge – when they come up with their magic figures, there is NOTHING to reference them against to check for correctness.
Ms Des, thank you for verifying the fact that you are speaking out of your arse..
A recent comparison (1) of temperature readings from two major climate monitoring systems – microwave sounding units on satellites and thermometers suspended below helium balloons – found a “remarkable” level of agreement between the two.
To verify the accuracy of temperature data collected by microwave sounding units, John Christy compared temperature readings recorded by “radiosonde” thermometers to temperatures reported by the satellites as they orbited over the balloon launch sites.
He found a 97 percent correlation over the 16-year period of the study. The overall composite temperature trends at those sites agreed to within 0.03 degrees Celsius (about 0.054° Fahrenheit) per decade. The same results were found when considering only stations in the polar or arctic regions.
http://www.cgd.ucar.edu/cas/catalog/satellite/msu/comments.html
Ms Des, like all other alarmists, simply invents convenient “facts” to keep her religion alive. Too bad she does not fact check, like us skeptics.
Fact checking is what defines a skeptic Ms Des. What exactly defines you?
Thanks for proving that deniers are indeed not skeptics.
Climate Change Makes Me Feel
Not sure what you are attempting to prove about the truth of Bourke’s temperature record with that link.
His proof is WAY more solid that anything you have put forward.
All you keep managing to do is undermine your own ignorance.
Desperate of you, for sure, little des-troll.
Thanks for proving that deniers are indeed not skeptics.
Thanks for proving beyond a shadow of a doubt that you have no clue what you are talking aboout Ms Des.
Satellite data is the easiest to fudge – when they come up with their magic figures, there is NOTHING to reference them against to check for correctness.
Really? LOL
To verify the accuracy of temperature data collected by microwave sounding units, John Christy compared temperature readings recorded by “radiosonde” thermometers to temperatures reported by the satellites as they orbited over the balloon launch sites.
He found a 97 percent correlation over the 16-year period of the study.
http://www.cgd.ucar.edu/cas/catalog/satellite/msu/comments.html
Go home child.
Read my reply to your later identical post.
Ditto Ms Know Nothing.
Satellite data is the easiest to fudge – when they come up with their magic figures, there is NOTHING to reference them against to check for correctness.
Bwahahahahaha!!
Australia’s highest temperature is 50.6C because higher temperatures before 1910 are ignored.
The temp record for Bourke for Jan, 1939 has been altered in the new improved ACORN data which was developed around 2011.
All the daily temps over 30C were altered down (up to 1C) and the two under 30C were ‘upped’ by 0.1C.
Raw data here.
http://www.bom.gov.au/jsp/ncc/cdio/weatherData/av?p_display_type=dailyDataFile&p_nccObsCode=122&p_stn_num=048013&p_c=-461043249&p_startYear=1939
ACORN datahere.
http://www.bom.gov.au/climate/change/acorn/sat/data/acorn.sat.maxT.048245.daily.txt
This had the effect of lowering the max monthly mean average from 40.4C to 40.04C.
It also reduced the 17 consecutive days of +40C to only 11 days.
(FYI, this data set replaced the High Quality data set).
BoM’s preamble on the ACORN data set.
‘The Australian Climate Observations Reference Network – Surface Air Temperature (ACORN-SAT) dataset has been developed to monitor climate variability and change in Australia.
The dataset employs the latest analysis techniques and takes advantage of digitised observational data to provide a daily record of Australian temperatures over the last 100 years.
The data is robust and comparable through time, which will enable climate researchers to better understand long-term changes in monthly and seasonal climate, as well as changes in day-to-day weather, such as the frequency of heat and cold extremes.’
‘Data is robust’ – mmmm!
And, BTW, Tony is right, Des. BoM disregard any temps before 1910 even though many sites had a Stevenson screen during the late 1880s.
Bourke had 22 days of +40C in Jan, 1896. What would ACORN have done to that?
BOM data … Bourke POST OFFICE
ACORN data …. Bourke AIRPORT
You you guys ever look at the DETAILS? They are not the same station.
“DO you ….”
“They are not the same station.”
TOTALLY WRONG, aren’t you Des.
The first 1910-1998 of the Acorn data is actually adjusted Bourke PO data (minus the data before 1910, of course)
EXACTLY as Ian said.
Were you INTENTIONALLY LYING or just plain IGNORANT??
No, they’re not the same station. The raw data is from the PO then the BOM has taken data from the airport in 1998 using an AWS. That site was faulty and so another AWS was started nearby.
The BoM were being lazy and not reporting this fact, making out it was always at the AP. Bourke did not have an airport in the 1880s – there were no planes then, Des.
Bourke airport opened in 1943.
How very odd that ACORN Bourke Airport AWS goes back to 1910. ;-)
They cludge together adjusted Bourke PO data to 1998 with INCOMPATIBLE AWS data after 1998, while leaving out “inconvenient” Bourke PO data before 1910.
And the data STILL shows COOLING until 1998 and the farce of the AWS 1 second readings.
Cludge? So now you’re inventing new words. Try KLUDGE or KLUGE.
I used exactly the word I intended to.
Your IGNORANCE and sad attention-seeking iare showing .. YET AGAIN. !
Ian, The REALLY funny part , is that Bourke Airport AWS only started in 1998 according to… http://www.bom.gov.au/climate/averages/tables/cw_048245_All.shtml
Yet the data you link to in your second link starts in 1910….
WAY before AWS was ever invented.
I wonder where that data came from?
One possibility is that it is a cludge of some sort from Bourke PO
Another possibility is that pre-1998 Bourke Airport data was mercury thermometer/Stevenson
Bourke PO goes back to 1871, but the mysterious data for Bourke Airport AWS only goes back to 1910.
Someone is not telling the whole story !!
The other thing to note is the large amount of missing data in that Acorn table SINCE 1998 when the AWS was installed.
That’s BOM efficiency for you ;-)
Another interesting points is that up until 1998 when the AWS was installed, the trend was -0.0065C/year
After the AWS was installed, the trend was +0.0526C/year (that is the period that UAH shows ZERO warming over Australia. But who knows, with all that missing data. !!!
Note: the Max temp in that Acorn data is 48.8C on 5/12 1981
(back to 1910) ;-)
Doesn’t that data loss from the AWS period really stand out, hey Des.
How does that happen??? except by either …
INCOMPETENCE, or INTENT. !!
LOTS of scope for BOM “in-filling” ;-)
Just how they like it. !
“Someone is not telling the whole story”
Have you considered the possibility that YOU HAVEN’T LOOKED FOR THE WHOLE STORY?
Ok, desperate, where does the first 80% or so of the AWS come from? (the data from 1910-1998)
You do agree that it is NOT AWS data, don’t you?
You know – you COULD use Google.
Check the ACORN-Sat Station catalog I downloaded:
https://drive.google.com/file/d/1r9d2dBjI4ODF0qWPEmyVvSWmtN5AEYHs/view?usp=sharing
NOTHING is hidden. The whole story IS being told. Do you think next time YOU could go to the effort of checking for yourself.
And seriously … do you honestly believe toying with a person’s name helps your case in any way? Try being a little more mature.
So its the PO data, and it has been “adjusted ” as Ian suggested.
The PO data goes back to 1871, but ACORN only goes back to 1910. OOPS !!!!
Thank you for PROVING everything that Ian and I have said. :-)
Well done, and totally HILARIOUS. :D
“Proving”??
What exactly do you see as the issue?
Try to keep up, desperate little child.
ACORN uses Bourke PO data before 1998, as part of Bourke Airport AWS.
That PO data goes back to 1871, but before 1910 IS NOT INCLUDED in the ACORN data.
It has been adjusted down in 1939 as Tony and Ian have shown.
The raw data shows slight cooling up to 1998
The AWS data post 1998 is missing HUGE slabs, goodness knows what they infill that with.
You have been shown to be WRONG on every point.
GET OVER IT !!
and crawl back into your troll hole. !!
Ahhh – out comes the bluster.
Please quote a claim of mine that this has “proved” wrong.
Still looking? You really should save yourself the effort.
Des.. EMPTY sack of —
Caught out with a LIE, and so cowardly he can’t admit it. !!
I’m inviting you to QUOTE this “lie” and make it official. What exactly is preventing you from doing this? Because the only claim I believe I made was that BOM is NOT hiding anything, and that link proved that and hence proved YOU wrong.
Whenever you’re ready.
Run and HIDE little trollette.
Everybody, except you, can see you have been caught out in a BOM lie.
Maybe you just need to find a new troll crevasse.
You said “They are not the same station.”
But you then went on to prove your LIE,
For all of the 1910-1998, they ARE the same station data.
Your link PROVES that.
So why keep up the LIE ?
And the DO cut the data at 1910, even though the PO data starts in 1871.
YOU LIED when you said they didn’t cut data before 1910. They patently DO.
How do you live with yourself, LIE after LIE…???? Is it a Marxist thing? You are so used to LYING ???
Or is it that you are SO DUMB that you can’t see your own cognitive failure. ??
Hahahaha – look who’s doing the trolling.
Anyway you can’t tell me what incorrect claim I made, so it’s settled – I made none.
Next question: Given that Acorn-sat data is NOT used by NOAA or NASA in determining global temperatures, what exactly is your issue? I also have an issue with splicing data from different sites. But since NOAA/NASA only uses INDIVIDUAL sites with contiguous data, AND they use ALL data, not just going back to 1910, it really is of no significance.
And as I showed in the case of Bourke Post Office (NOT Acorn-sat), there have been NO adjustments since the original newspaper clipping. THIS data is what goes to NOAA/NASA.
You will now give another example of bluster and trolling because you are out of excuses.
RUN and HIDE from your LIES that are there for ALL to see.
Dig deeper, little worm !!
And may your own excrement keep falling in on top of you. I’m sure you will enjoy it.
All you are doing is displaying for all to see that you are incapable of holding a rational debate. I guess that makes you a Trump supporter/mimicker. Looking forward to Steve Colbert destroying Trump yet again on YouTube.
Poor desperate, beaten witness by his own data, and can’t admit it.
HILARIOUS. !!
I’m glad you agree Colbert is hilarious.
Poor Des has TDS. Needs a low-end comedian to tell him what to think.
Trump is having such fun triggering the far-left PC SJWs like you. :-)
Remedy is rational thought, Des… so you are stuck with your TDS for the next 7 years, and we will watch with glee :-)
I give you this thread to make a fool of yourself on..
https://realclimatescience.com/2018/01/only-democrats-can-say-those-things/
You do agree that this page
http://www.bom.gov.au/climate/averages/tables/cw_048245_All.shtml
Only shows “AWS” data exists from 1998 ?
As I understand it the conversion of all data collection to AWS started sometime in 1994, there are now very few collection points with data going back into the 1800s, Sydney Observatory being one of them.
And as JoNova showed, the methodology that BOM uses with their AWS is a FARCE, It doesn’t follow WMO standards.
It is ALWAYS going to come up with maximums that are totally incompatible with anything before AWS.
In any other branch of REAL science, they would be laughed out of town.. just like the desperate one.
It’s called Observatory Hill.
It will also not exist in the next couple of years as Fort St HS takes over the site. They are already running another station nearby in parallel with it for the sake of comparison, and it will eventually become the main site.
Jo Nova …. hahahaha
Facts are your EMEMA aren’t they, you poor desperate little troll..
About time they got rid of Observatory Hill.
Its been compromised for many decades, getting worse ever year.
The 2013 record was one of those one second LIES that BOM so luv to perpetuate.
Compromised by what exactly?
OMG , I really suggest you have a look at the history of development of and around Observatory Hill.
Why to you keep yapping.. It exposes your incredible LACK of any understanding of anything to do with surface stations and data quality.
STOP DIGGING !!!
Your troll-hole is deep enough already. !!!
If you are SO IGNORANT that you can’t see how manically compromised the site has been for decades, they NO-ONE can help you.
Really? So why has it risen by roughly the same amount as surrounding coastal areas over the past 20 years?
“So why has it risen by roughly the same amount as surrounding coastal areas over the past 20 years?”
WTF are you jabbering about ?
Past 20 years there is too much data missing from Bourke Airfield to say anything worthwhile.
Stop digging deeper, desperate fool !!
You are burying yourself in your own idiocy.
“as surrounding coastal areas ” roflmao !!!!
We are talking about Bourke, you MORONIC DOLT !!
You seem to be TOTALLY IGNORANT about basically everything if you think that Bourke has “surrounding coastal areas”
Seriously, do trolls get any more STUPID that this mentally deficient idiot !!
Where are these “surrounding coastal areas”? Desperate fool.
Adelaide, Fremantle, Broome, Darwin.
We all DESperately need your education on this matter..
….. Once we all stop laughing :-)
Your previous comment was about OBSERVATORY HILL in SYDNEY.
Try to maintain your attention.
Observatory Hill and all sites near it are fully homogenised to make them all the same trend.
Of course they are the same trend, bonehead,. !!
That’s like painting 3several balls red, and saying, “hey look they are all the same colour.” !
You really don’t have two brain cells to rub together, do you Des. !!
And note that the Sydney trends (both min and max) are basically constant from 1859, with ZERO evidence of any CO2 warming at all.
Just a natural climb out of the LIA , aided by general urban expansion.
While Newcastle, shows that current is about the same as 1904, and lower than the late 1800s.
So thanks again for point to evidence that shows that temperatures now are similar to around 1904, and Sydney has absolutely zero evidence of any CO2 warming, just a steady UHI rise. over its whole series.
You are doing well, des-troll. :-)
You do realise many stations are missing data, right? The daily data for Nobbys only begins in 1957, and in the first few years after that they are missing two entire months of data. That seriously affects annual averages. It is almost certain that those earlier years are missing heaps of daily data. It is 100% certain that years with so much missing data are not included in global averages.
“You do realise many stations are missing data, right? “
Yep, especially in the modern AWS era. ;-)
Do you think all that missing AWS data is from INCOMPETENCE..
…. or is it INTENTIONAL.
And as above, check Richmond RAAF (1st one now closed). If you hover over the highest daily in the statistics section, you get jun 14 1939 but no data in that month of 1939.
For all those who prefer to cast stones rather than take the time to search, here is an explanation of the old BOM data:
“For temperature data, almost all monthly and annual station data has been digitised,
and certainly enough to characterise the main features of climate variability and change for Australia. Daily data has not been entirely digitised, however daily digitisation of historical data has increased over the years to the point of providing a robust national daily dataset back to 1910.”
“Undigitised paper records also exist in various forms that are not currently within the Bureau’s holdings, such as documentary records from various sources that have not been managed by the Bureau. These data are of interest to climate scientists and the Bureau, but require extensive resources to identify, collate and curate.”
“An example of a recent collaborative effort to rehabilitate data from documentary evidence under a joint Australia Research Council project that included the Bureau of Meteorology is the Southeast Australian Climate History (SEARCH):
http://climatehistory.com.au/”
I have downloaded a large amount of data from BOM. For many sites before 1910, monthly averages exist but not daily data. In other words, although they have not yet digitised all the daily temperature records, they have still taken the time to enter all monthly averages.
Perhaps instead of whining and inventing conspiracy theories, you should all recognise the effort required to digitise and proof old data, and instead make your own contributions to that process.
Tens of billions of dollars in climate scam funding, but no money to digitize the pre-1910 data which BOM will ignore anyway.
For the left, all facts are “conspiracy theories”
So you believe that the Australian Bureau of Meteorology receives “tens of billions of dollars” in funding do you? How about you research the real figure then get back to me with the answer.
Again, your desperation in intentionally mis-understanding what was said. PATHETIC.
You really are a puerile low-life piece of socialist trash, aren’t you.
Try to grow up. You don’t belong in an adult discussion. Do you have ANY discussion about my opening post other than trolling?
Are you lonely tonight, and Desperate?
Desperately seeking attention ?
So sad.
So pitiful.
Its quite pathetic how little effort is being put into digizing Historical Temp Data given all the Government, Corporate and Big U money funneled into Climate Change.
1960’s Nimbus 1 Satellite Images are another example, they seem to contradict Climate Change Theory.. Antarctic Ice Extent in 1964, matches 2014!!.. Thus the Arctic images get put on the back, back burner when extending Arctic Satellite Data should be a huge Priority!!
More data is better, but we’re told the Science is settled.. Inconvenient Truths of Past Climate are not welcome..
Why do you need the digitised daily data when the monthly averages ARE digitised and the images are available to check on application?
You have proven yourself WRONG with your own data.
GROWN UP.
Be a man and ADMIT it..
instead of your pathetic whimpering.
Haven’t had your shots have you.
Poor SJW.. EMPTY. and very lonely.
DESperatel;y seeking attention are you ??
So sad. so pitiful.
Thanks for agreeing with me.
Thanks all the help EXPOSING the farce that is BOM Bourke data, ms. desperate
Try not to be so desperate and attention seeking next time, little trollette… its too much of a laugh.
So you are now claiming the newspaper article from 1939 is wrong? I guess the conspiracy must go back almost 80 years … hahaha
Once more, as above, Richmond RAAF has it listed as 14 jun 1939 as the hottest temperature recorded even for the 1939 page which doesn’t contain any data.
Using that Acorn AWS data, we get the following
Slight COOLING from 1910 – 1998 .. ie before AWS existed in the AWS data (lol)
Warming after the AWS was installed. (with LOTS missing data as shown above)
Note missing values set to “N/A” for trend calculations
Let’s look at that “missing data” graph again
https://s19.postimg.org/w9qhxuwer/bourke_missing.png
(thanks desperate, for bring this to our attention. :-) )
Is it INCOMPETENCE??
….. or is it INTENTIONAL?
Allowing huge slabs of “in-filling™”
Could post that missing data graph all day,
.. is so darn hilarious. :-)
You would have to be totally desperate NOT to laugh at it.
Pathetic… If Climate Change is soooo Important..
How can Temp Readings be so sloppy and inconsistent??
Tony has mentioned MANY times just how much so-called surface data is “ESTIMATED” in the USA.
I’m pretty sure that a search would turn up much the same elsewhere.
The whole surface measurement farce seems to be almost DELIBERATELY orchestrated to be easily mal-manipulated.
It is just TOO CONVENIENT to have that much “NON-DATA” available.
How is it possible, with so-called modern equipment to have SO MUCH missing data. !!
Which is it….
INCOMPETENCE.. or INTENT !!!
Can’t say I’ve looked at any of the raw data, Des. However, with what’s been demonstrated regarding adjustments to the historical data set in the US, just over the past couple of decades, it’s a challenge to not see such actions as skullduggery. Then consider how closely governments work together on this effort and in the end answer only to an intergovernmental panel (who ostensibly, is accountable to no one), and again…a whiff of something not-so-fresh is detected. Call this circumstantial if you like (as I already conceded, I personally haven’t looked at the data), but it’s not Bigfoot chasing either.
Ms Des says…
Ahhh – out comes the bluster. Please quote a claim of mine that this has “proved” wrong.
OK.
Satellite data is the easiest to fudge – when they come up with their magic figures, there is NOTHING to reference them against to check for correctness.
Really? LOL
To verify the accuracy of temperature data collected by microwave sounding units, John Christy compared temperature readings recorded by “radiosonde” thermometers to temperatures reported by the satellites as they orbited over the balloon launch sites.
He found a 97 percent correlation over the 16-year period of the study.
http://www.cgd.ucar.edu/cas/catalog/satellite/msu/comments.html
Ms Des feel free to come back once you have studied climate change, your parroting of nonsense is embarrassing for you, and you really should stop making yourself look stupid.
“and you really should stop making yourself look stupid.”
Too late for that, gator… he/she is now just randomly seeking attention with his/her little tantrums.
I bet he/she can’t stop making a fool of themselves.
This claim was based on mid 1990s study.
From your link:
“Globally, however, the satellite data show a cooling trend of 0.03 degrees Celsius per decade since the first NOAA TIROS-N satellites went into service.”
A COOLING of 0.03 degrees per decade. You DO realise that the UAH data has been GREATLY adjusted for orbital biases since then, right? The CURRENT adjusted data gives a WARMING trend of 0.08 degrees per decade up to the end of 1995. That is a change of 0.11 degrees per decade.
Do you think that radiosonde data underwent the same adjustments? In other words, how close is the UAD trend to the radiosonde trend POST-ADJUSTMENT? As they stated that the radiosonde trend at that time was MINUS 0.05, unless there has been such an adjustment then there is now a NEGATIVE correlation between the two data sets.
Feel free to come back when you manage to free yourself of outdated 1990s studies that even John Christy would have to admit are now wrong.
Ms Des, you DO realize that the greenhouse effect is 19th century science, right? So by your standards we should dismiss it. Right?
Now back to the fact that you do not know what you are talking about…
Satellite data is the easiest to fudge – when they come up with their magic figures, there is NOTHING to reference them against to check for correctness.
Go home child.
What an intellectually feeble and dishonest response.
The basic scientific principle of the greenhouse effect has not changed. Christy’s mathematical guesswork HAS.
The fact that the SAME input data yields two different outcomes, one of -0.03 and another of +0.08, BOTH FROM THE SAME INDIVIDUAL, is the perfect illustration of how easy it is to fudge this data. And RSS produces yet another result from the same data, and they have also gone through multiple versions.
And since the radiosonde date does not correlate with CURRENT versions, there is absolutely no check. Have you ever seen gridded daily data used for constructing the UAH, as is available for all land-based data? There is ZERO transparency in satellite data set construction.
So you are a balloon denier? Nice to know. Explains why you do not understand Christy’s work.
It is easy to tell when you’ve beaten a denier – they respond with random, meaningless comments that don’t address the post … because they can’t.
Anyway, due to your inability to counter what I have said, I declare the matter settled – satellite data IS easy to manipulate and HAS been manipulated countless times. And the chance correlation between a flawed UAH data set and the spatially-challenged radiosonde data set no longer exists after Christy partially fixed the problem. Next step – fixed the discontinuities in the data between non-overlapping satellite regimes – something RSS has gone part way to addressing, while UAH don’t wish to further upset their oil-tainted benefactors.
Sorry Ms Des, but I had to educate you on satellite observations and verifications, as you were completely ignorant on that subject.
And 5 one hundredths of a degree discrepency! Oh my! What a travesty! Have you ever heard of “error bars? Probaly not, considering who your sources of “info” are.
If we have learned anything in the past decades, it is that CO2 has little to no effect on our current climate, as predictions based upon the greenhouse hypothesis have failed. I know I am wasting my time on a religious zealot who denies science, but I suppose it is good to show others that you are the real science denier on this thread, dismissing anything and everything that disagrees with your belief.
But go ahead and be the pigeon who “plays chess”. LOL
Oil-tainted benefactors. A true believer pulls the ultimate argument and declare the matters of her faith settled.
When is the next Jonestown gathering, Ms Des?
Spencer and Christy address:
Whole blog article here:
http://www.drroyspencer.com/2012/05/our-response-to-recent-criticism-of-the-uah-satellite-temperatures/#comments
“Our Response to Recent Criticism of the UAH Satellite Temperatures
May 9th, 2012 by Roy W. Spencer, Ph. D. ”
[here is the meat of it where UAH is compared to radiosonde data and other satellite data]
“Here are the comparisons for the US VIZ radiosonde network (stretching from the western tropical Pacific to Alaska down across the conterminous US and to the Caribbean.) As you can see, UAH MT provides the lowest error magnitudes and highest reproducibility of the three data sets. Similar results were found for the Australian comparisons.”