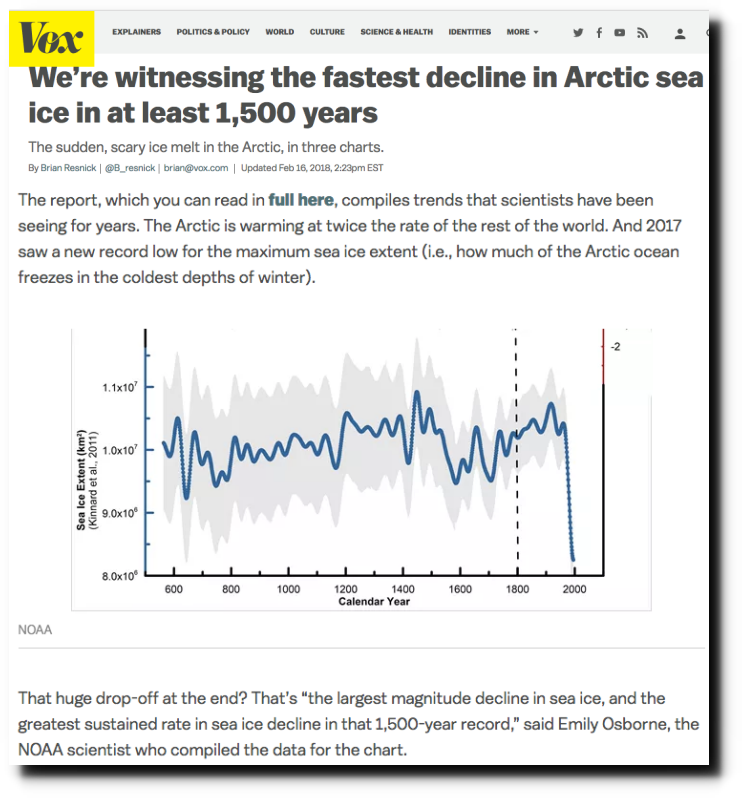
NOAA “scientists” are up to their usual tricks of making up fake data, claiming a hockey stick of Arctic ice back to the year 500 – with ice peaking in the early part of the last century.
We’re witnessing the fastest decline in Arctic sea ice in at least 1,500 years – Vox
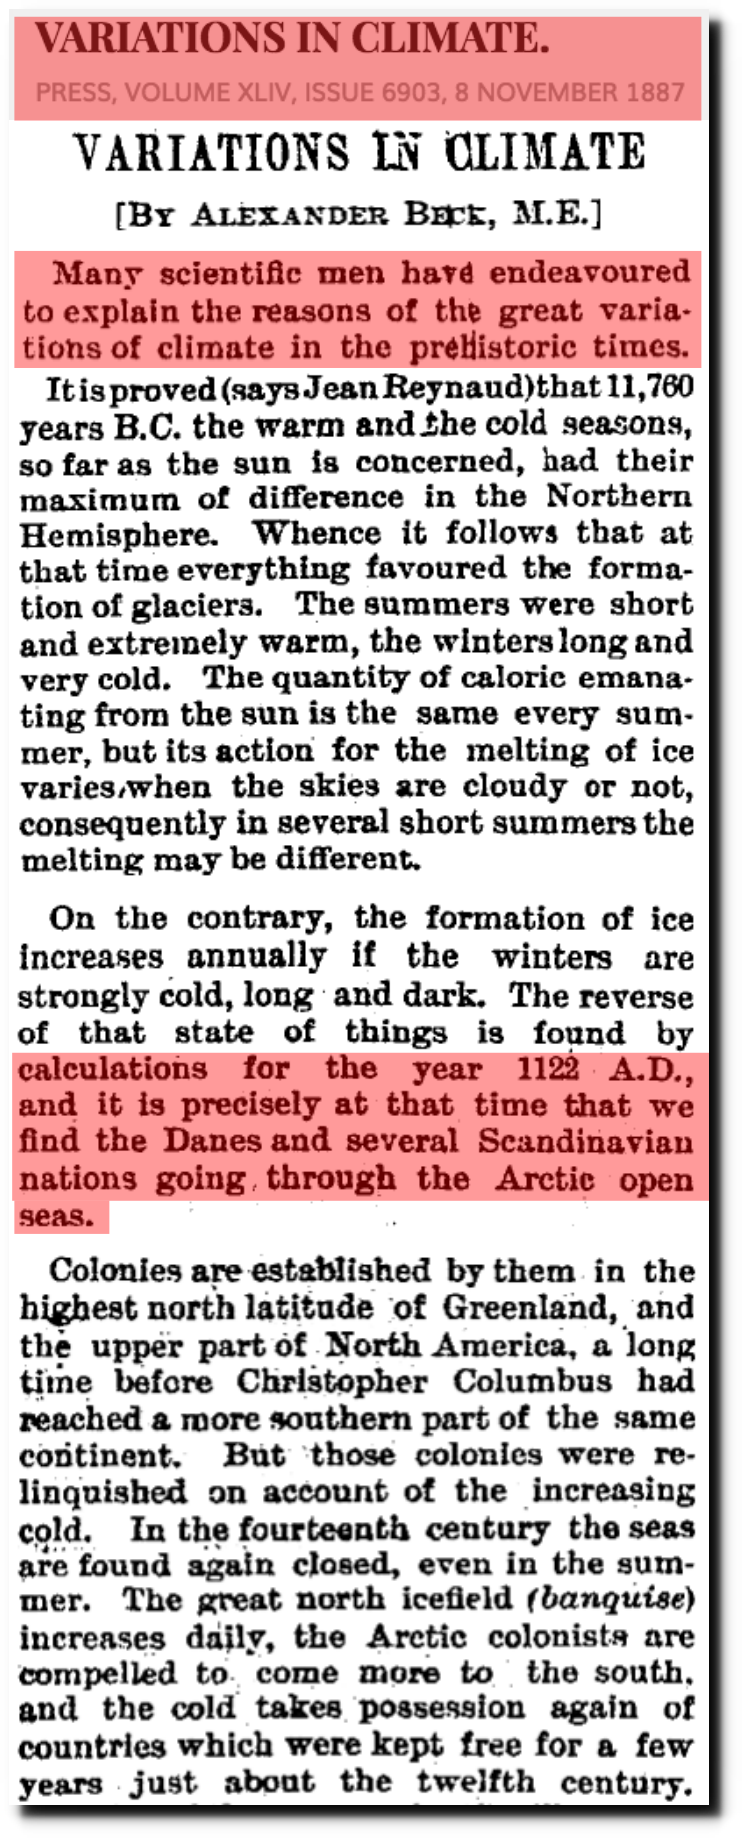
The NOAA graph is garbage. Vikings sailed open seas in the Arctic around the year 1100.
Papers Past | VARIATIONS IN CLIMATE. (Press, 1887-11-08)
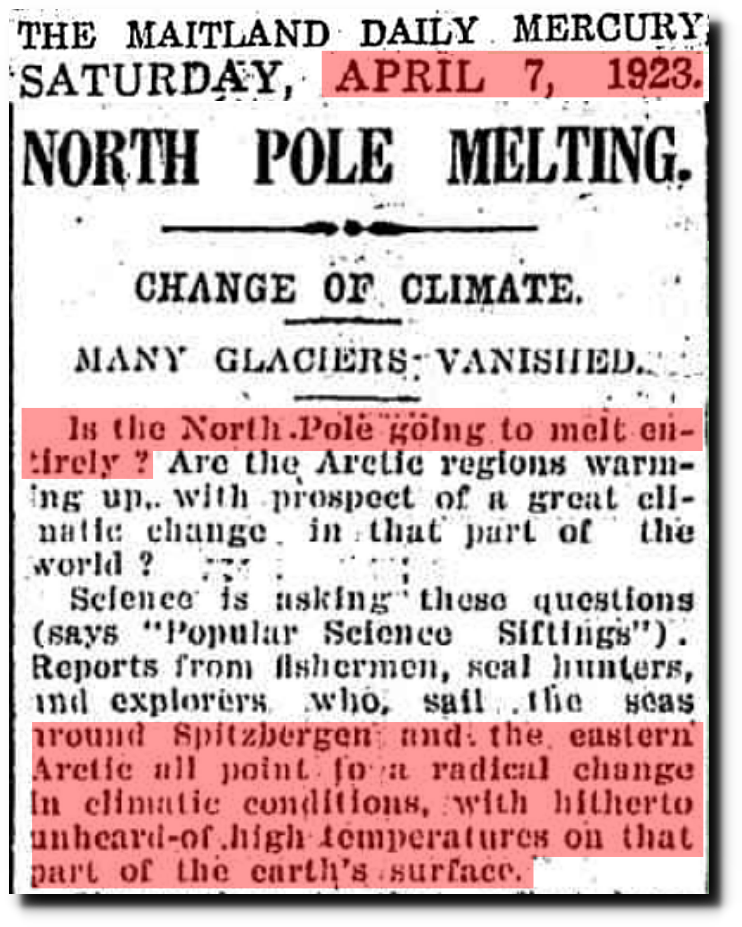
The North Pole was rapidly melting in 1923, and many glaciers had vanished.
07 Apr 1923 – NORTH POLE MELTING. – Trove
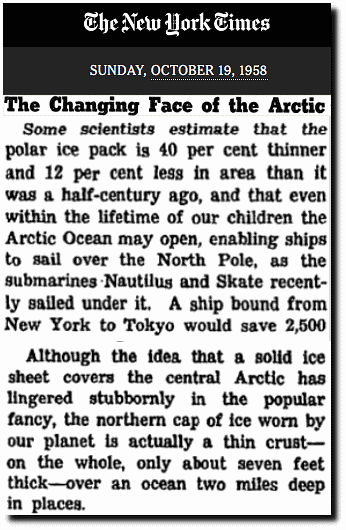
By 1958, there had been a 50% loss of Arctic sea ice volume.
The Changing Face of the Arctic; The Changing Face of the Arctic – The New York Times
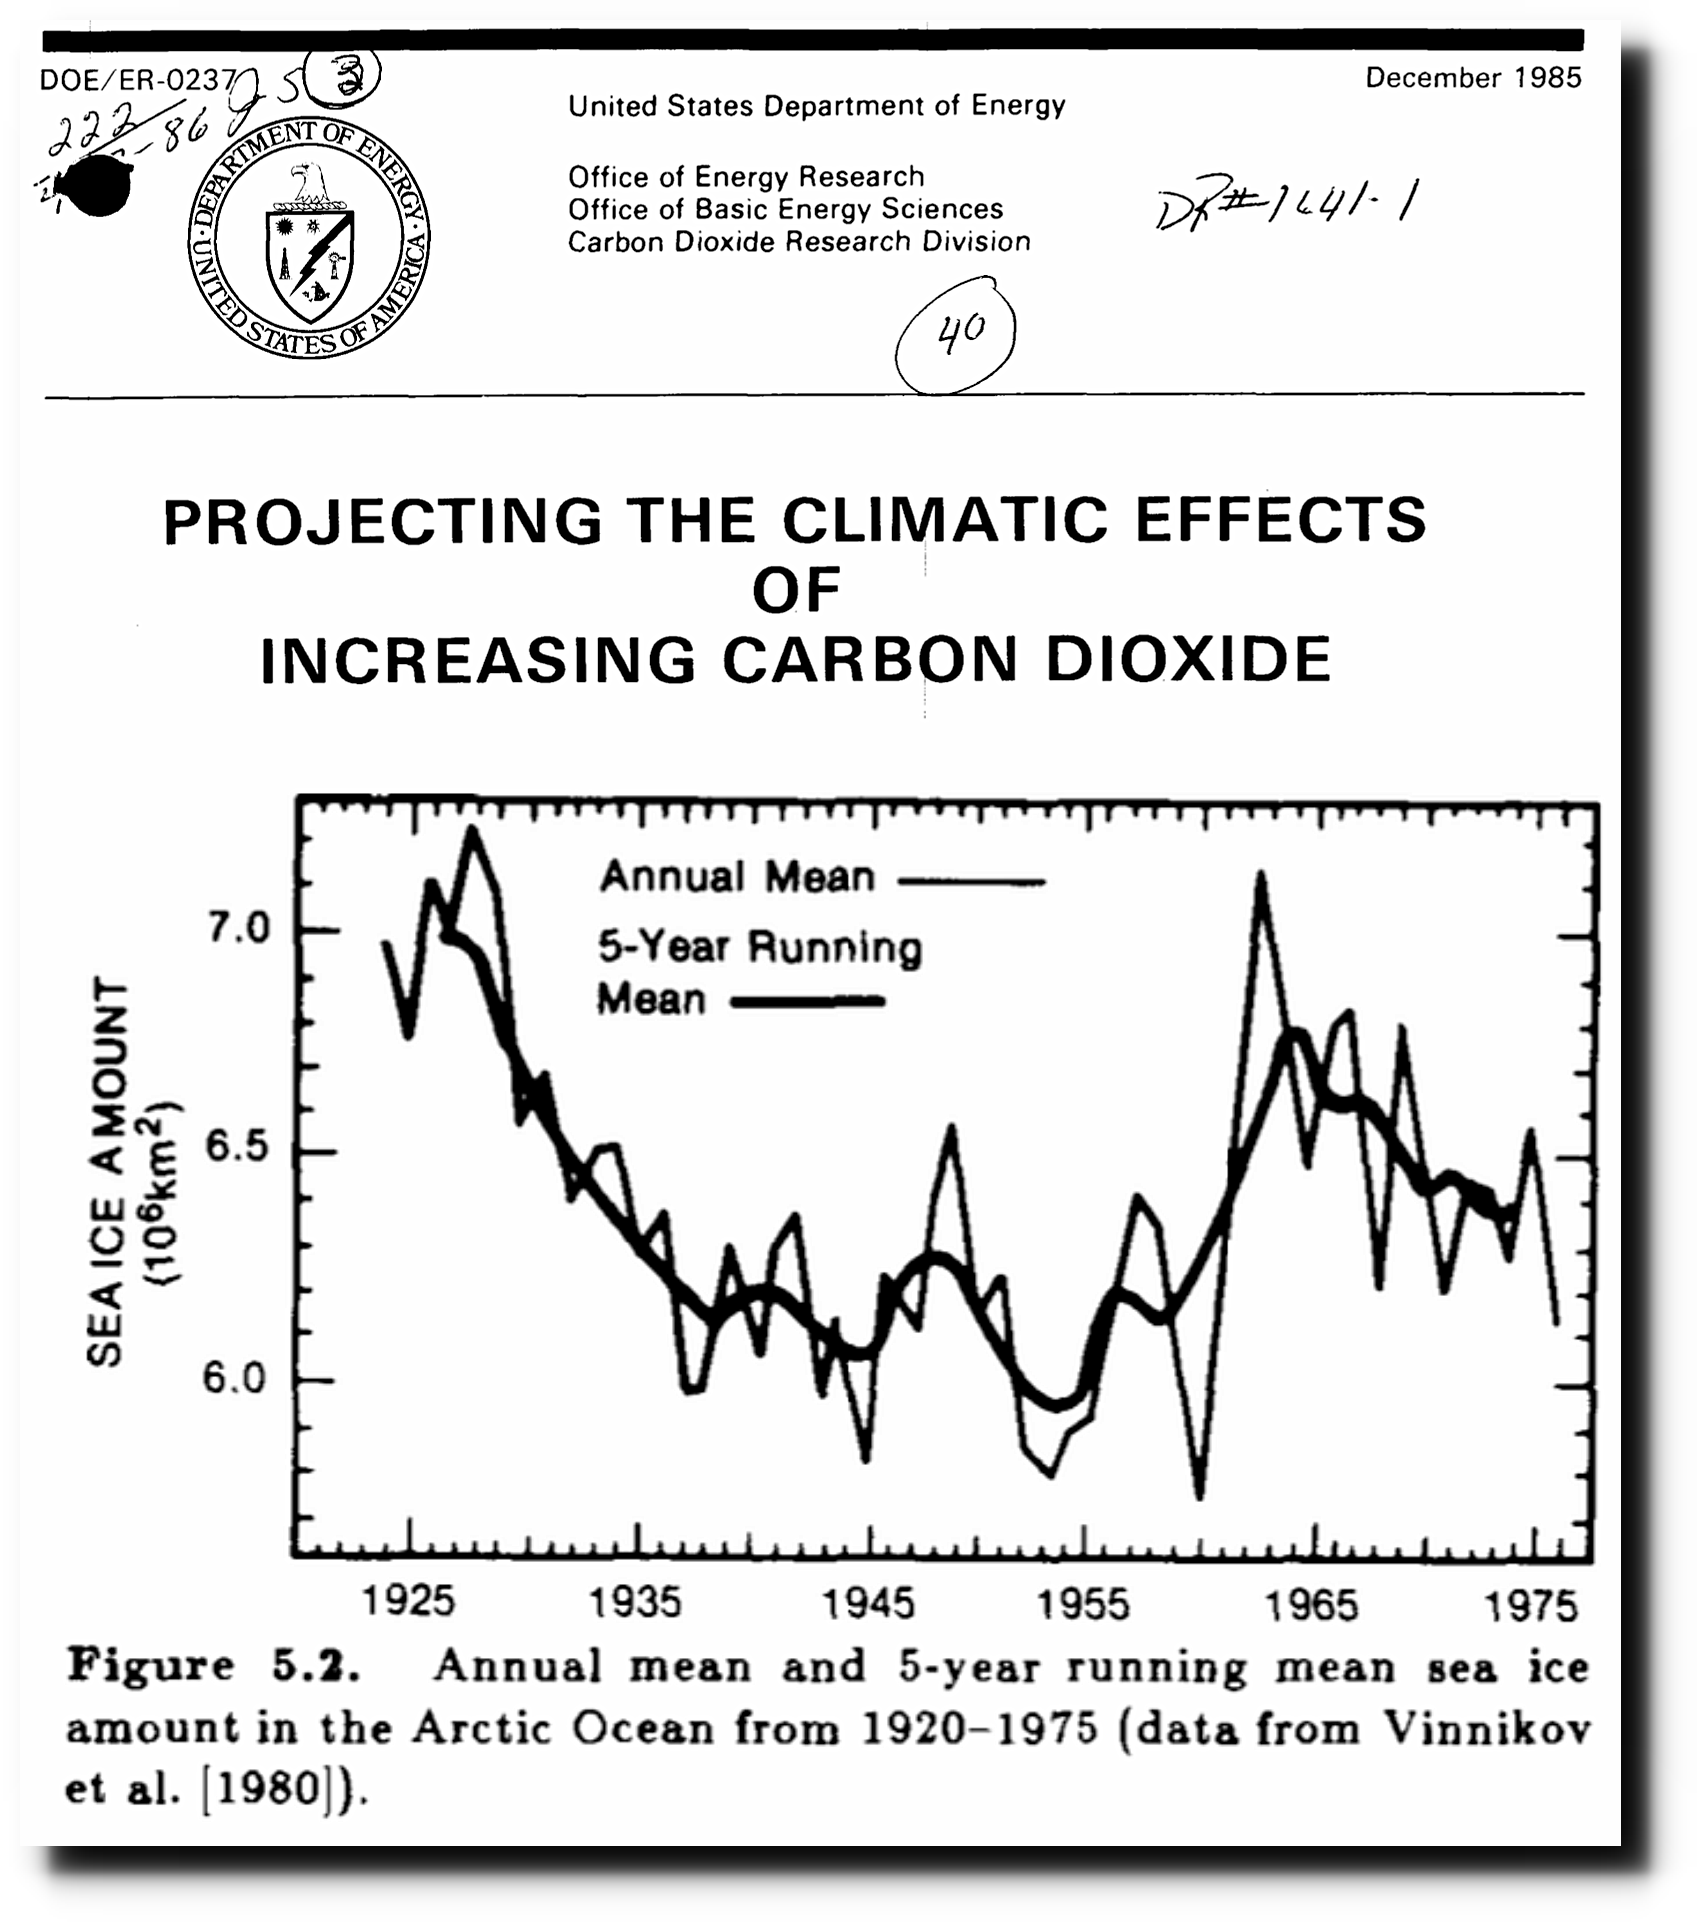
In 1985 the DOE showed a 15% decline in Arctic sea ice area from 1925 to 1955, which is missing in the NOAA graph.
Projecting the climatic effects of increasing carbon dioxide (Technical Report) | SciTech Connect
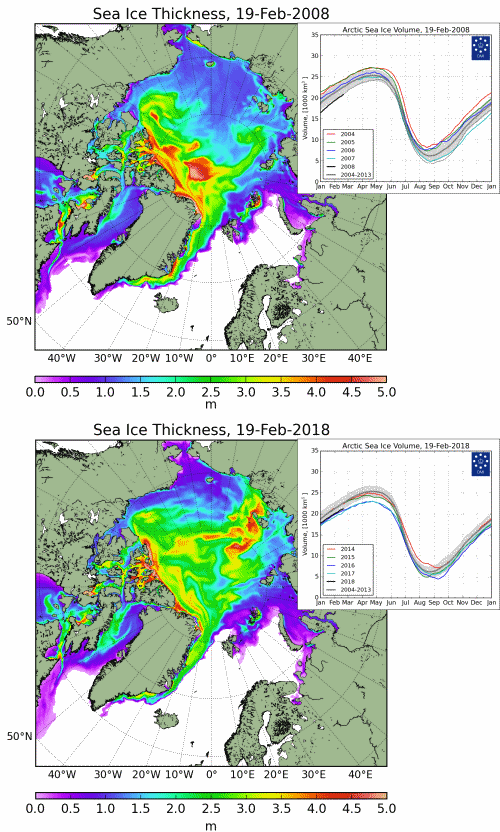
There has been a large increase in Arctic ice thickness and volume over the past decade.
2008 2018
Climate scientists simply make facts up, and the useful idiots in the press happily eat them up without doing any research or fact checking.

