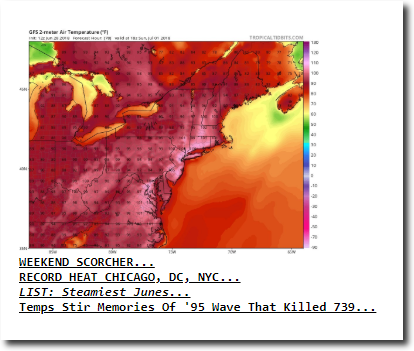
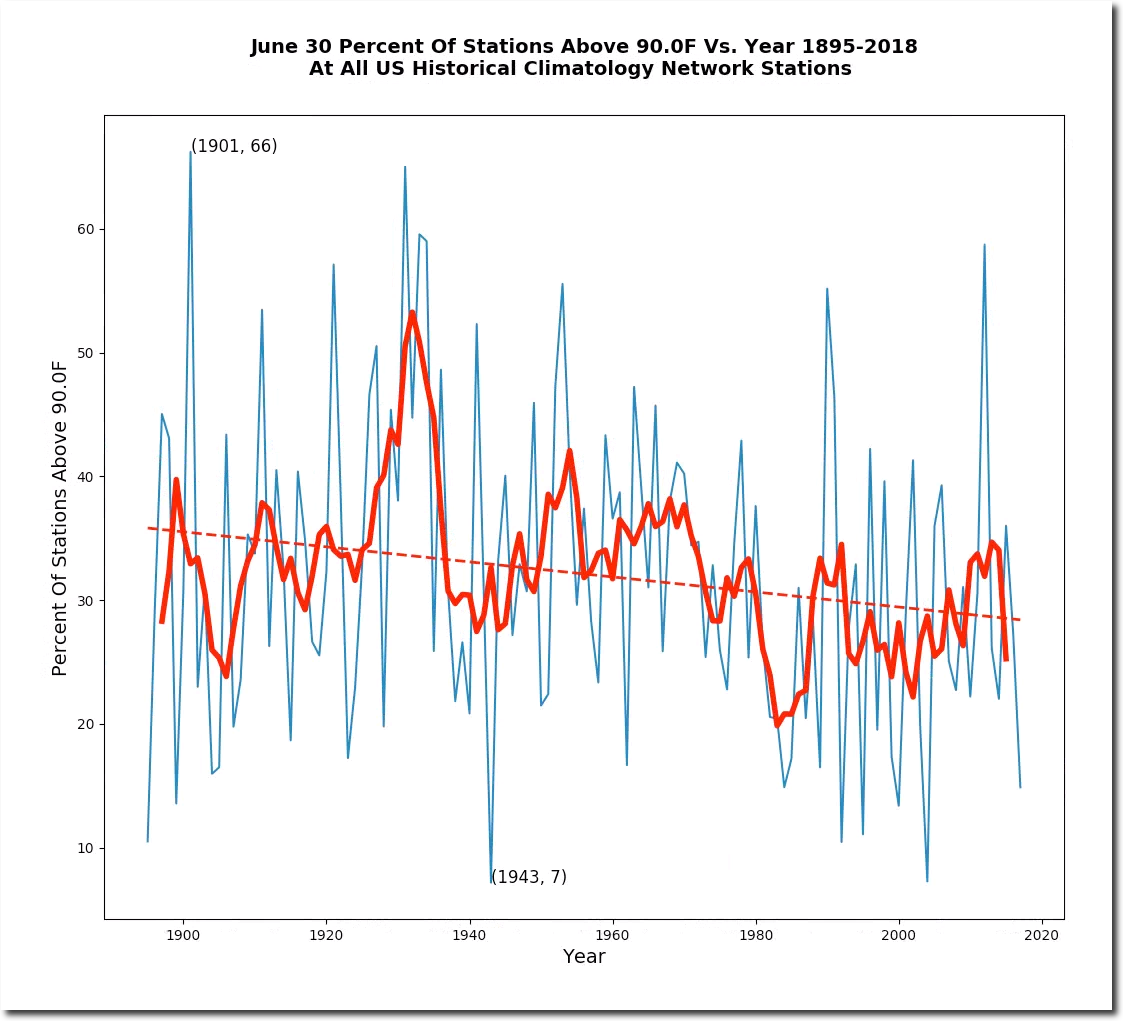
Drudge is linking to articles claiming record heat in the East and the Midwest. As always, fake news. June 30 heat has dropped off sharply since the peak in 1901, with almost all of the coolest years coming after Hansen’s 1988 testimony to Congress.
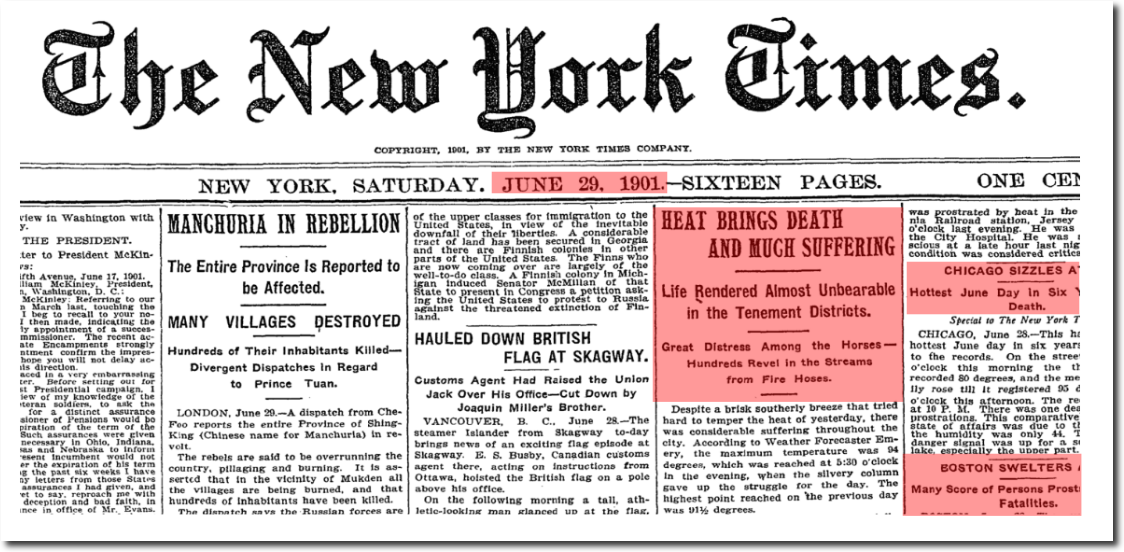
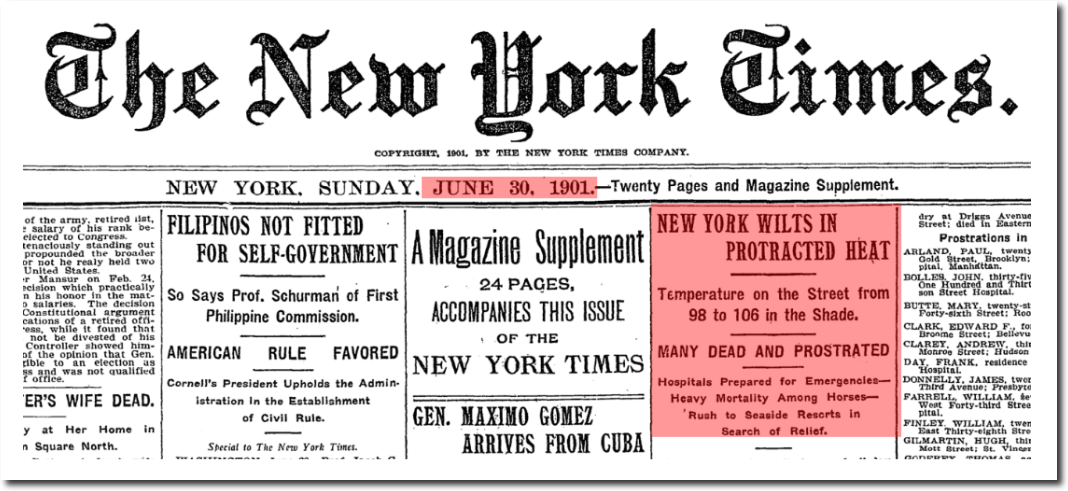
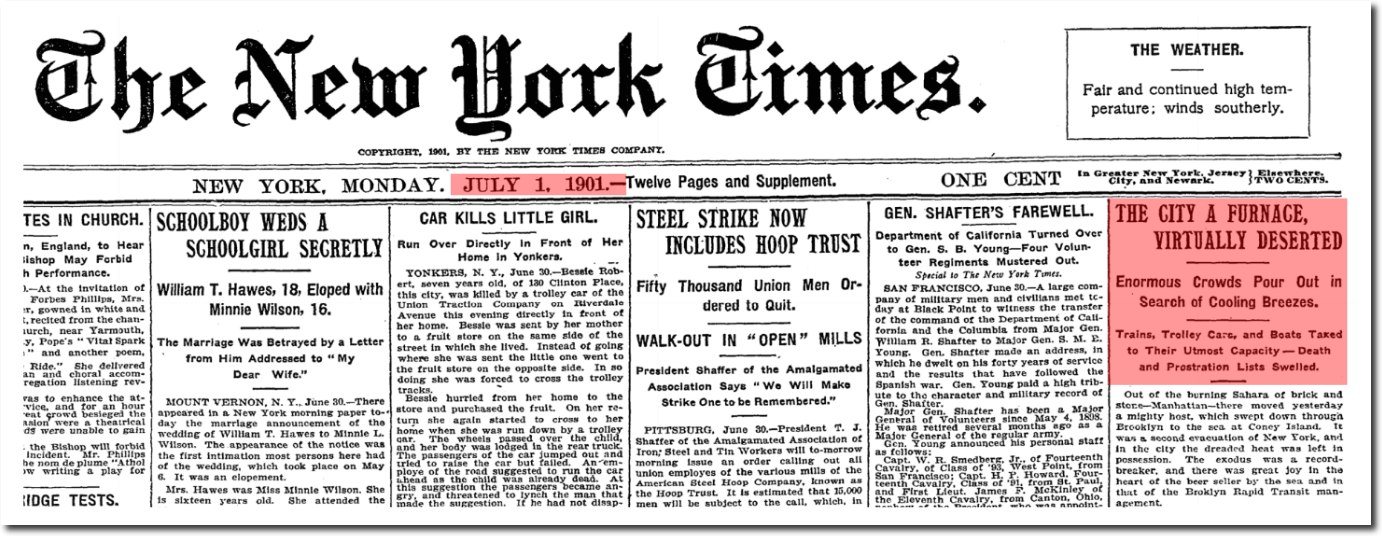
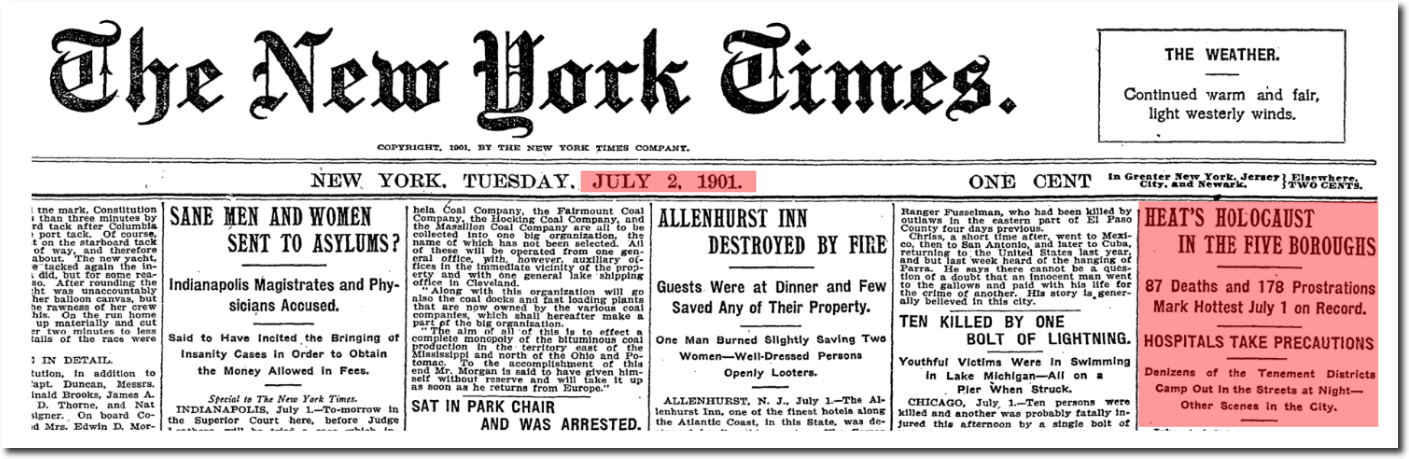
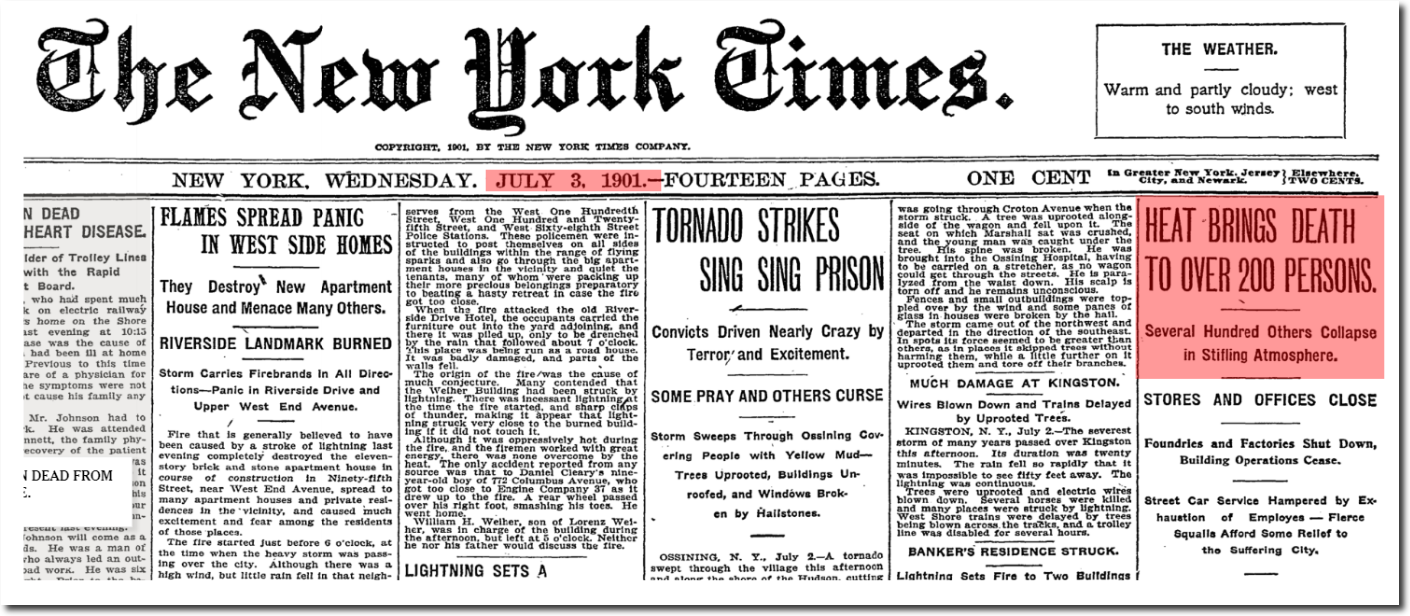
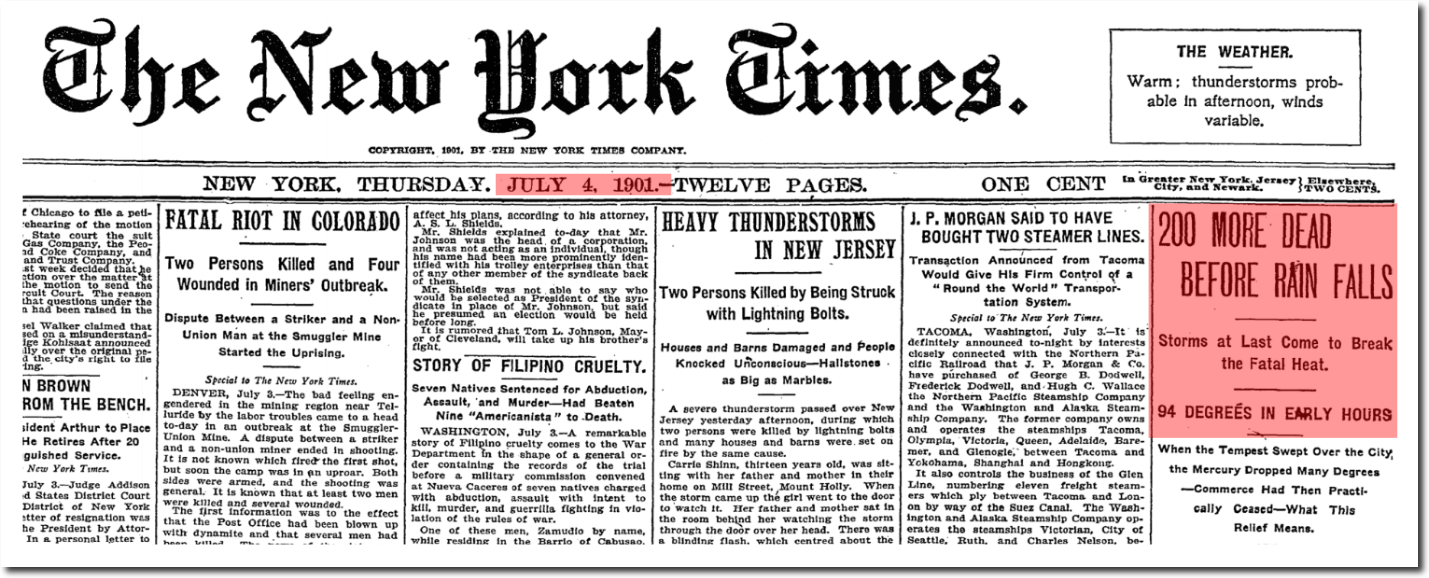
New York isn’t forecast to have any 100 degree days this week, but this week in 1901 temperatures in New York were over 100 degrees on several days, and hundreds of people were dying on the streets. On June 29, 1936 – Indiana was 111 degrees – the first of many days over 110 degrees that summer.
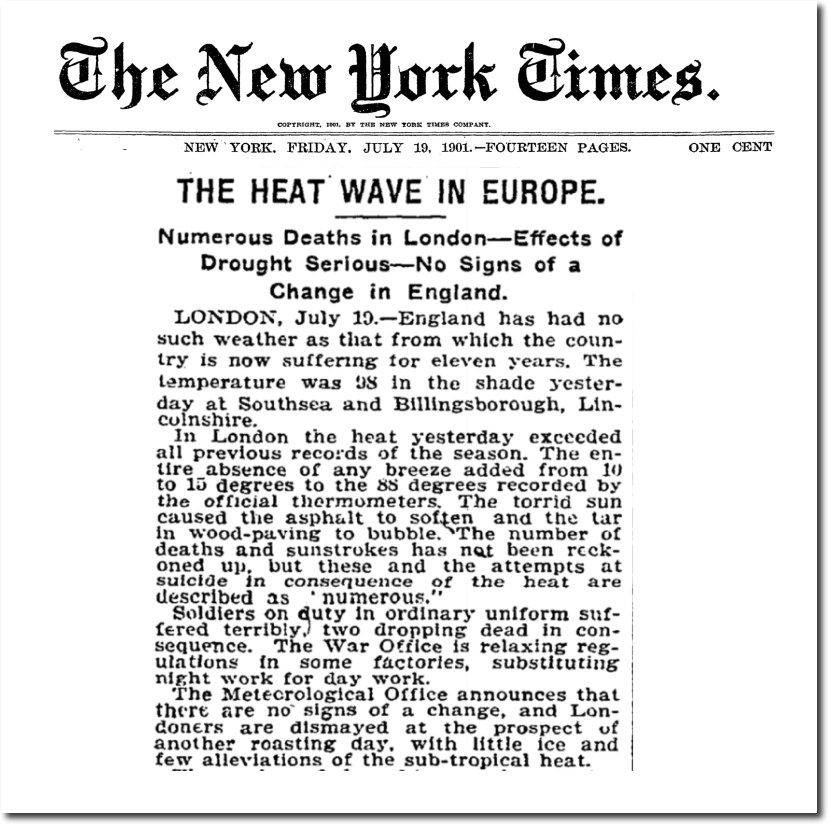
Later in July 1901, the heatwave expanded to Europe
And continued into August.
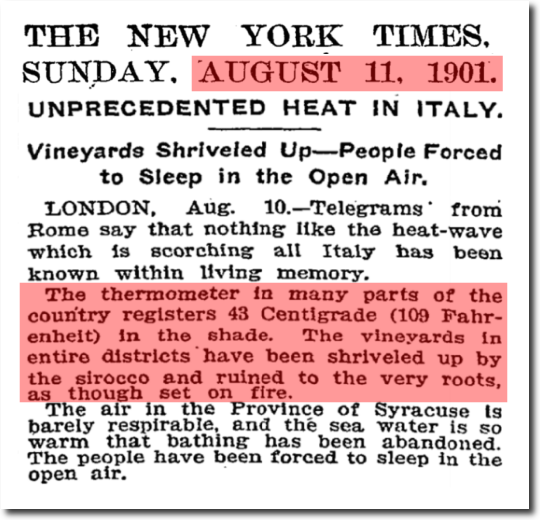
UNPRECEDENTED HEAT IN ITALY.; Vineyards Shriveled Up — People Forced to Sleep in the Open Air.
Climate alarmism depends on a lack of knowledge of history, combined with a press corps willing to print fake news. Cold and rainy in Boulder right now, and the greenest I have ever seen it at the end of June.
Models have been predicting up to 105 F for this week for NYC. Joe Bastardi was laughing at that and has been keeping track of the model predicted temp and the actual for each day this week. So far this week actual temp for NYC has run 3 to 10 deg F, below the model forecast. He covers it up to the current time in this weeks Saturday Summary which is available now.
I listened to Joe’s Weekend update… that summary is scathing of the inaccuracy of the US Model. It seems that it does not account for onshore breezes, you know, WIND.
Click bait, the death of journalism. All headlines and zero substance.
Well, let’s see how their “record heat” turned out for them yesterday,
Chicago Midway was 95 yesterday. All time record is 109.
NYC was 93 yesterday. All time record is 106.
DC was 91 yesterday. All time record is 106.
I would describe this as a garden variety summer heatwave.
But, but … It is the longest heatwave since at least 2016 according to Accuweather. Oh, the horrors! We are all going to fry.
Here near Anderson, IN it got up to 92 F today. Average high for this day is 84 F and the record 97 F set in 1954. Once again our lows at night have been much higher than average because we had a good amount of precipitation just before the weather warmed. Average low for this day is 64 F but forecast low for tonight is 72 F. So as I mentioned before the high humidity is skewing the anomaly maps to look worse than they actually are.
I trimmed my lilac bushes this morning. I have 6 of them across the front of the house and another three down the south side. Then I trimmed and mowed my acre and then grilled some steaks for dinner. Kept myself hydrated so there were no ill effects though I wore some fairly short shorts to get some sun on my lily white thighs while doing that yard work and it is now becoming apparent I got a little bit too much.
It was 109 degrees at Seymour, Indiana on June 30, 1936.
Seymour is about 90 miles south of me as the crow flies. Drive by it on I-65 quite frequently since It’s right off I-65. A trucker can’t miss it since that is where the weigh station is for the North bound side. The temperature data I stated above was from Accuweather. A difference of 17 deg, F in about 90 miles is considerable in these flat lands as long as the skies are pretty clear with no fronts coming in. I presume AccuWeather is using historical temp data that has been adjusted then? That is quite a difference!
A cold front moved through that day. It was in the 60’s in northern Indiana.
Yes.
That’s called summer.
“Cold and rainy in Boulder right now, and the greenest I have ever seen it at the end of June.”
Carbon dioxide. Making America Green Again.
I just had to change into warmer clothing, 61F at my house outside of Boulder at the moment. I don’t think I’ll have to protect my plants tonight though.
We are at 54F.
LOL! Just love this satire piece from Rowan Dean of Sky News, Australia.
Australia’s near record-breaking cold weather. However, according to Australia’s ABC weather reporter, we should not panic but we should still hold Global Warming dear to our hearts. Nevermind the BoM (Bureau of Meteorology) predicted a well above normal warmer winter with their (CO2) modelling only a few months ago. Humbug!
https://www.facebook.com/SkyNewsAustralia/videos/10155596610581728/
Looks like colder weather is coming to Western AU later this week.
In 1901 in New York, it wasn’t just the heat
I’ve read that vacant lots were piled 10-feet deep with horse manure and that the swarms of flies were overwhelming.
No air conditioning, almost no ventilation. No wonder many died
Thank human ingenuity for devising abundant, reliable, cheap fossil-fueled electricity!
The media is turning America into the softest, weakest people in the world.
I am in Riyadh, Saudi Arabia for business this week and below is the 14 day forecast…Every day would shut down the Eastern Seaboard, but here we have traffic jams, busy markets and life goes on as normal.
Fake Weather now.
Drudge can be a bit ignorant sometimes.
The fact that you didn’t post your source for datas prevent me to spread that link.
If you don’t know what the United States Historical Climatology network is, then you have no business weighing in with your ignorance.
Here is the SOFTWARE he developed that makes those charts work, it is free courtesy of Tony Heller:
GHCN Software
https://realclimatescience.com/ghcn-software/
I recently caught Weather Underground on its website defaulting to the highest reading weather site here in Yuma County, AZ. While even the WU’s iPhone app said it was 104 degrees at the official MCAS site, the Weather Underground page said it was 108 degrees at a secondary site. It was the only instrument site reading that high. The MCAS station wasn’t even listed online. I will watch this to see if they will continue to operate this way. I only have their app to compare with Weatherbug, which uses a different model.