Essentially all government temperature graphs are fraudulent, but none more so than the NOAA Climate Extremes Index (CEI) – which shows summer maximum temperatures getting hotter and passing the heat of the 1930’s.
The sum of (a) percentage of the United States with maximum temperatures much below normal and (b) percentage of the United States with maximum temperatures much above normal.
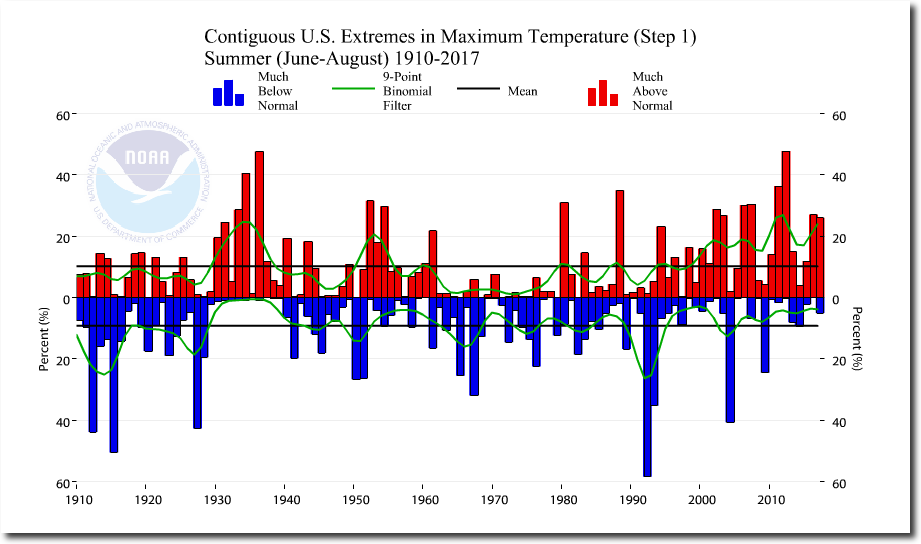
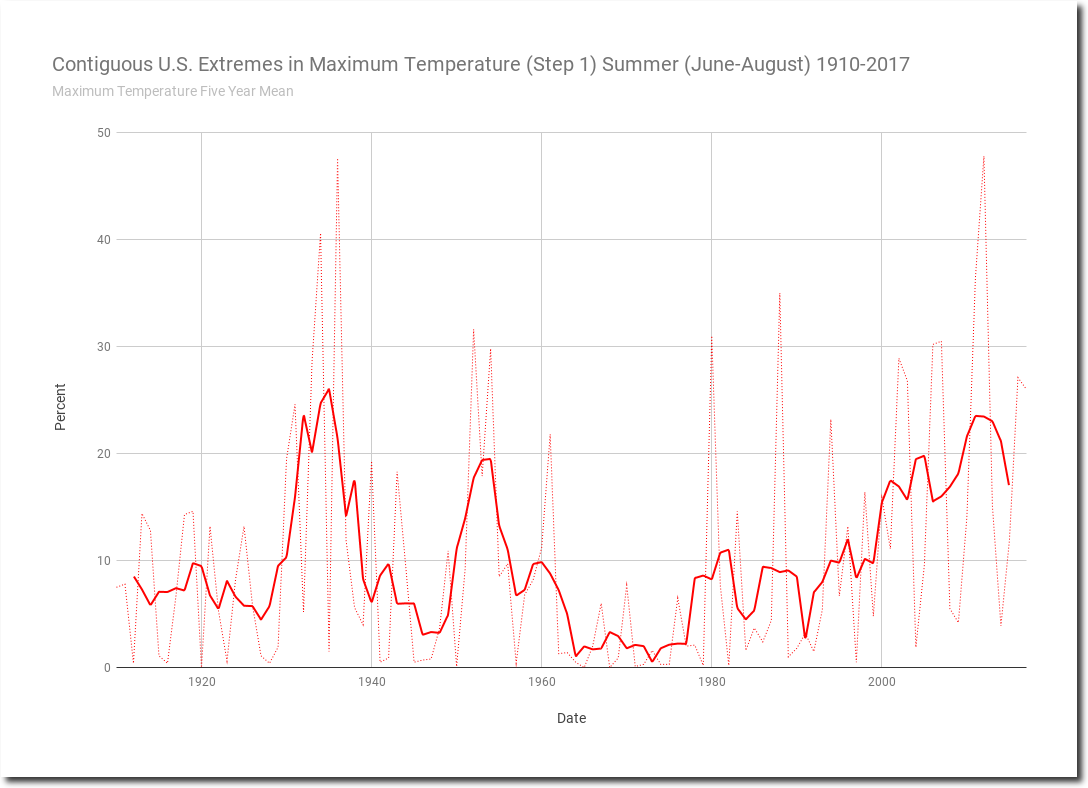
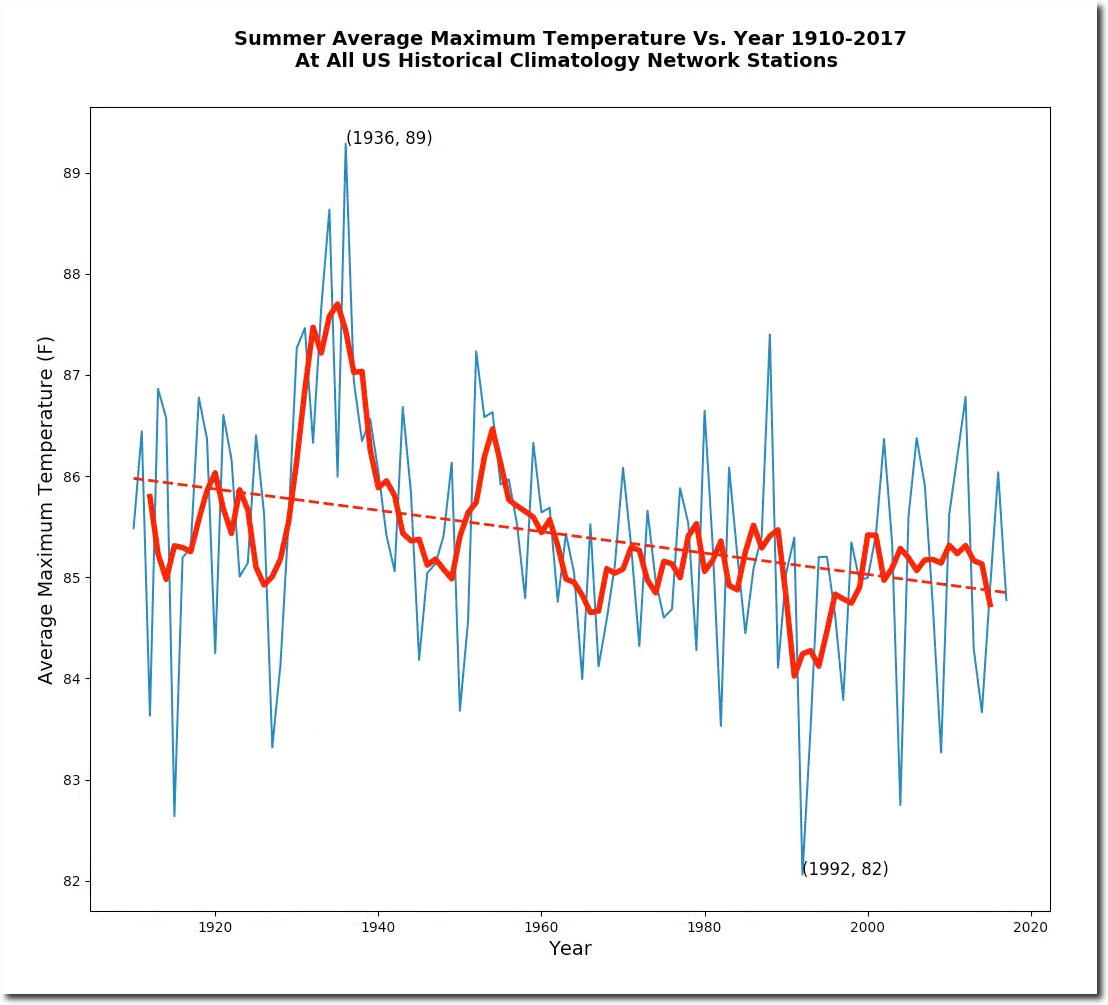
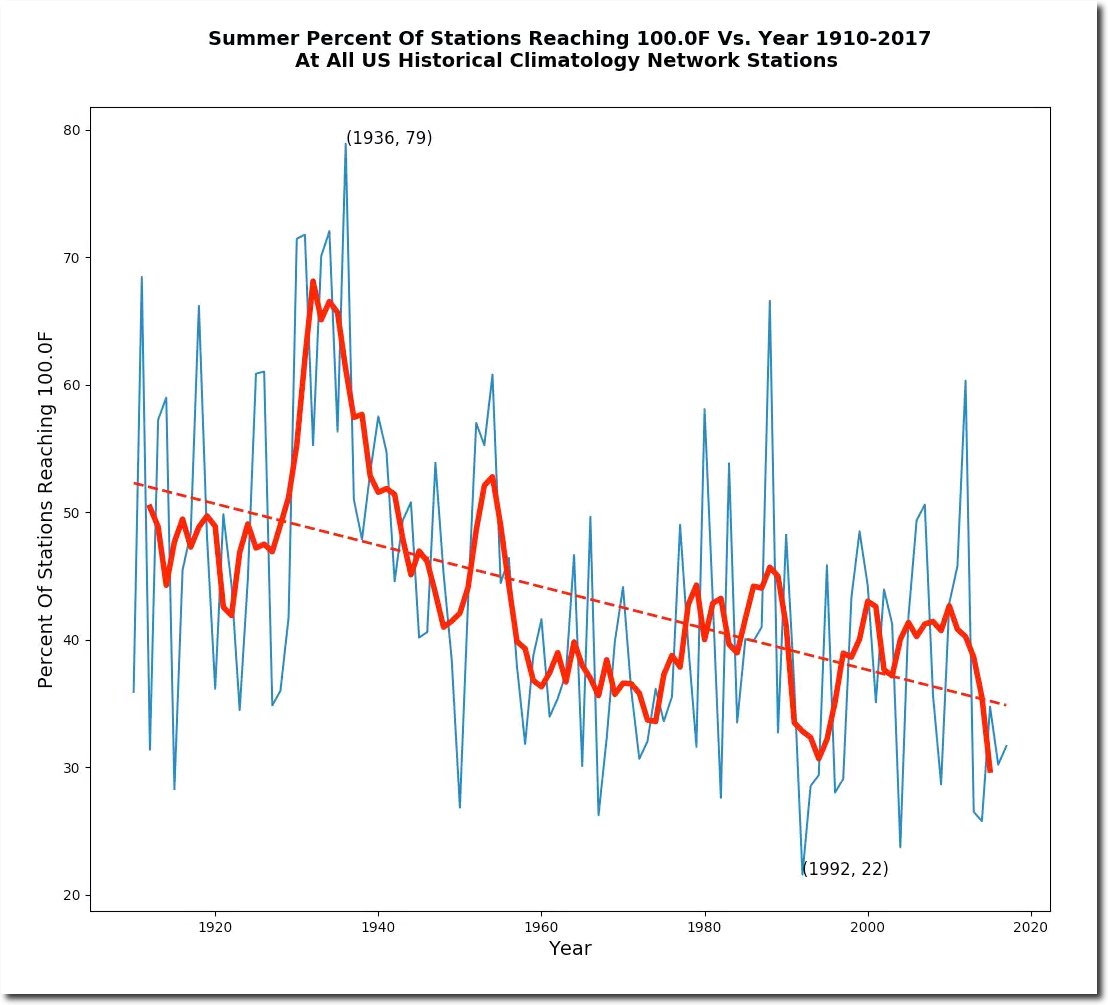
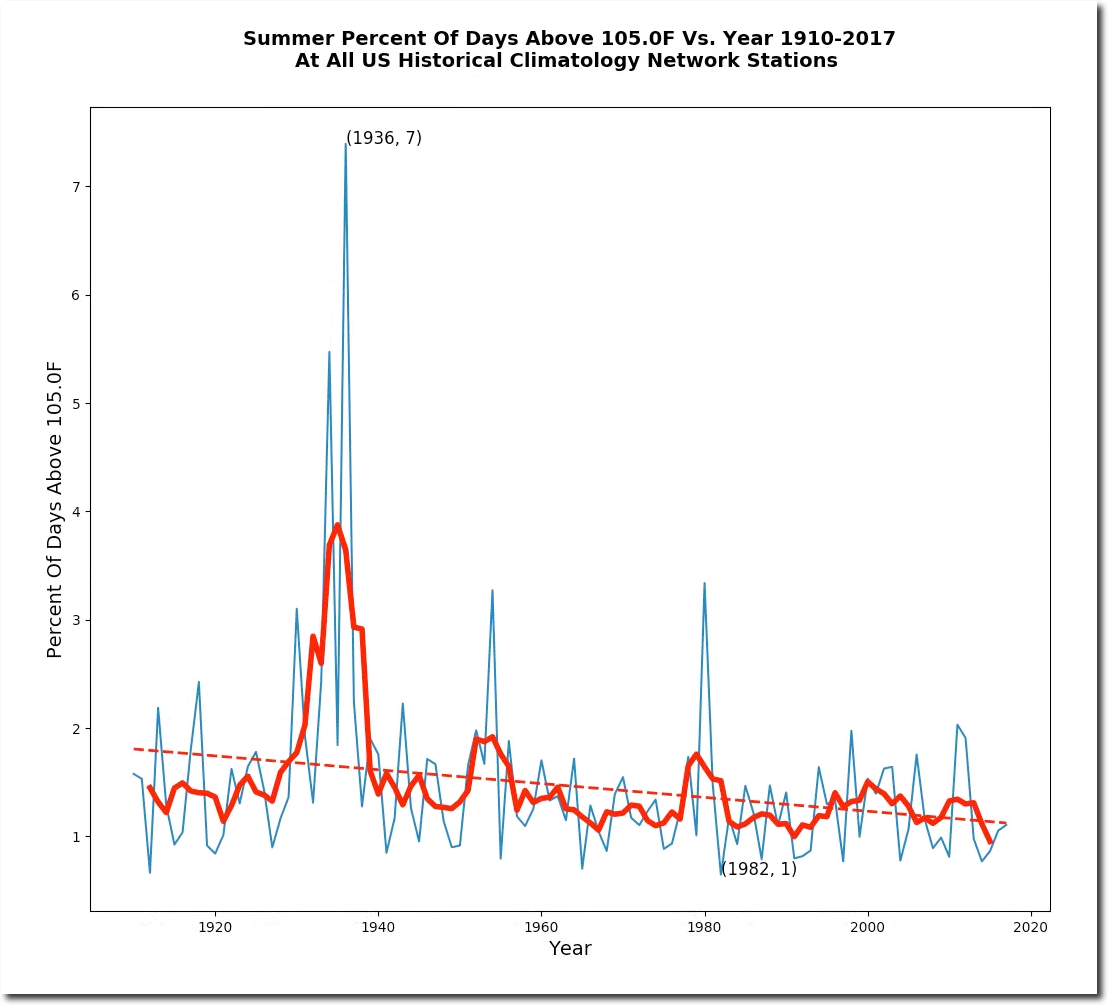
There is no basis for the NOAA claims – summer maximum temperatures have plummeted in the US to record or near record lows. The shape (but not the magnitude) of the CEI graphs is approximately correct prior to 1960, but after 1960 the NOAA data is completely fraudulent and has no basis in reality.

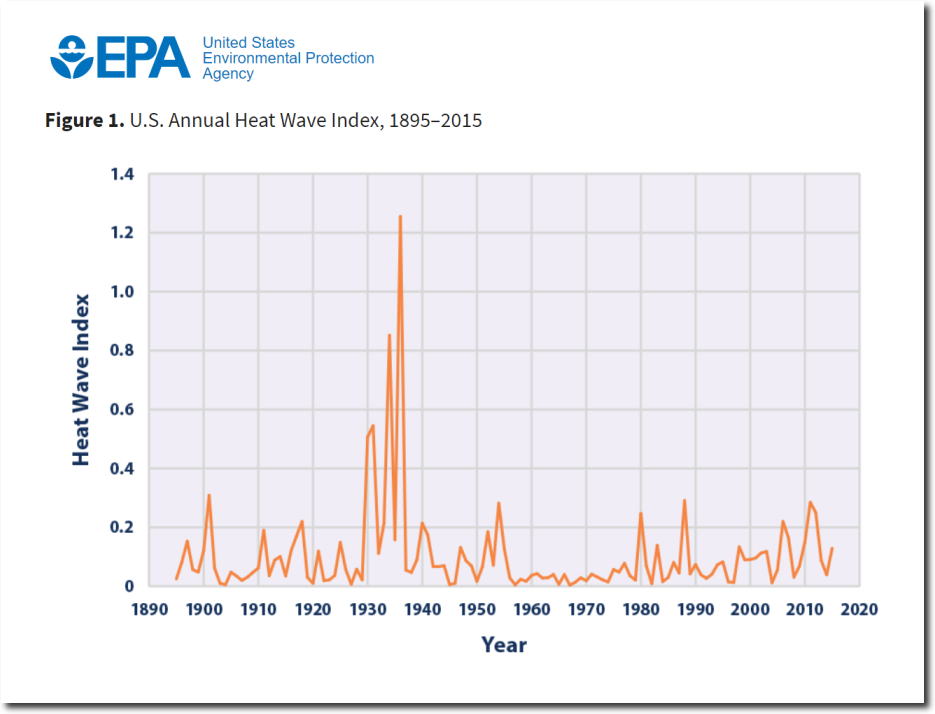
Most government climate fraudsters at least make some attempt at plausible deniability, but not so with NOAA’s climate extremes index. Even some people at the EPA seem to understand that summers in the 1930’s were much hotter.