Overwhelming Evidence Of Collusion

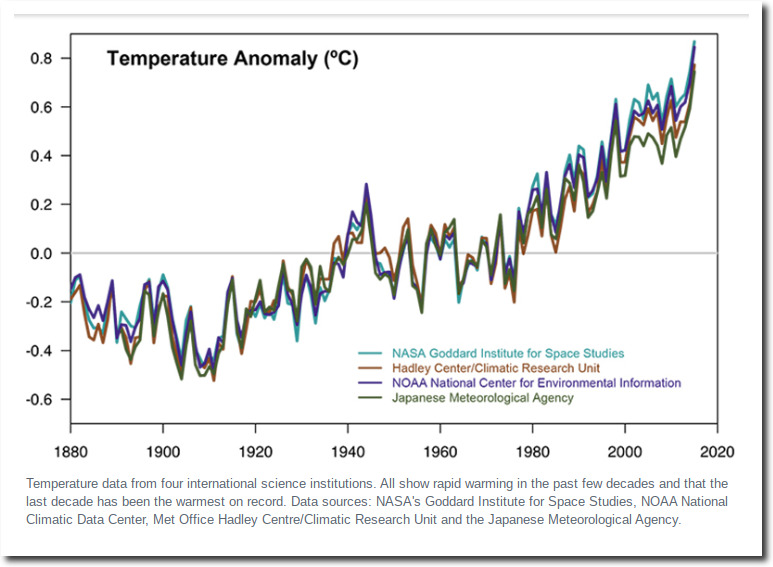
NASA prominently features this graph of “global temperature” showing very close agreement between different data sets by different government agencies since 1880.

NASA: Climate Change and Global Warming

I am going to show you the evidence now why the only way this could have happened is via collusion between the agencies. There is not enough data available to generate a coherent global long-term temperature record, much less have close agreement by independent agencies.

In 1978, the New York Times reported there was too little temperature data from the Southern Hemisphere to draw any reliable conclusions.

International Team of Specialists Finds No End in Sight to 30‐Year Cooling Trend in Northern Hemisphere

New York Times, January 5, 1978

The report, prepared by German, Japanese and American specialists, appears in the Dec. 15 issue of Nature, the British journal. The findings indicate that from 1950 to 1975 the cooling, per decade, of most climate indexes in the Northern Hemisphere was from 0.1 to 0.2 degrees Celsius, roughly 0.2 to 0.4 degrees Fahrenheit.

Data from the Southern Hemisphere, particularly south of latitude 30 south, are so meager that reliable conclusions are not possible, the report says. The 30th parallel of south latitude passes through South Africa, Chile and southern Australia. The cooling trend seems to‐extend at least part way into the Southern Hemisphere but there have been indications of warming at high southern latitudes.

https://www.nytimes.com/1978/01/05/archives/international-team-of-specialists-finds-no-end-in-sight-to-30year.html

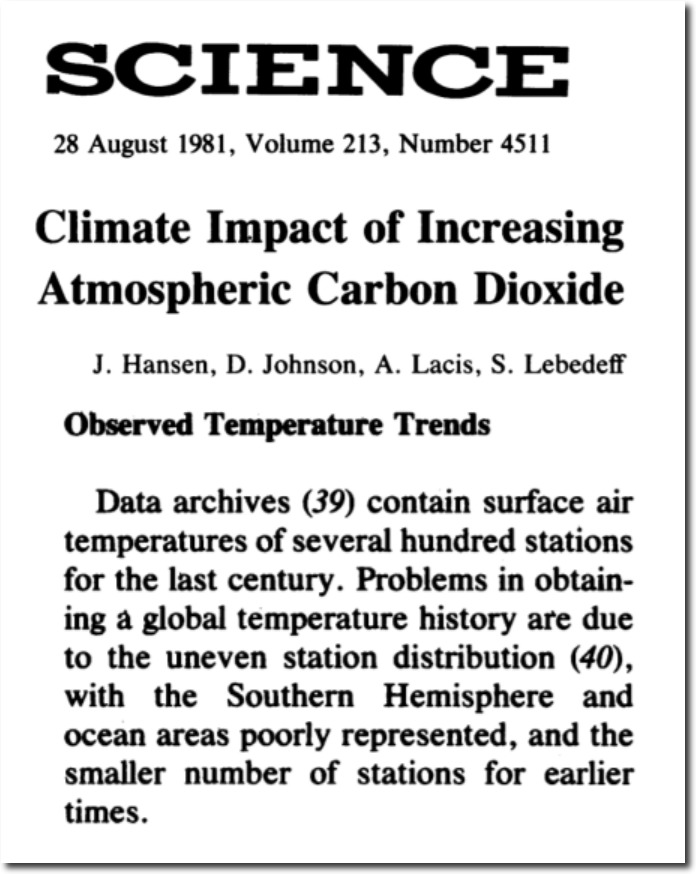
In 1981, NASA’s James Hansen reported the same thing.  There is little historical data from the Southern Hemisphere and oceans.

Climate Impact of Increasing Atmospheric Carbon Dioxide | Science

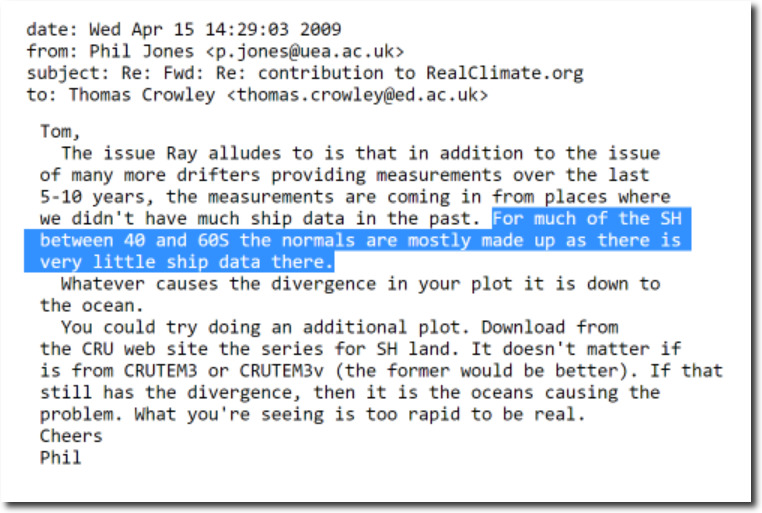
In this 2009 Climategate E-mail, Phil Jones from CRU said there was very little ship data in large areas of the Southern Hemisphere. and that the historical data in those regions was “mostly made up.”

di2.nu/foia/foia2011/mail/2729.txt

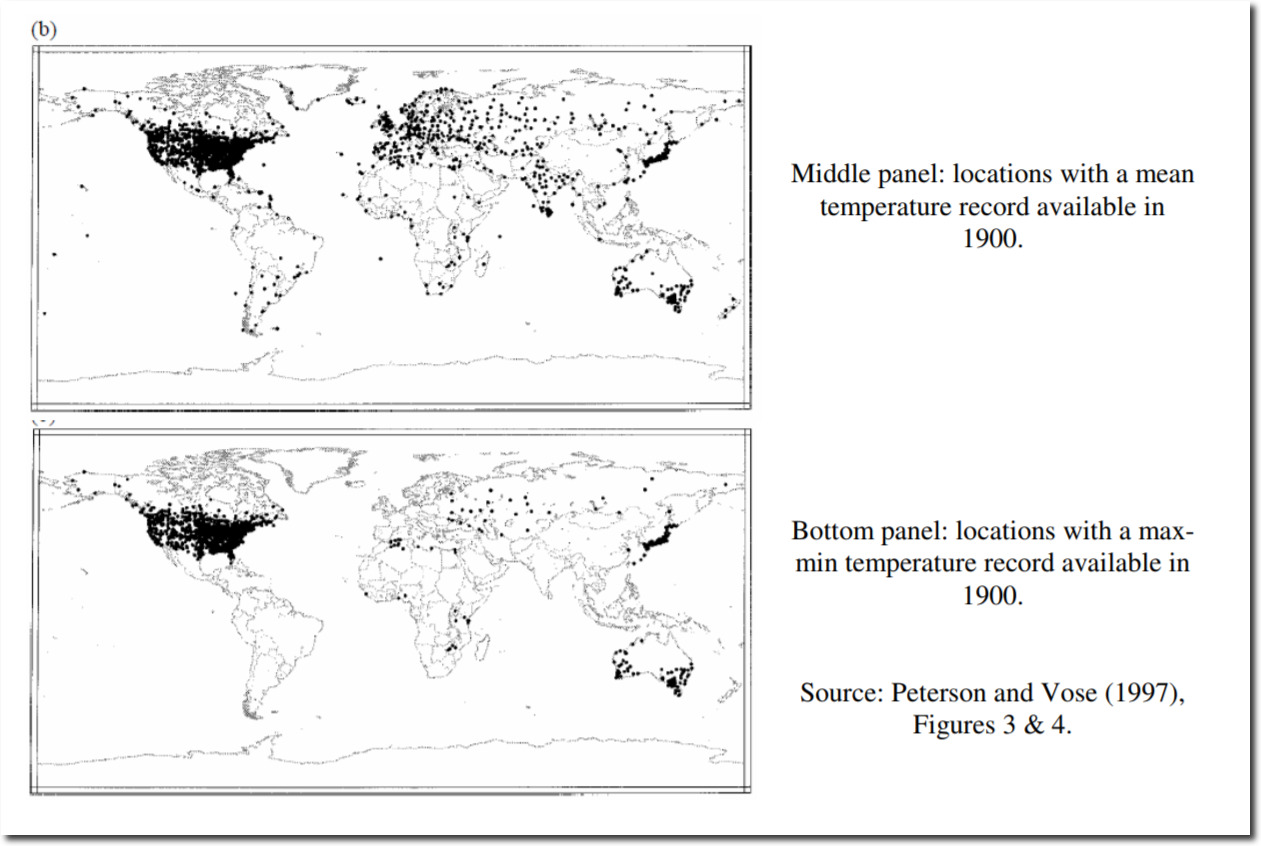
Maps from NOAA show that there was very little quality thermometer data outside of the US in the year 1900.

A Critical Review of Global Surface Temperature Data Products by Ross McKitrick :: SSRN

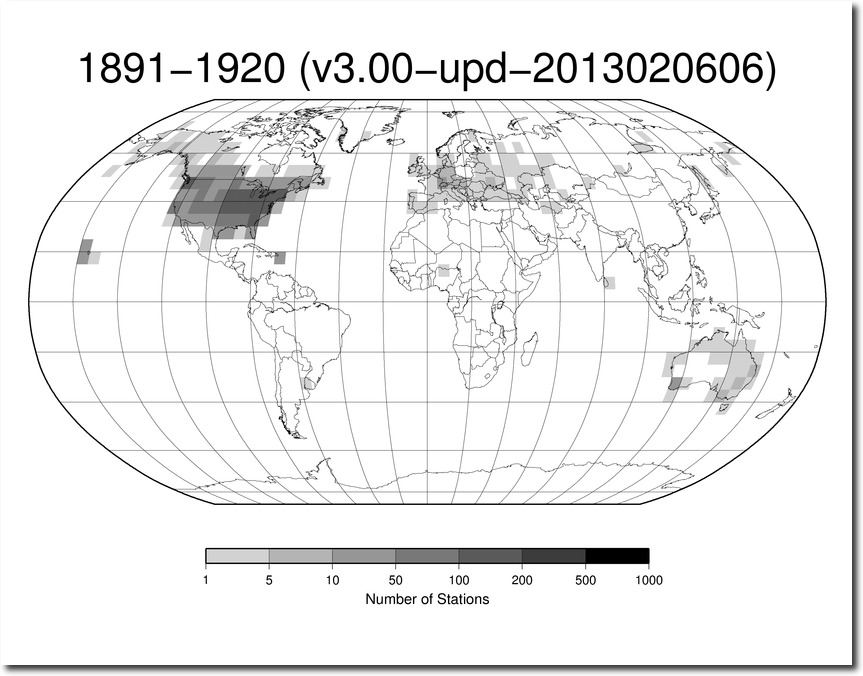
Same story in 1920. Very little quality data outside of the US, Western Europe, Japan and parts of Australia.

station-counts-1891-1920-temp.png (825×638)

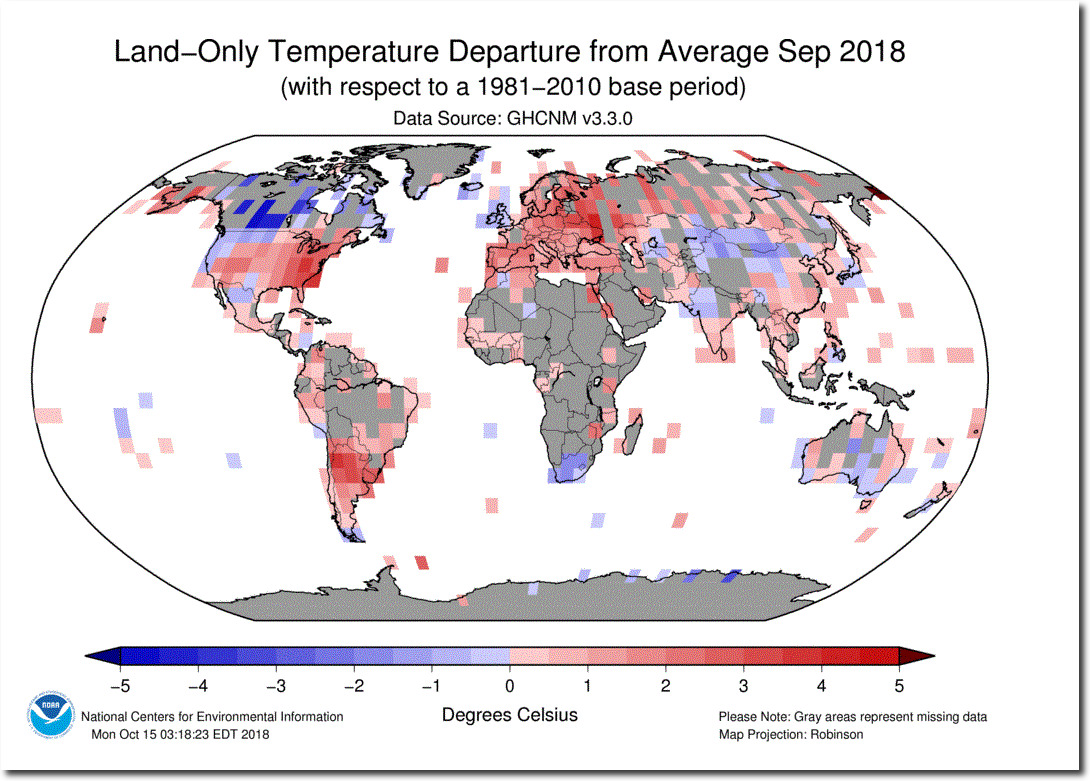
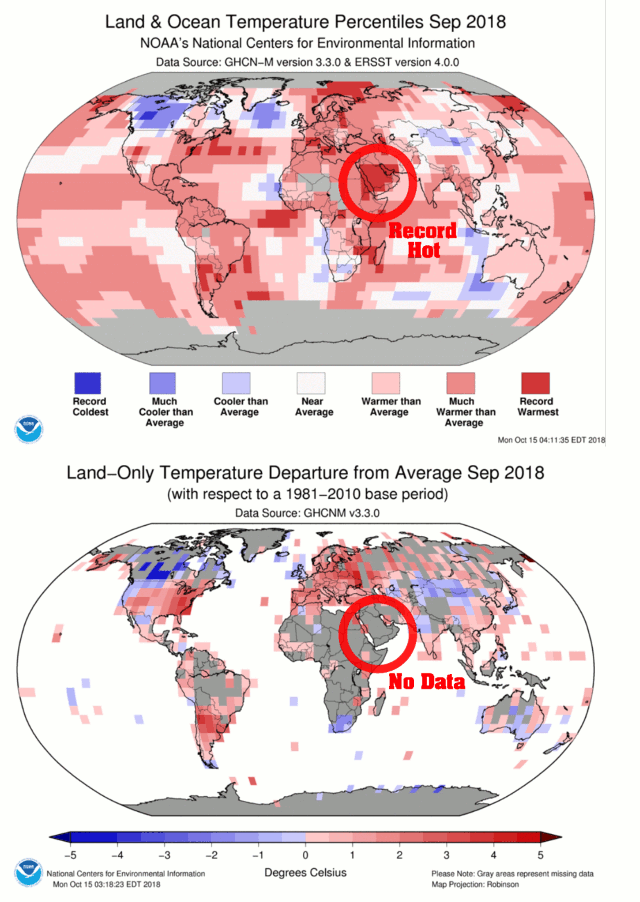
There are still very large areas of missing data, represented by gray in the NOAA map below.

201809.gif (1052×743)

However, the lack of data doesn’t stop NOAA from declaring record heat in places with no thermometer data.
Fake Data – The Basis Of Climate Science | The Deplorable Climate Science Blog

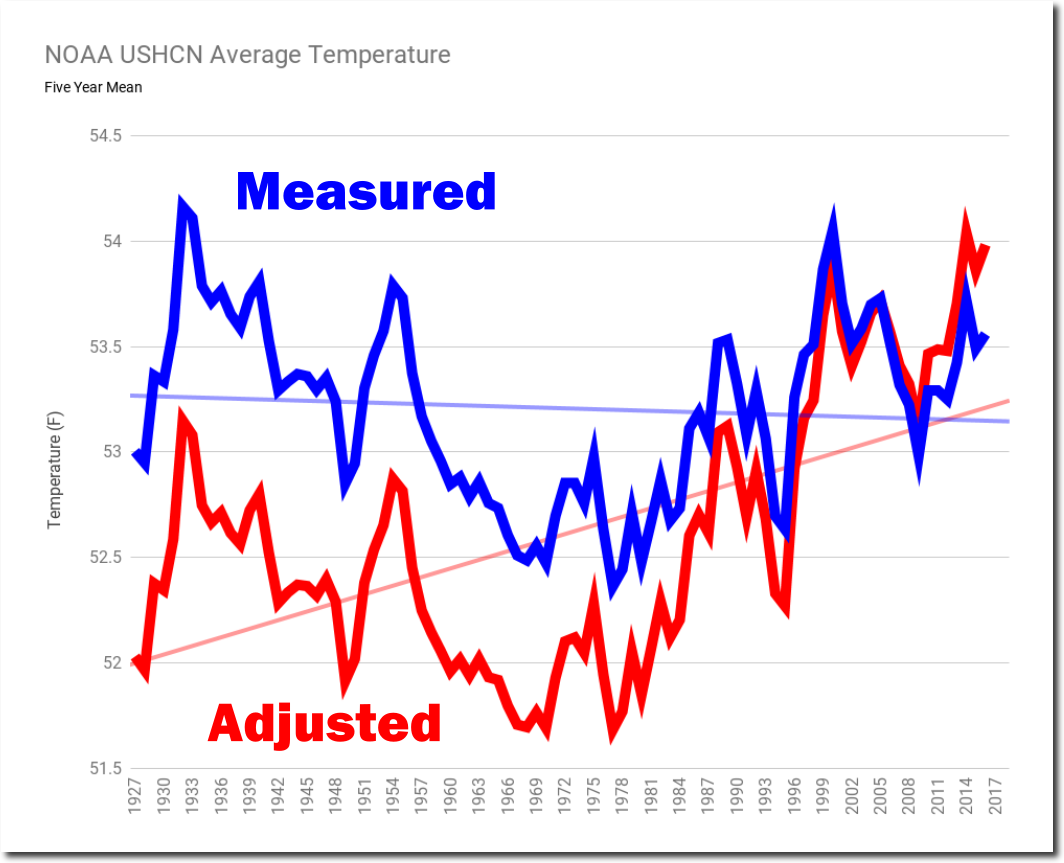
The US has the only high quality long term temperature set covering a large area in the world, and the US temperature record is massively tampered with – to turn 90 years of cooling into warming.

NOAA US Data Tampering Update | The Deplorable Climate Science Blog

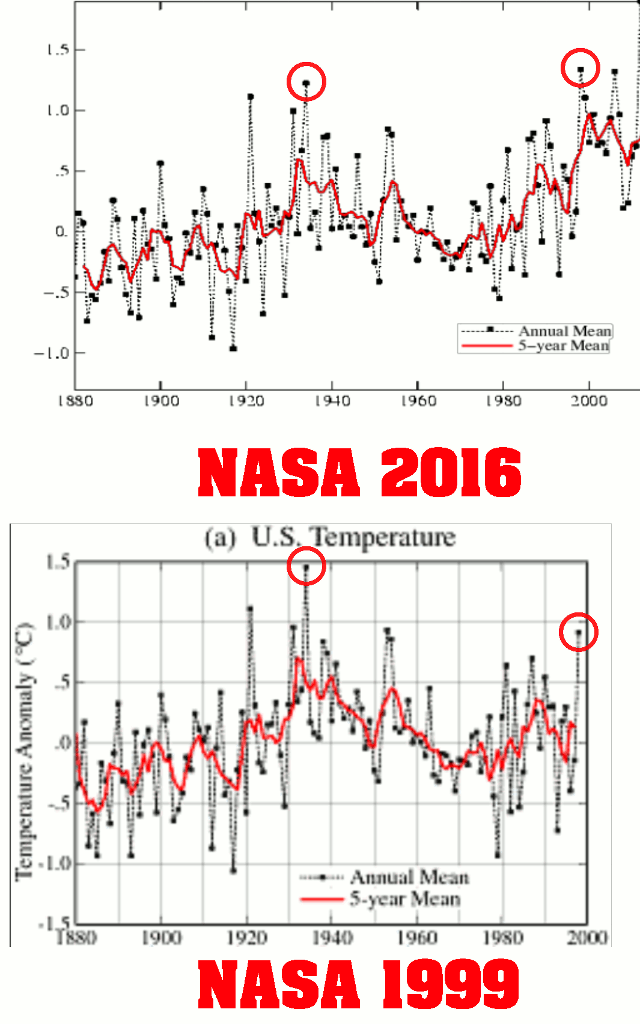
No legitimate scientist would alter data like this.  If they have theories about possible issues with the data, the correct way to handle it is to put error bars on the graph – not alter the data and present it as if it is the actual thermometer data. That is fraud, not science.  Between 1999 and 2016, NASA completely altered the shape of the US temperature graph to turn seventy years of cooling into warming.

NASA 1999   NASA 2016

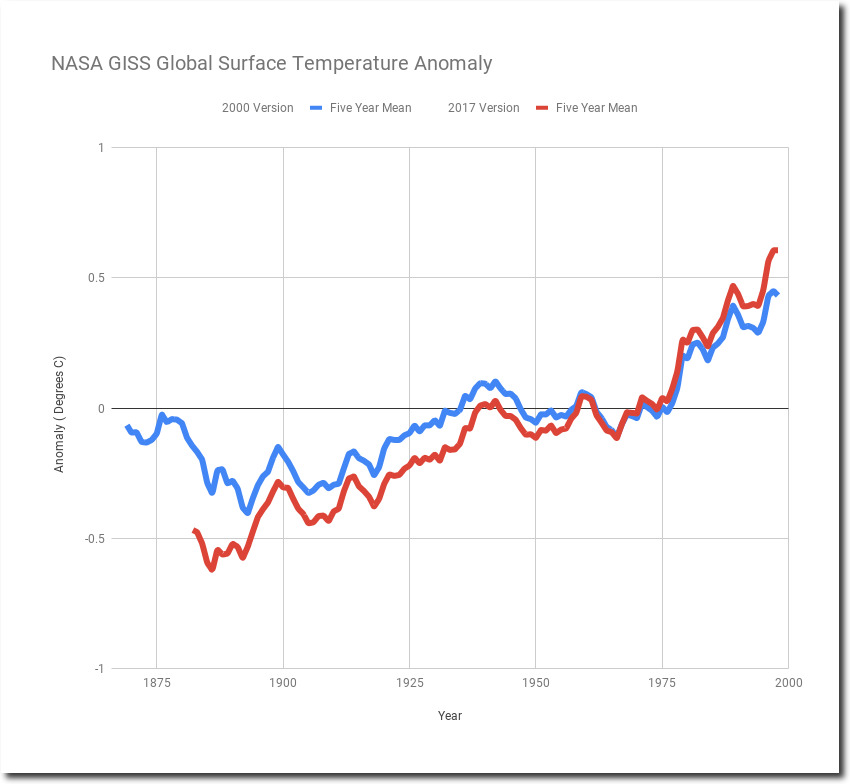
As far as global temperatures go, NASA has massively altered their own surface temperature record over the past 20 years, and have doubled pre-2000 warming.  How can four different independent agencies come up with four very similar graphs, when NASA doesn’t even agree with themselves from 20 years ago?

Spreadsheet     Data

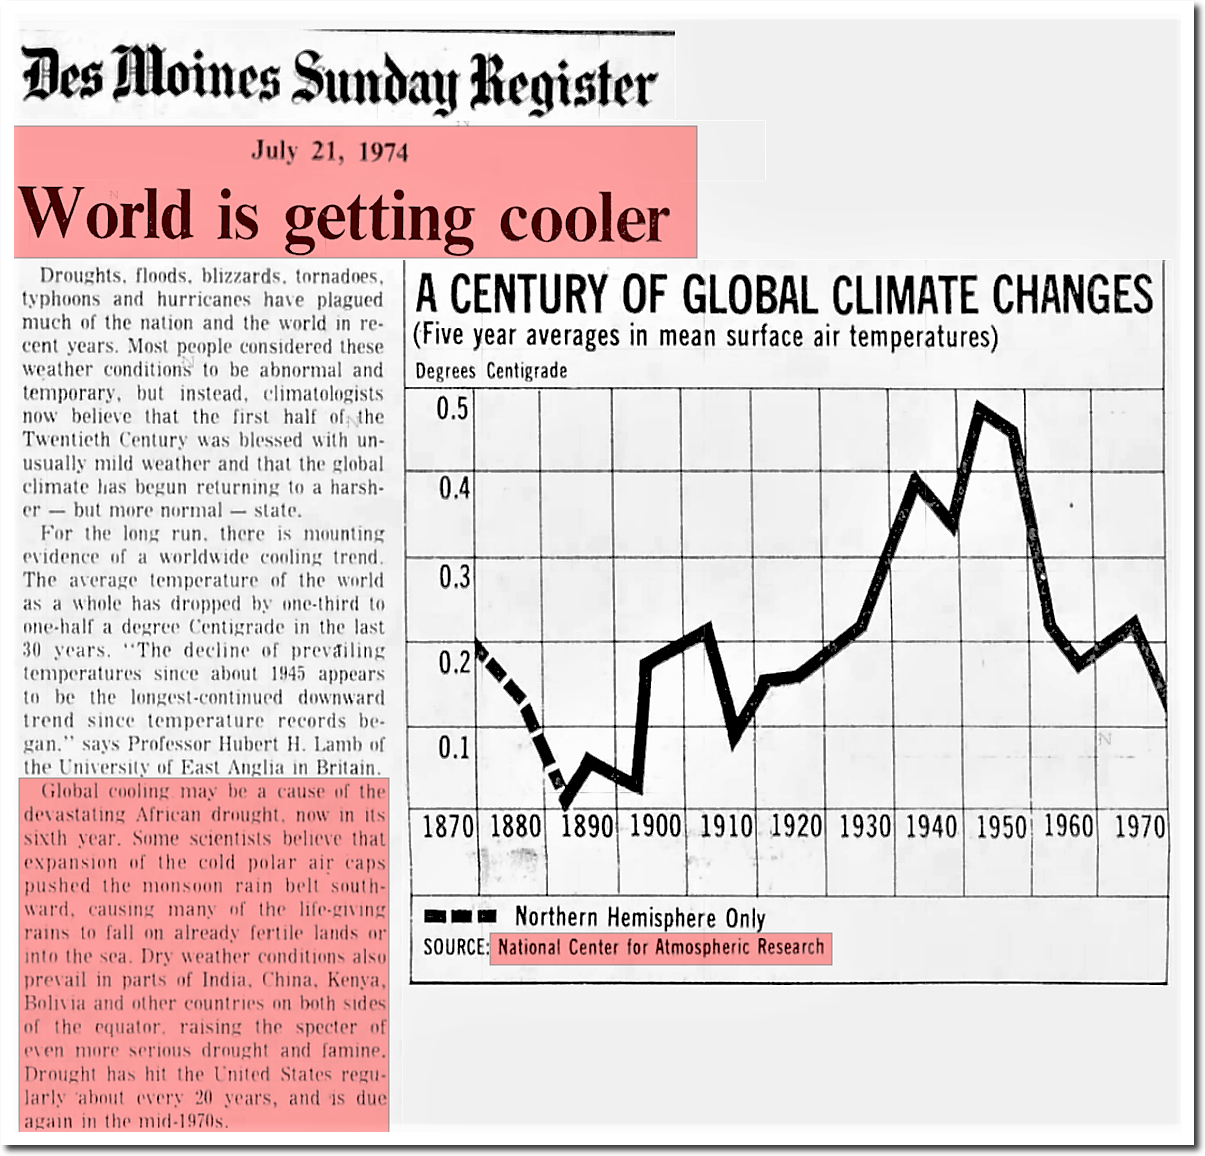
NASA surface temperature graphs have completely erased the post-1940 cooling seen in 1974 NCAR graphs.
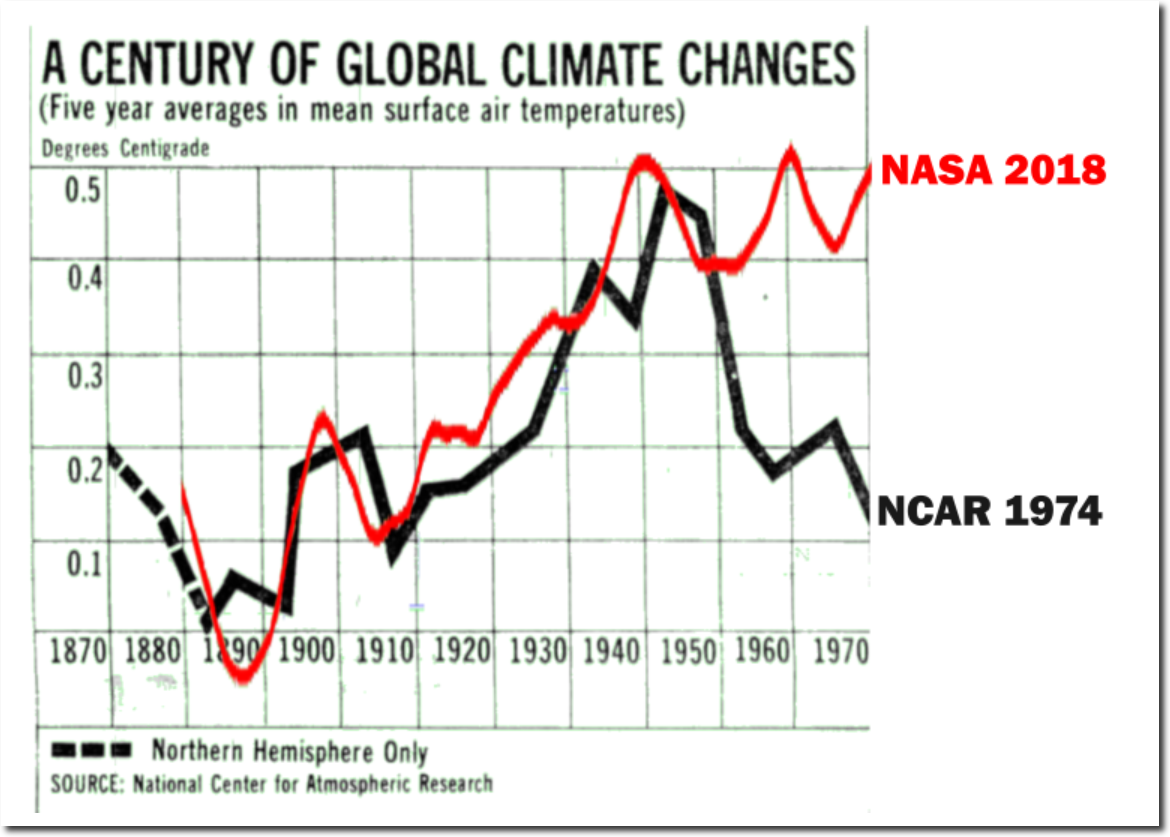
NCAR 1974      NASA 2018

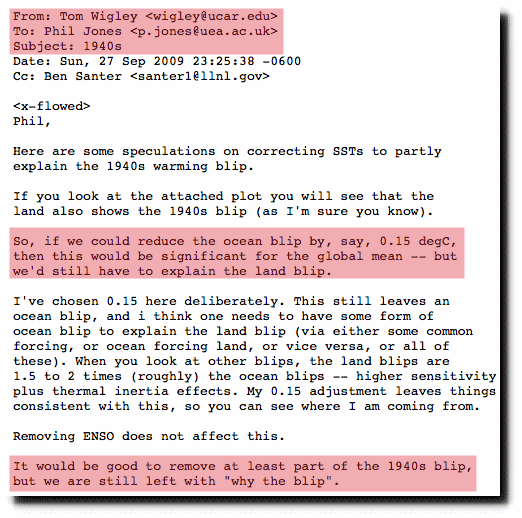
This removal of the “1940’s blip” was done intentionally.  Climate scientists openly discussed their desire to get rid of the 1940s warmth.

di2.nu/foia/1254108338.txt

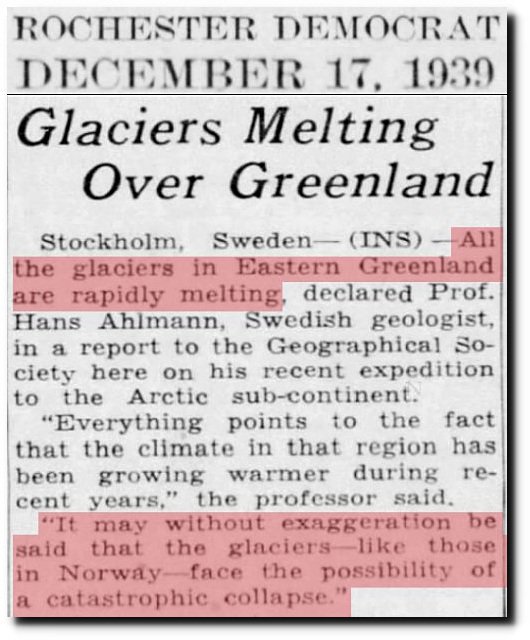
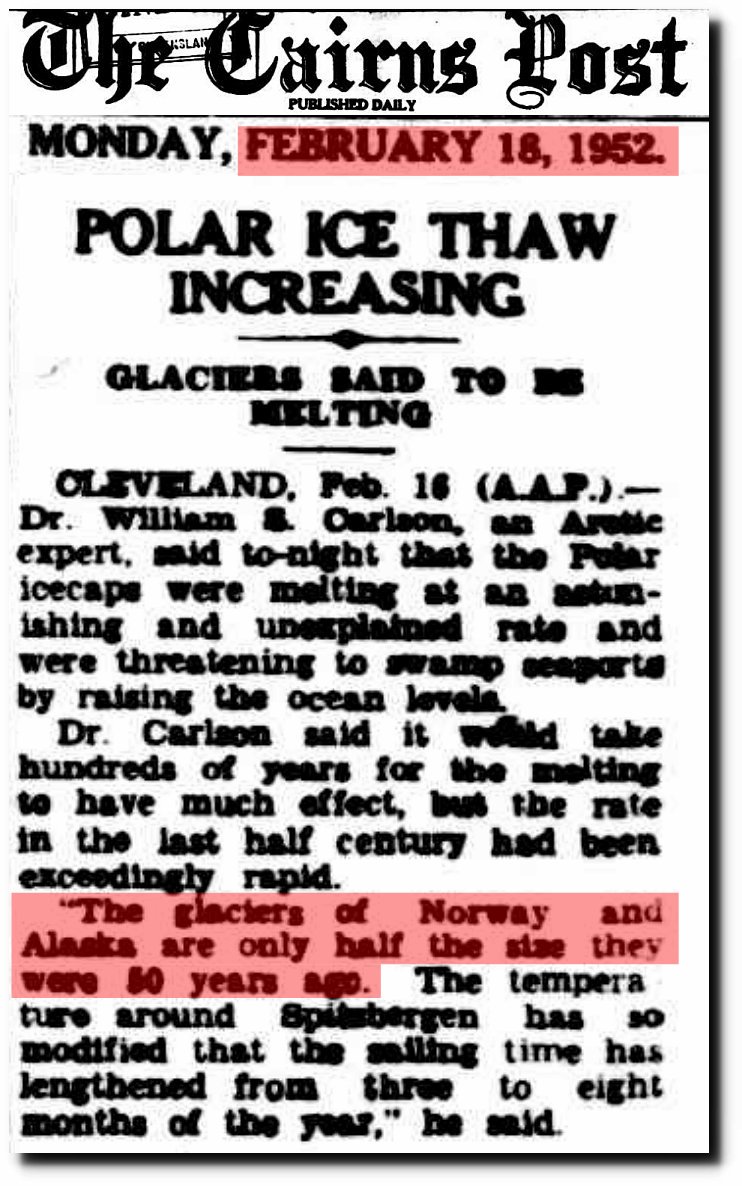
But historical records show that the time around the 1940 was very warm – with glaciers rapidly melting in Greenland, North America and Europe.

17 Dec 1939, Page 15 – Harrisburg Sunday Courier

18 Feb 1952 – POLAR ICE THAW INCREASING

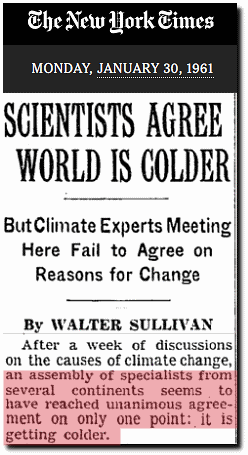
This warmth of the 1930s and 1940s, turned rapidly into cooling – which has been largely erased in current NASA temperature graphs.

January 30, 1961 – NYTimes

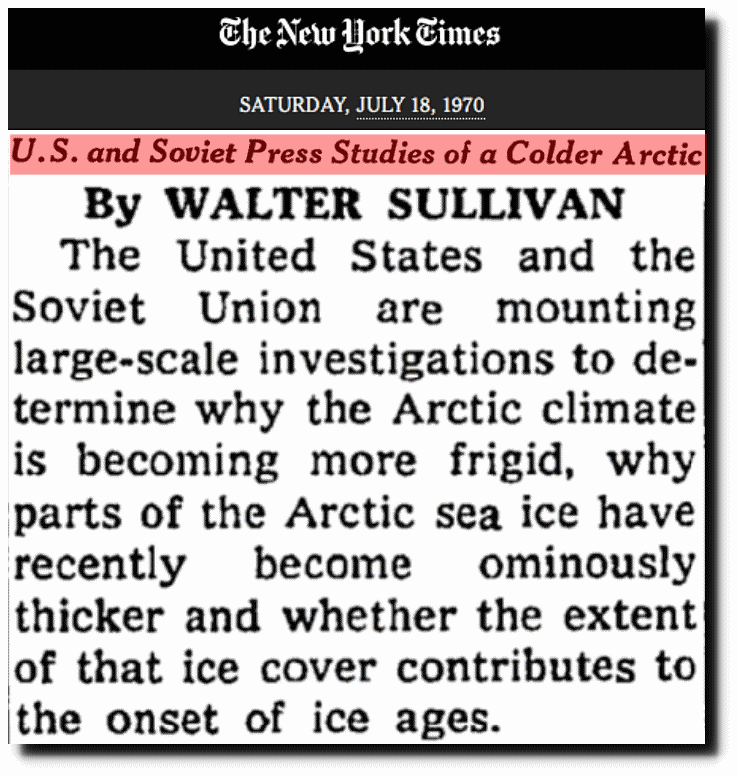
U.S. and Soviet Press Studies of a Colder Arctic – The New York Times

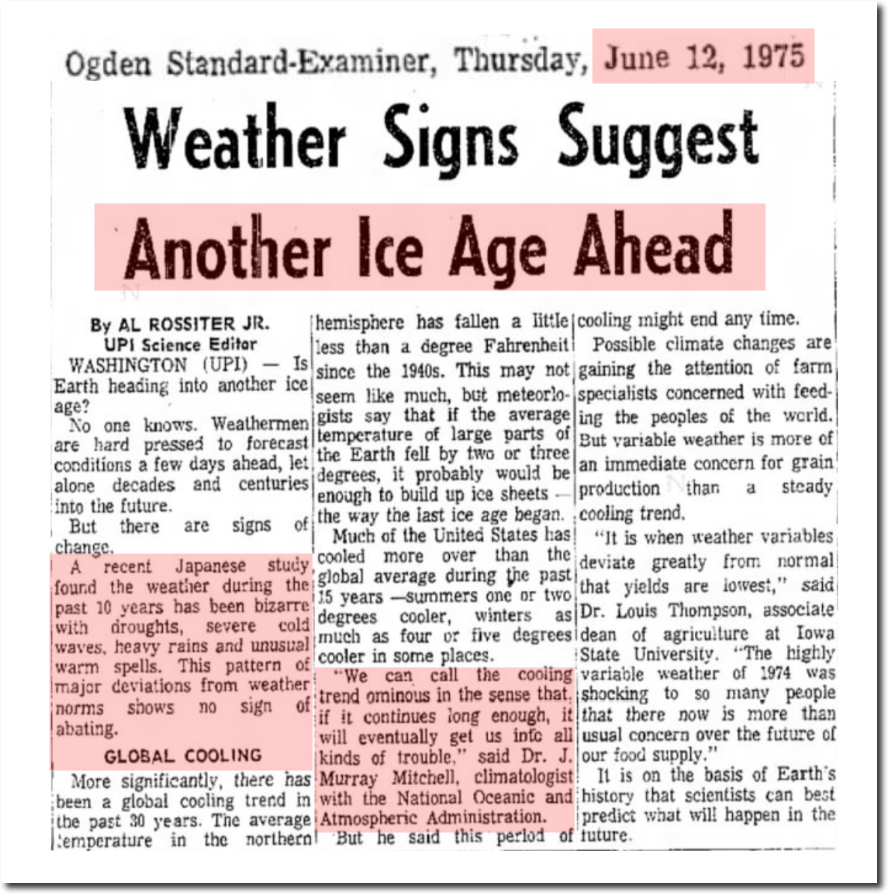
12 Jun 1975, Page 10 – The Ogden Standard-Examiner at Newspapers.com

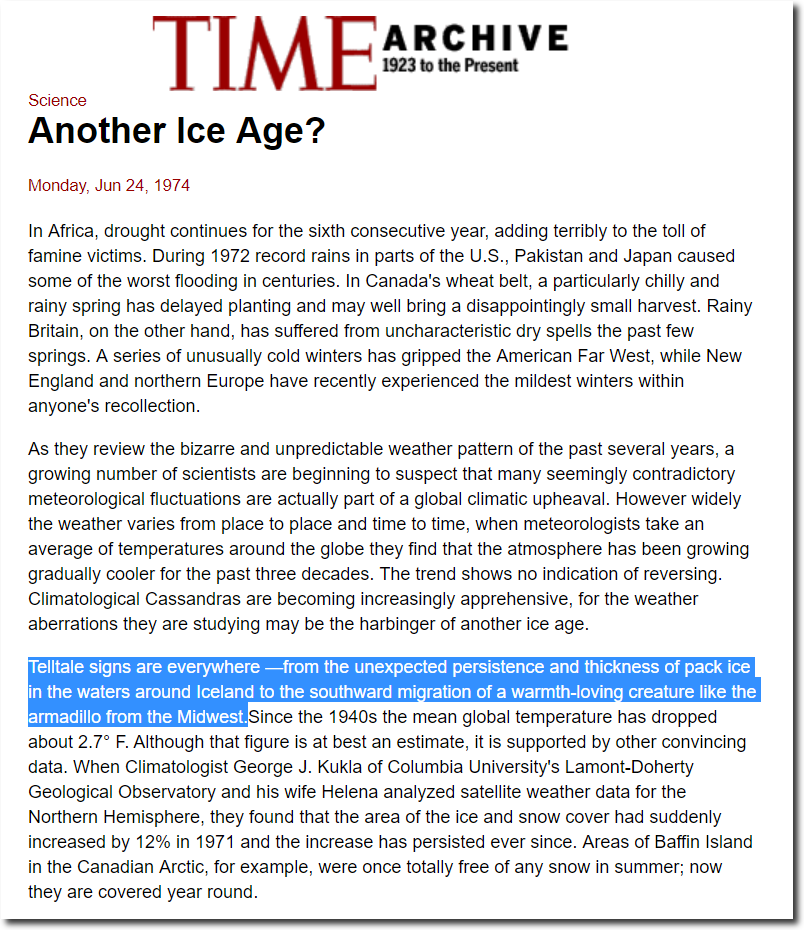
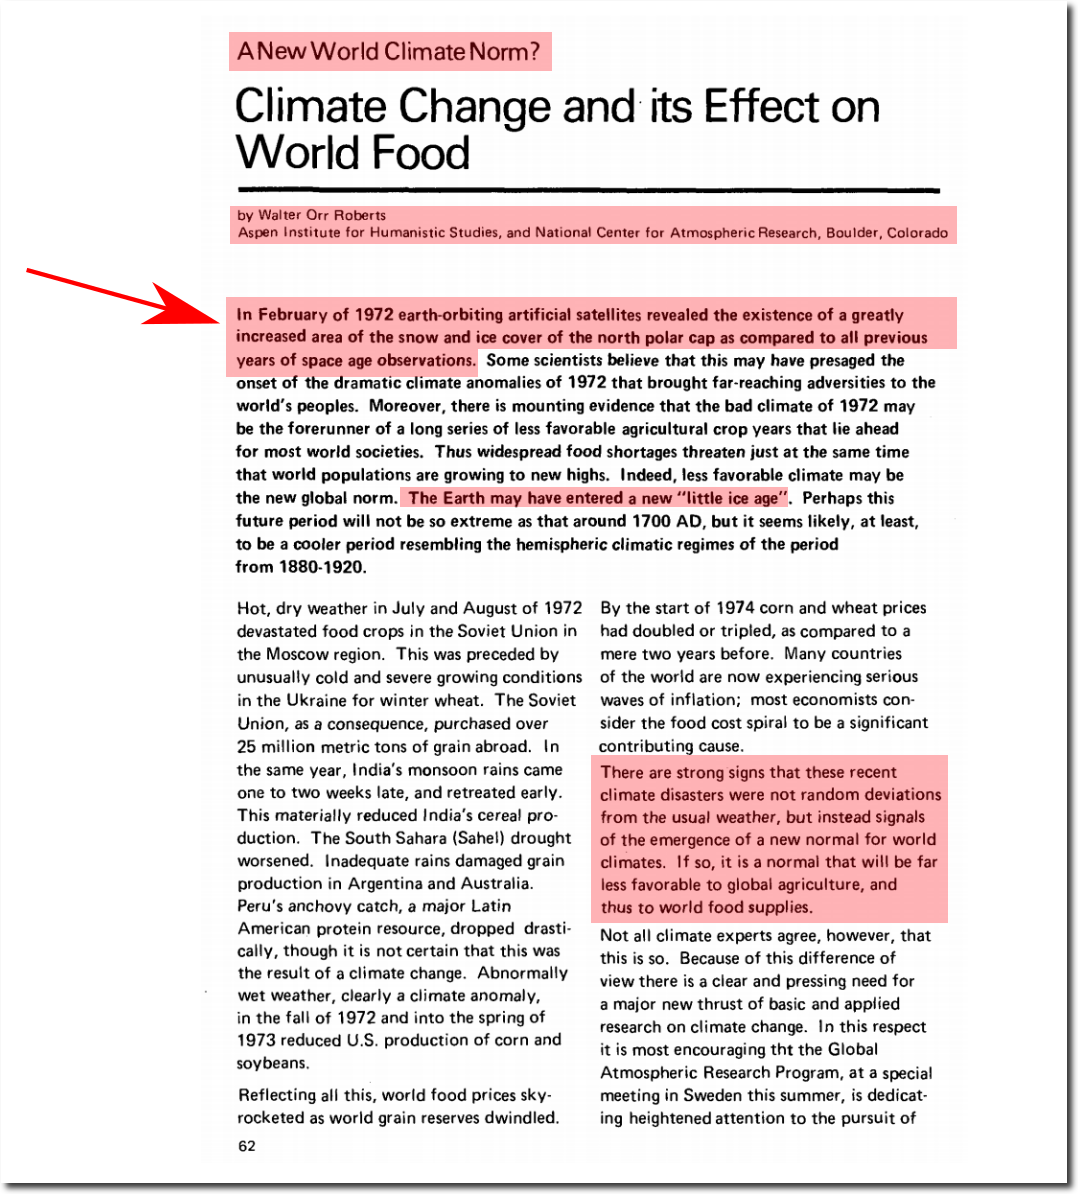
TIME Magazine Archive Article — Another Ice Age? — Jun. 24, 1974

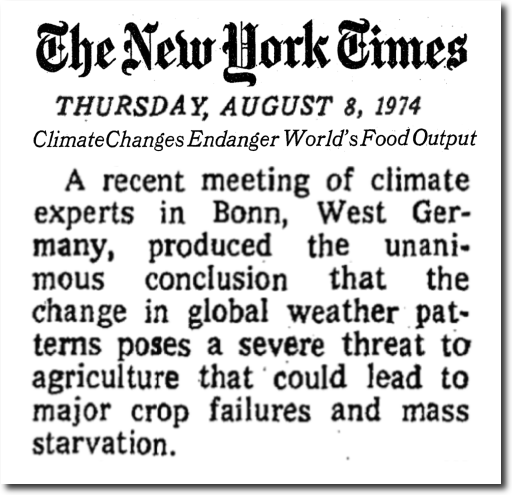
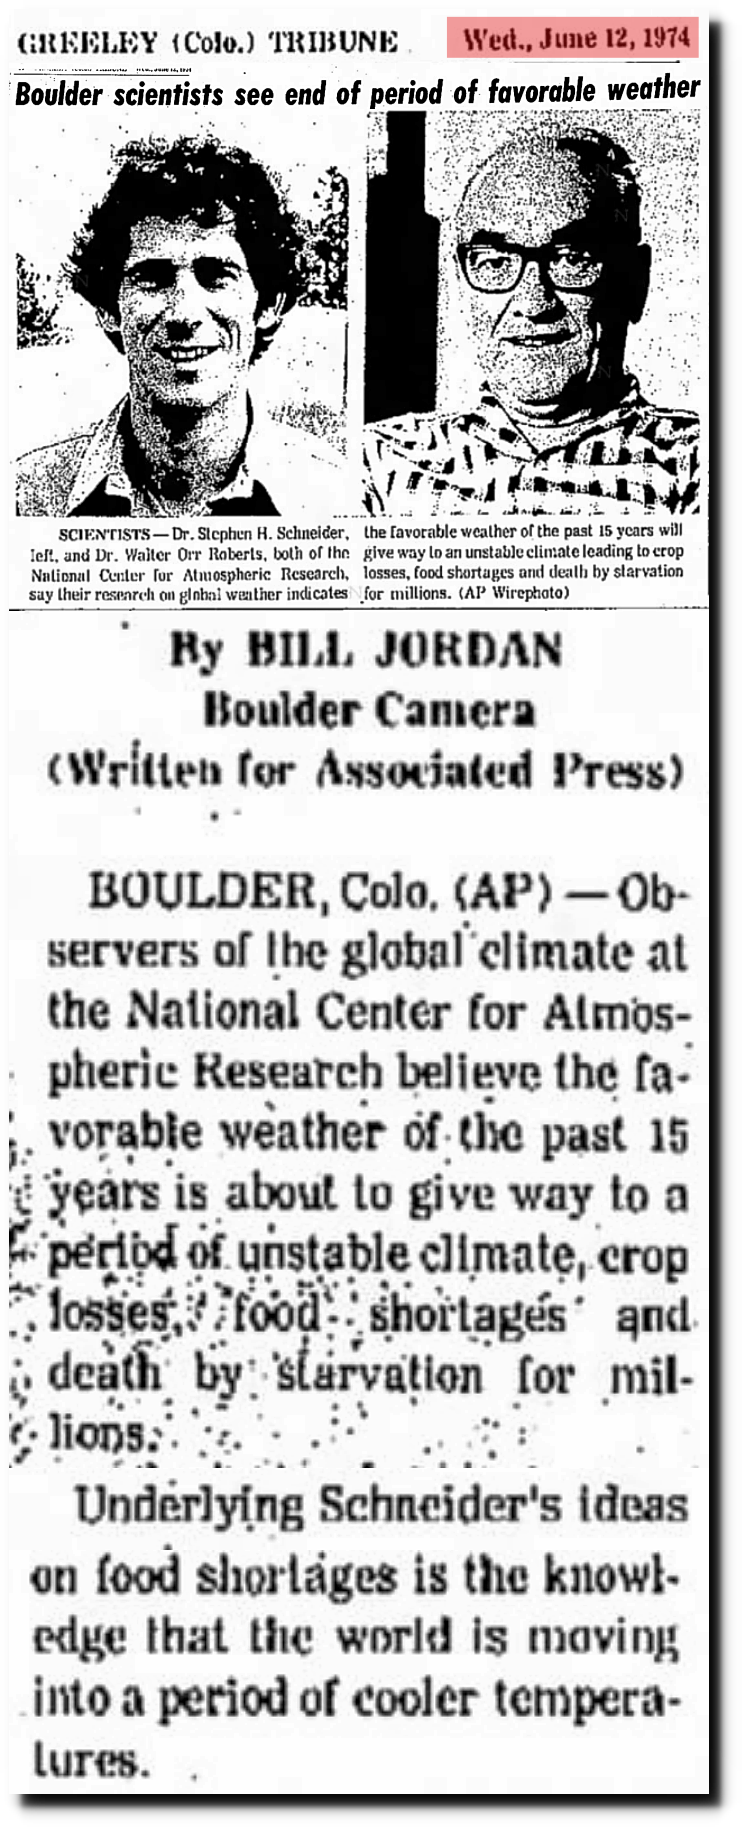
A recent meeting of climate experts in Bonn, West Germany, produced the unanimous conclusion that the change in global weather patterns poses a severe threat to agriculture that could lead to major crop failures and mass starvation.

Climate Changes Endanger World’s Food Output – The New York Times

Wayback Machine

12 Jun 1974, Page 20 – at Newspapers.com

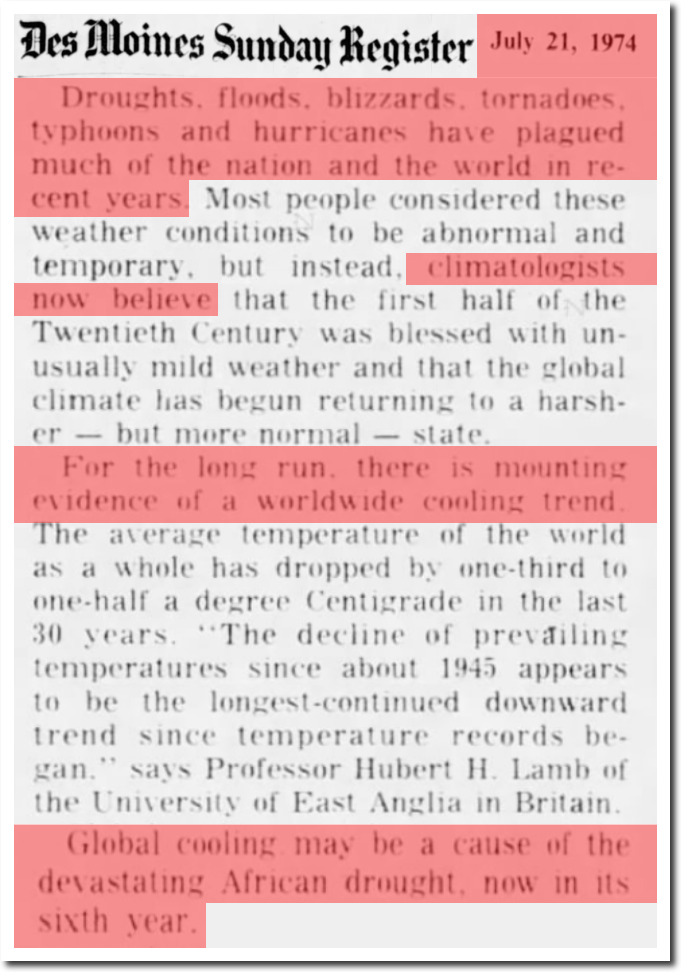
21 Jul 1974, 13 – The Des Moines Register at Newspapers.com
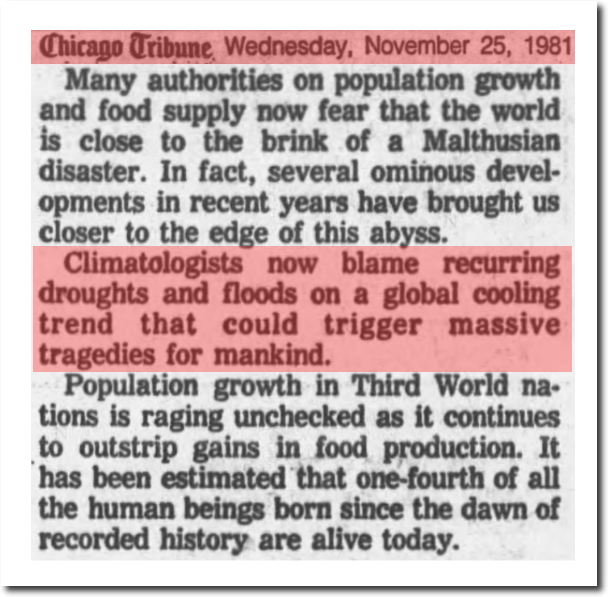
 

25 Nov 1981, 13 – Chicago Tribune at Newspapers.com

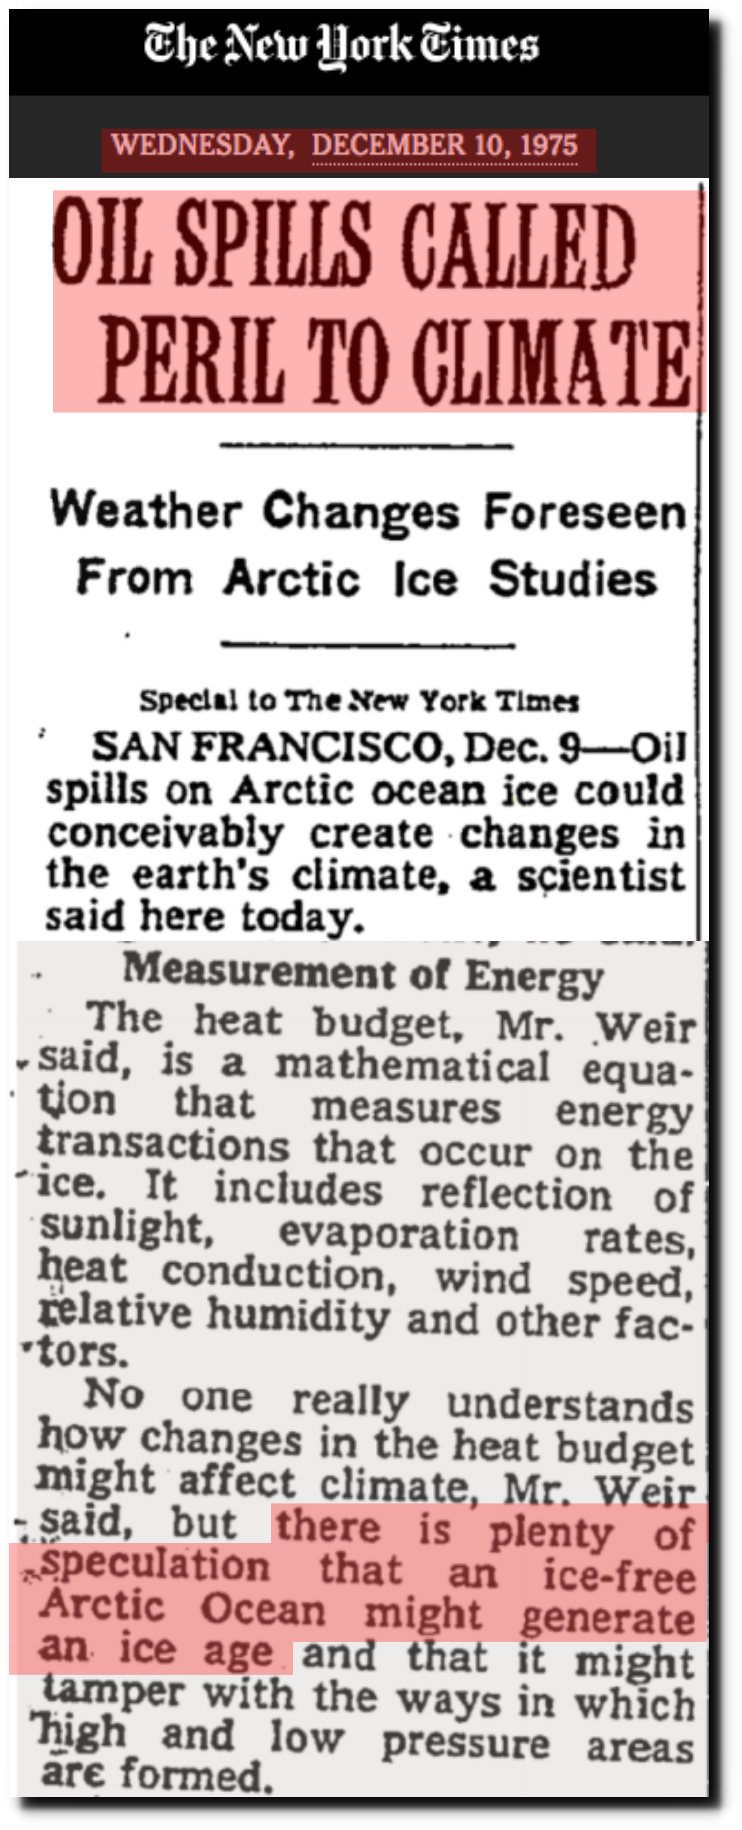
OIL SPILLS CALLED PERIL TO CLIMATE – The New York Times

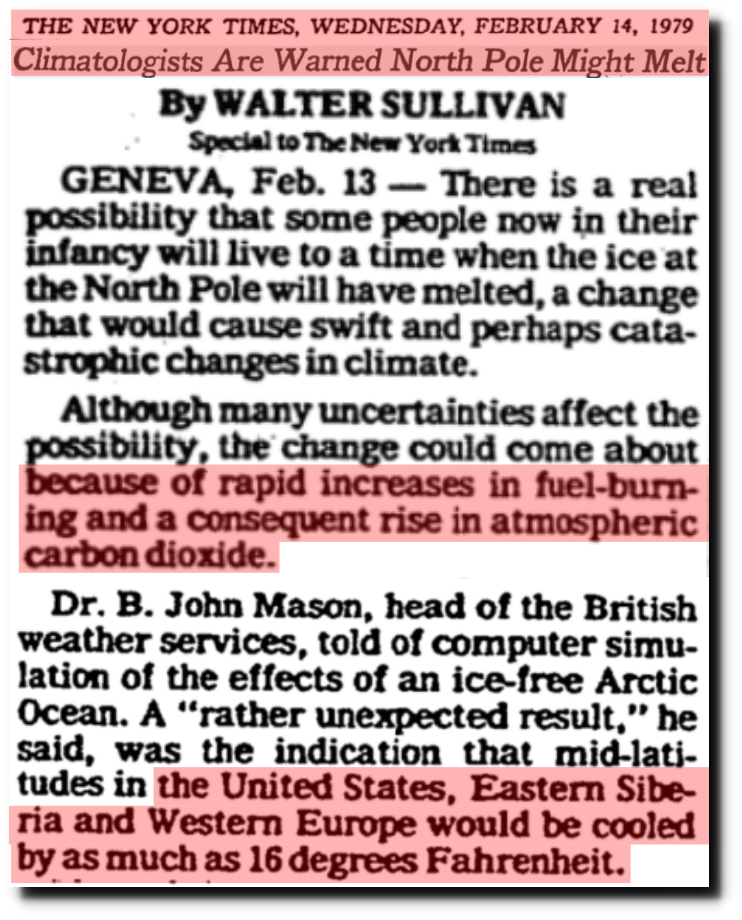
Climatologists Are Warned North Pole Might Melt – The New York Times

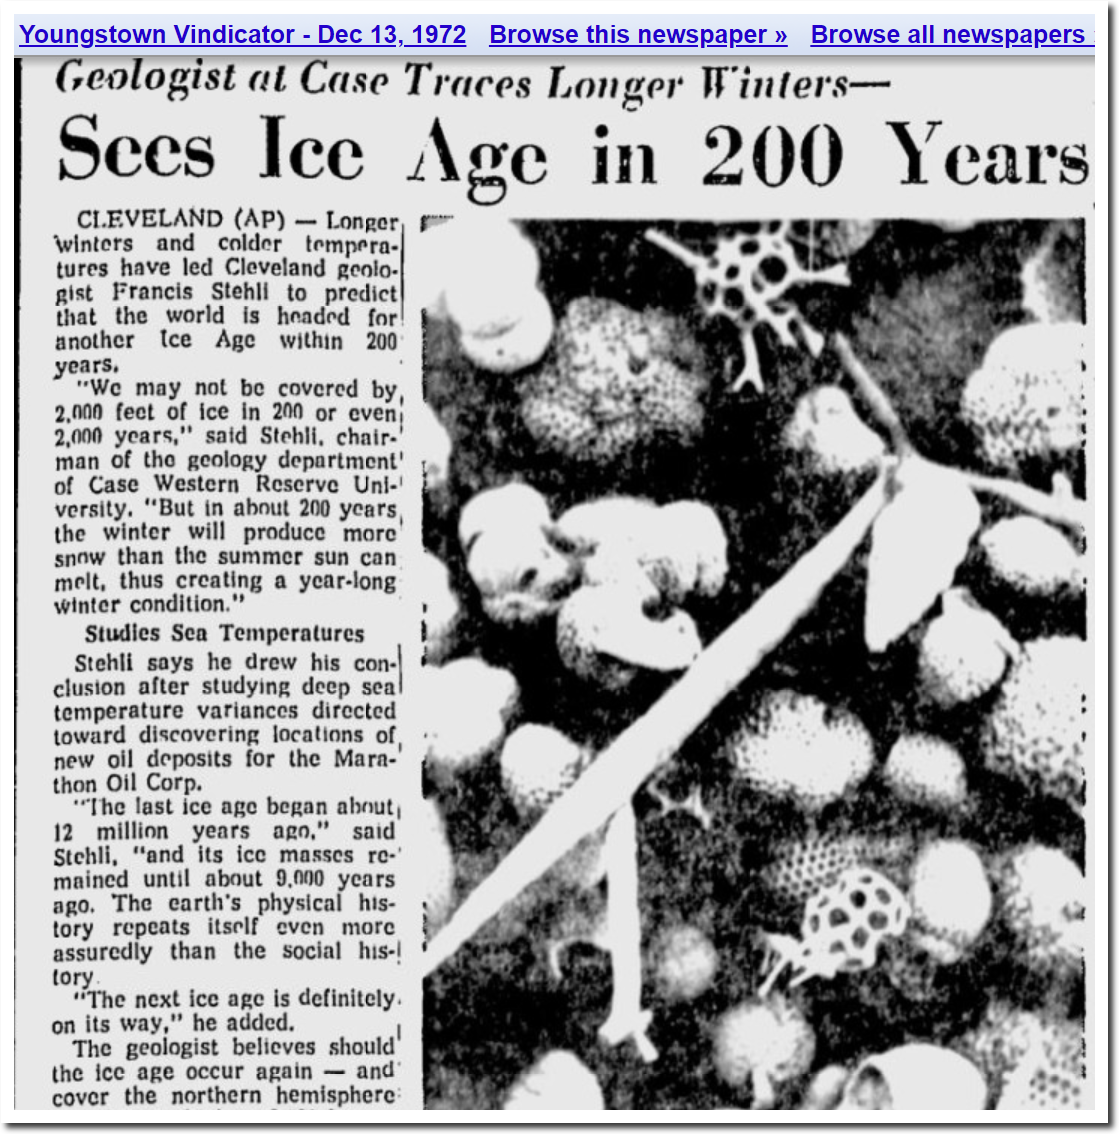
Youngstown Vindicator – Google News Archive Search

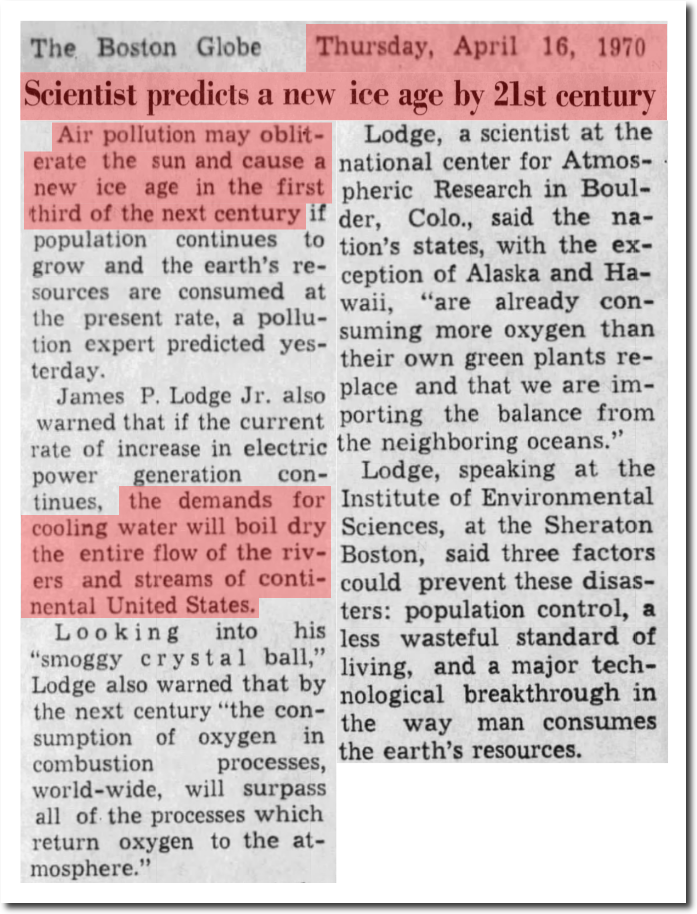
16 Apr 1970, 18 – The Boston Globe at Newspapers.com

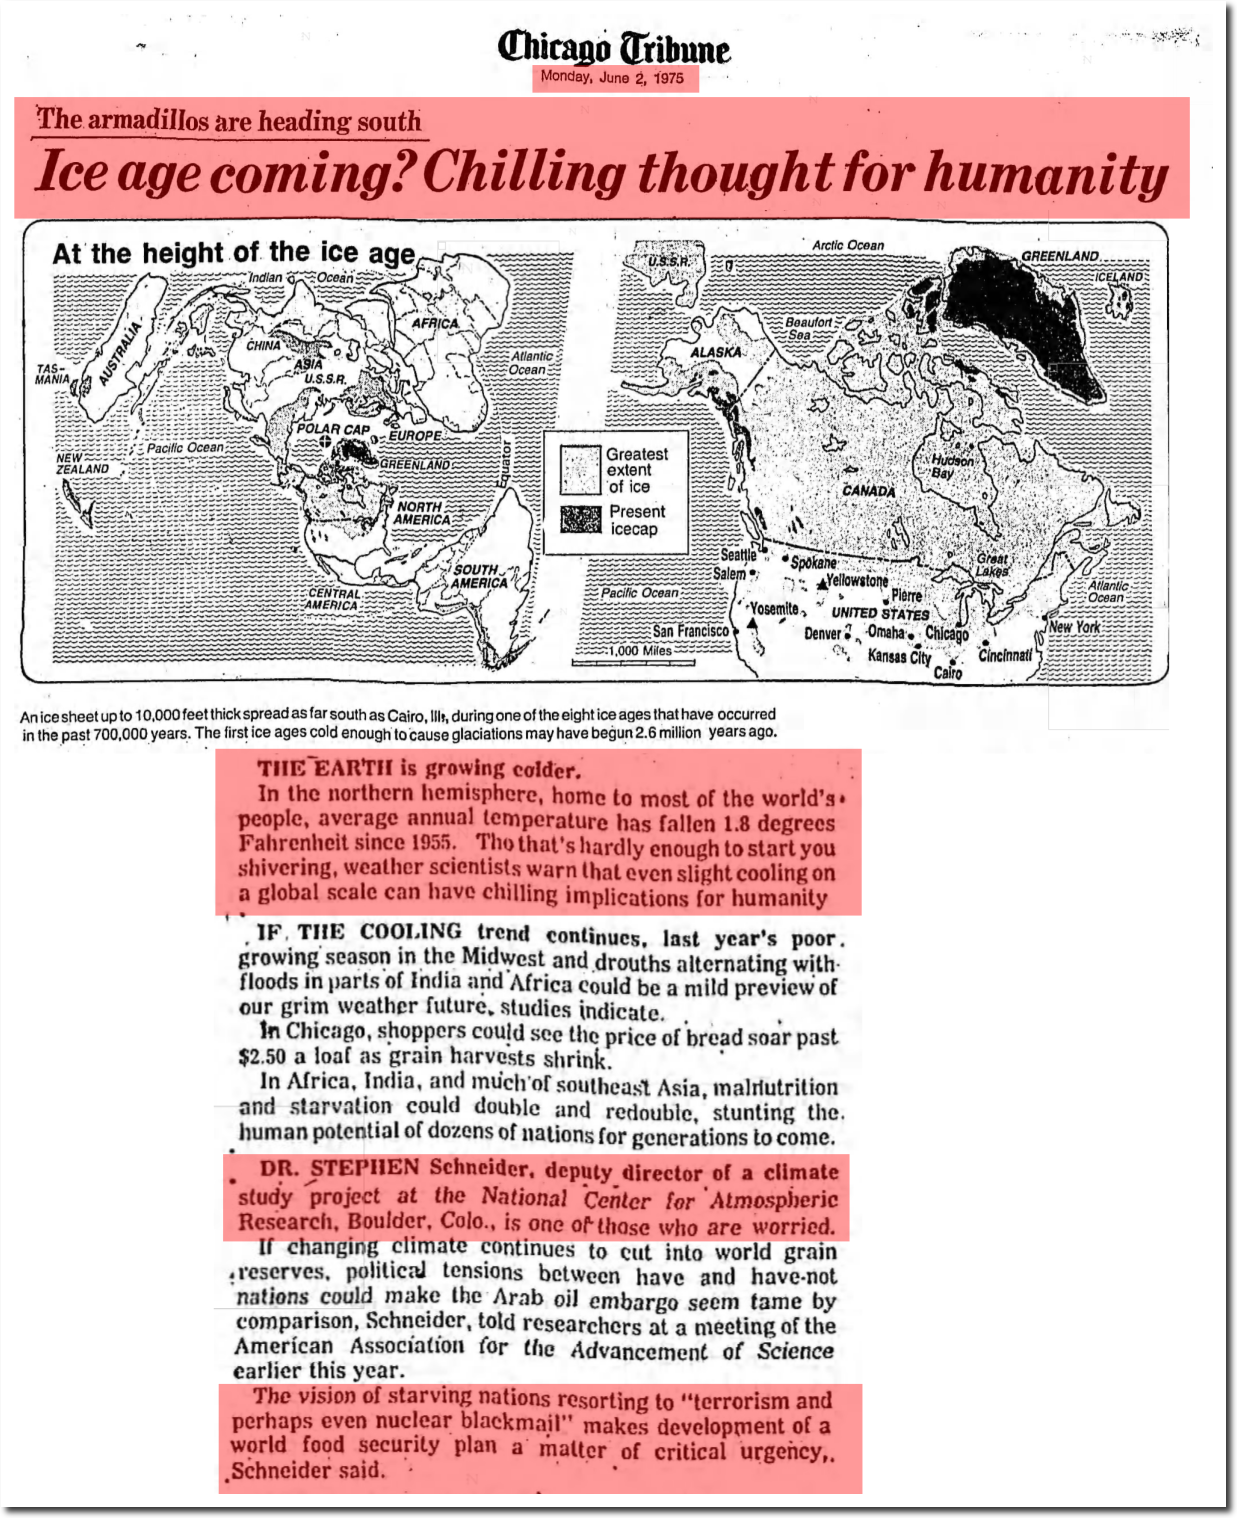
02 Jun 1975, Page 76 – Chicago Tribune at Newspapers.com

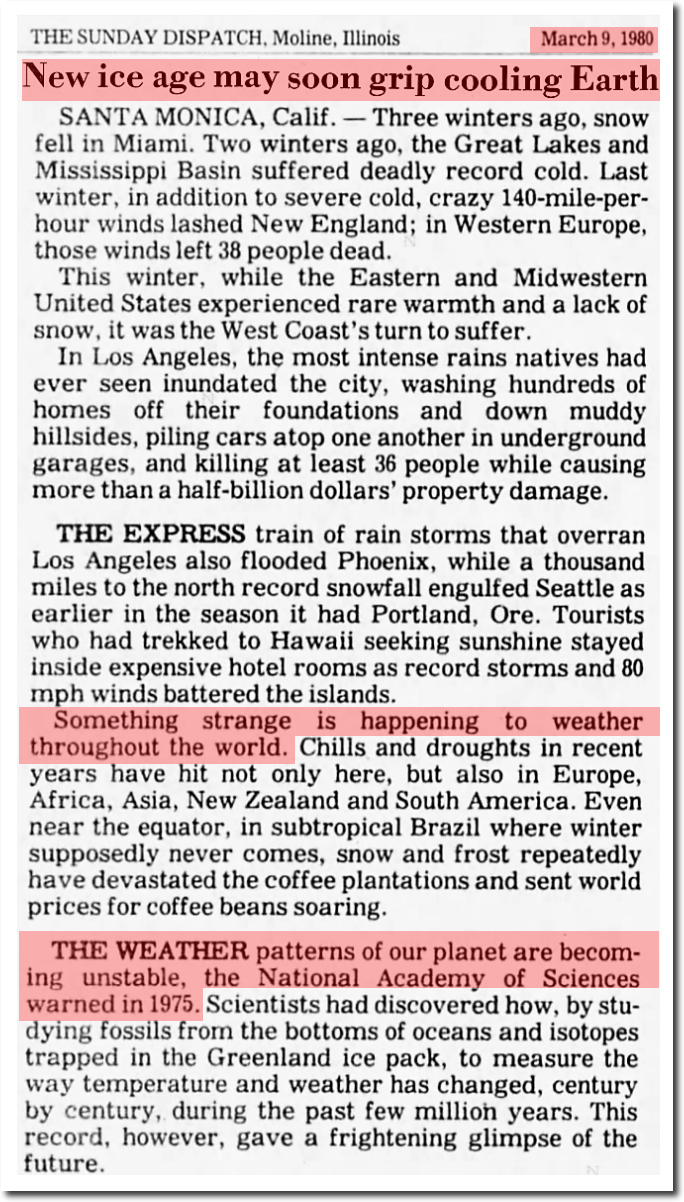
09 Mar 1980, 4 – The Dispatch at Newspapers.com

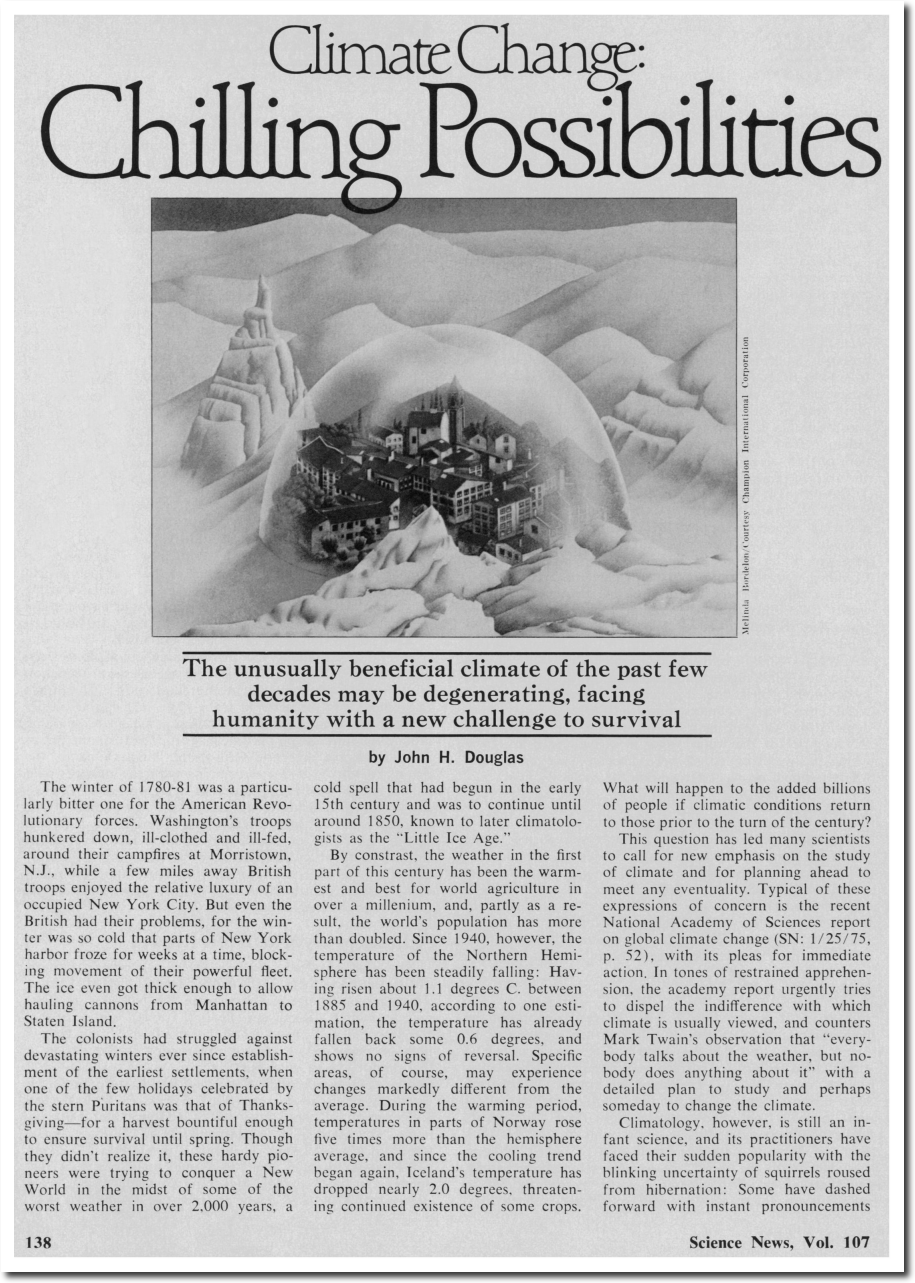
https://www.sciencenews.org/sites/default/files/8983

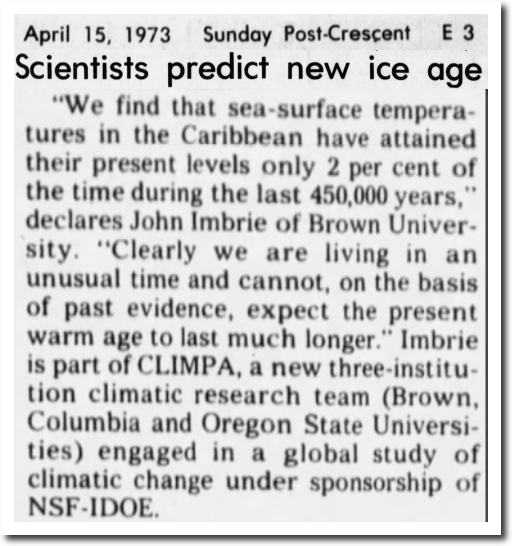
15 Apr 1973, 59 – The Post-Crescent at Newspapers.com

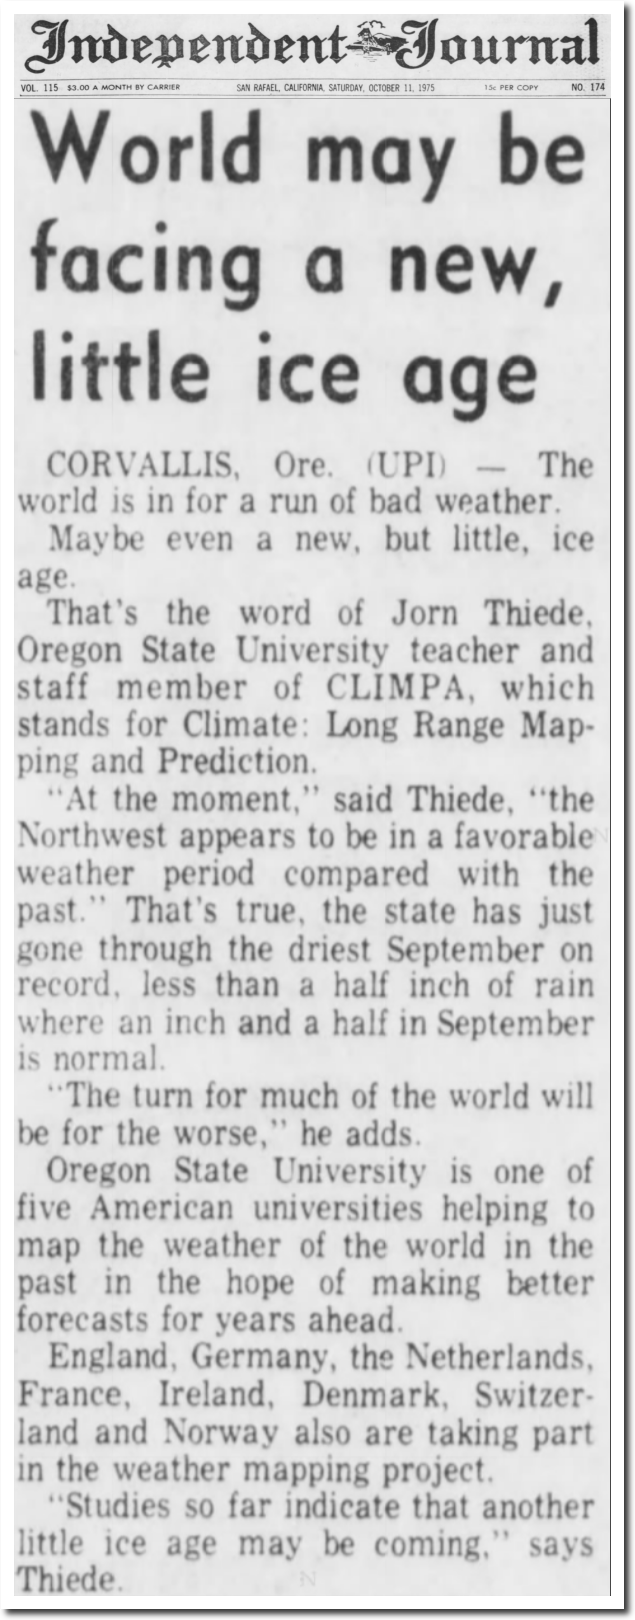
11 Oct 1975, Page 41 – Daily Independent Journal at Newspapers.com

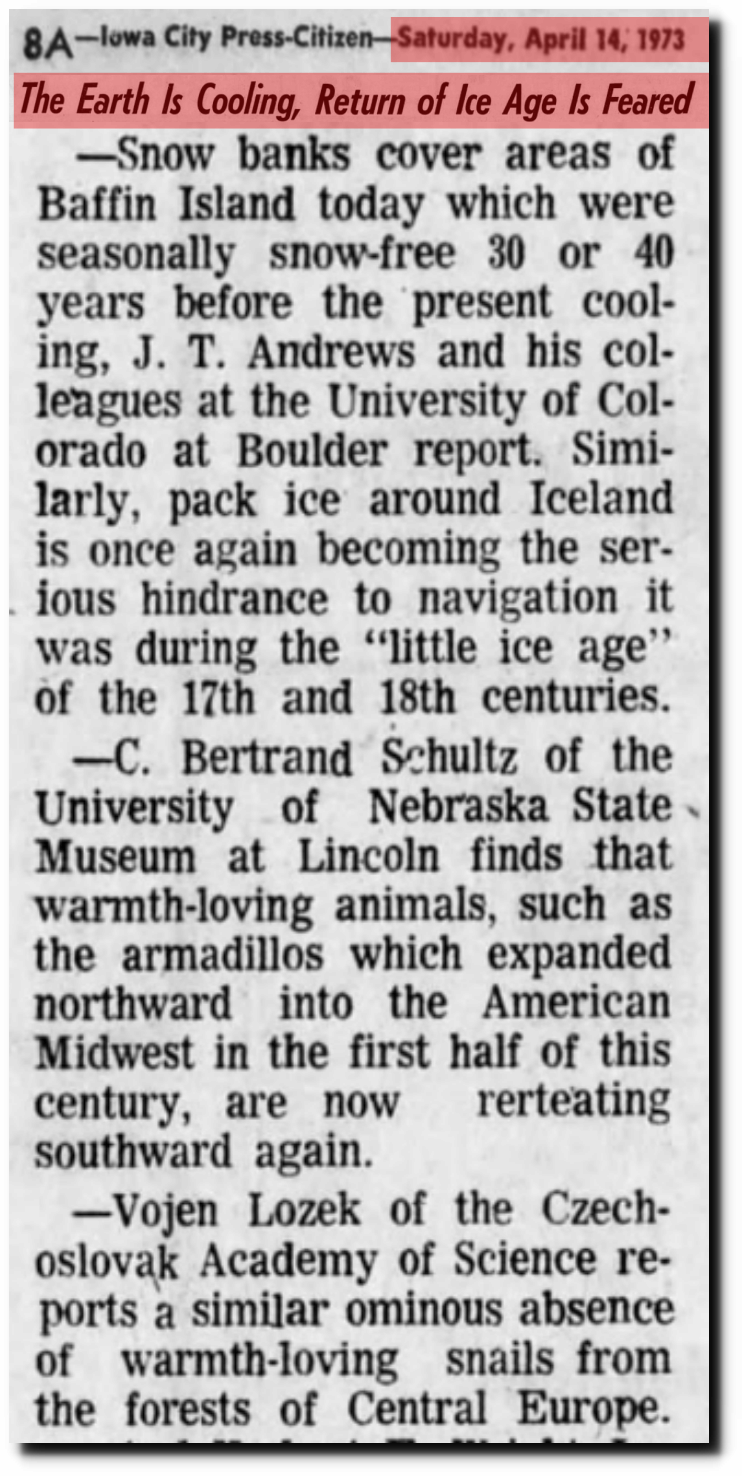
14 Apr 1973, Page 8 – Iowa City Press-Citizen

THE ROLE OF NOAA’S CLIMATE PREDICTION CENTER IN THE DEVELOPMENT OF CLIMATE SERVICES

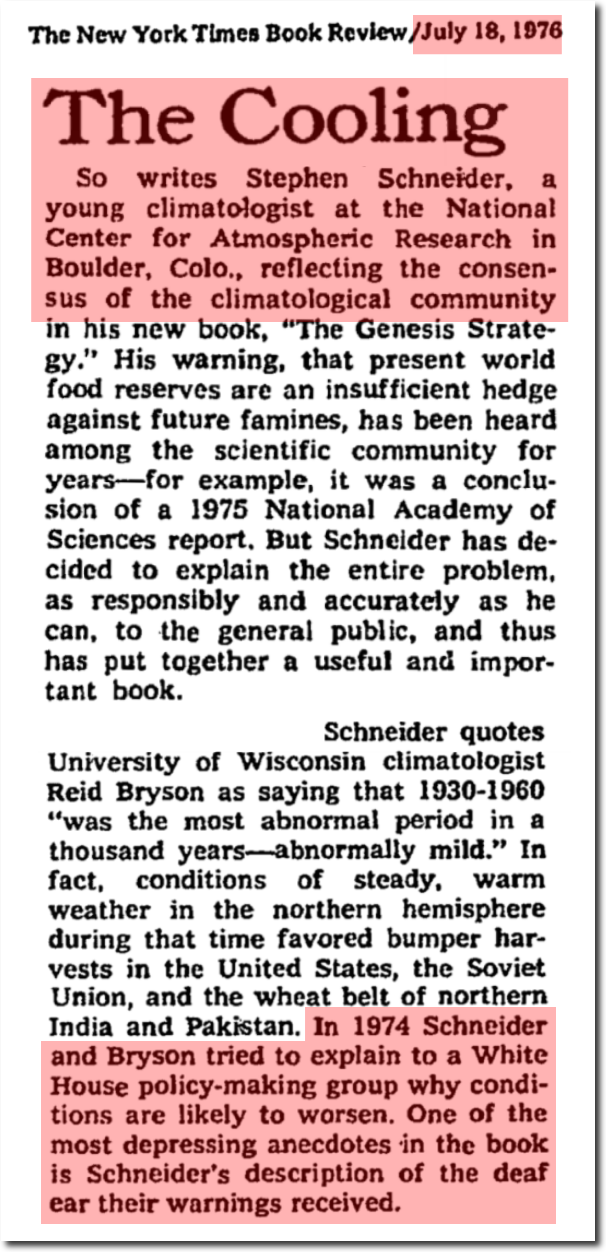
The Genesis Strategy – The New York Times

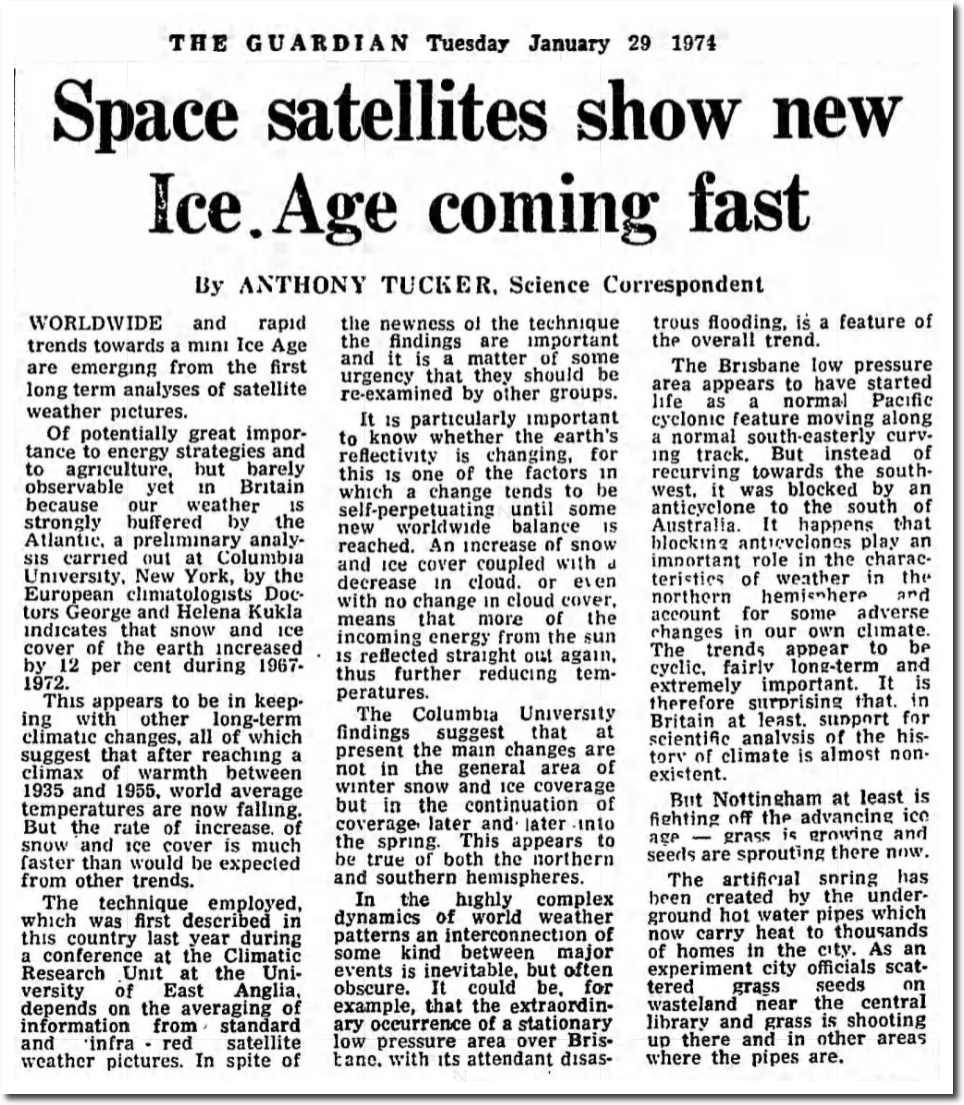
29 Jan 1974, 5 – The Guardian at Newspapers.com

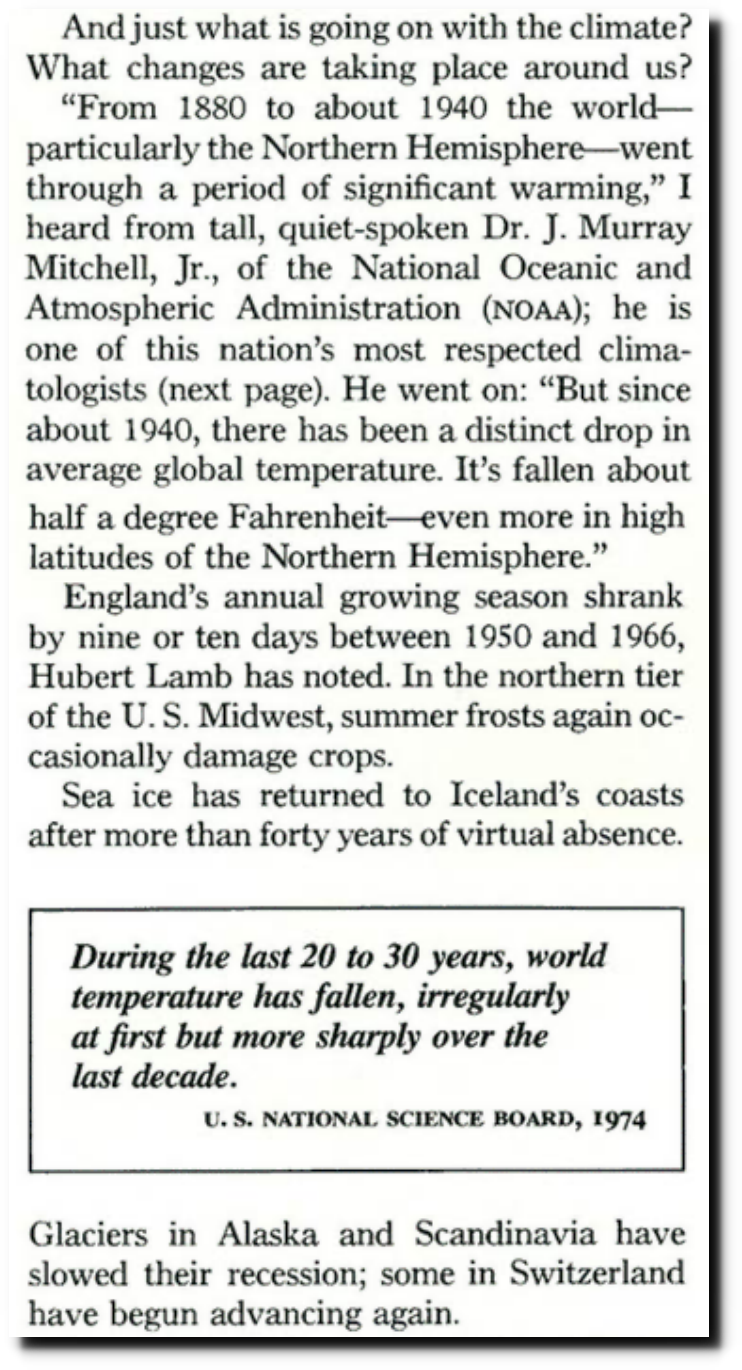
The National Geographic Archive | November 1976 | page 1

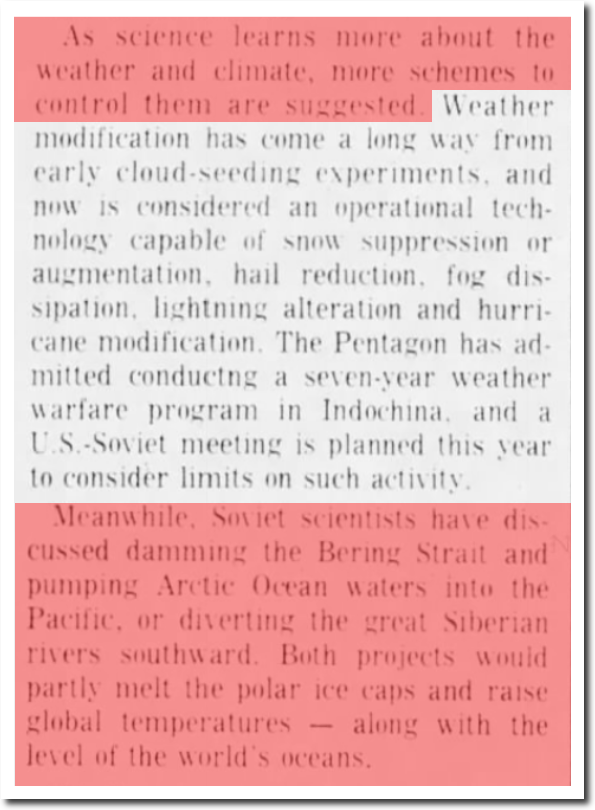
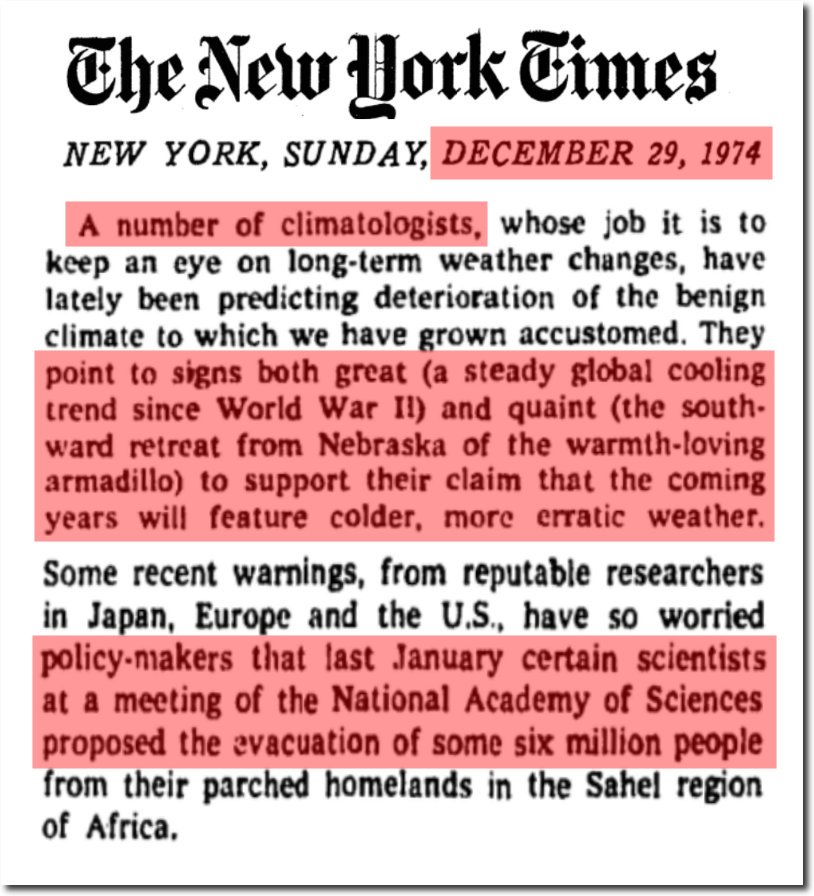
TimesMachine: December 29, 1974 – NYTimes.com

21 Jul 1974, 13 – The Des Moines Register at Newspapers.com

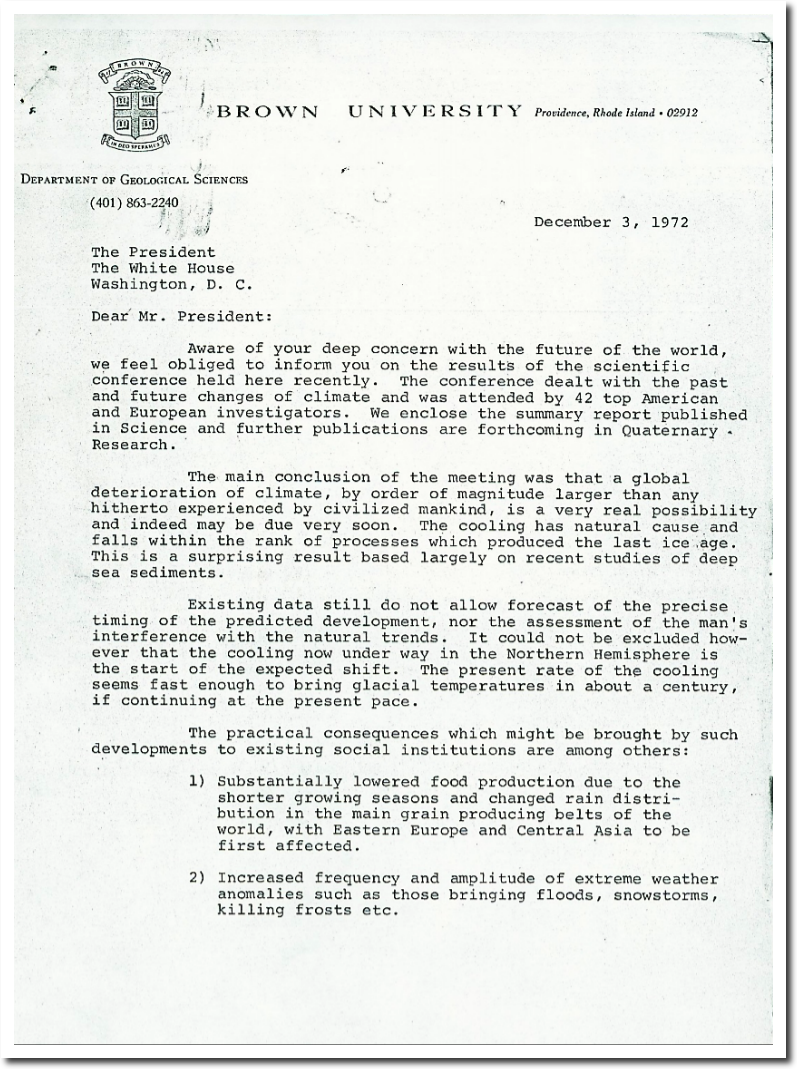
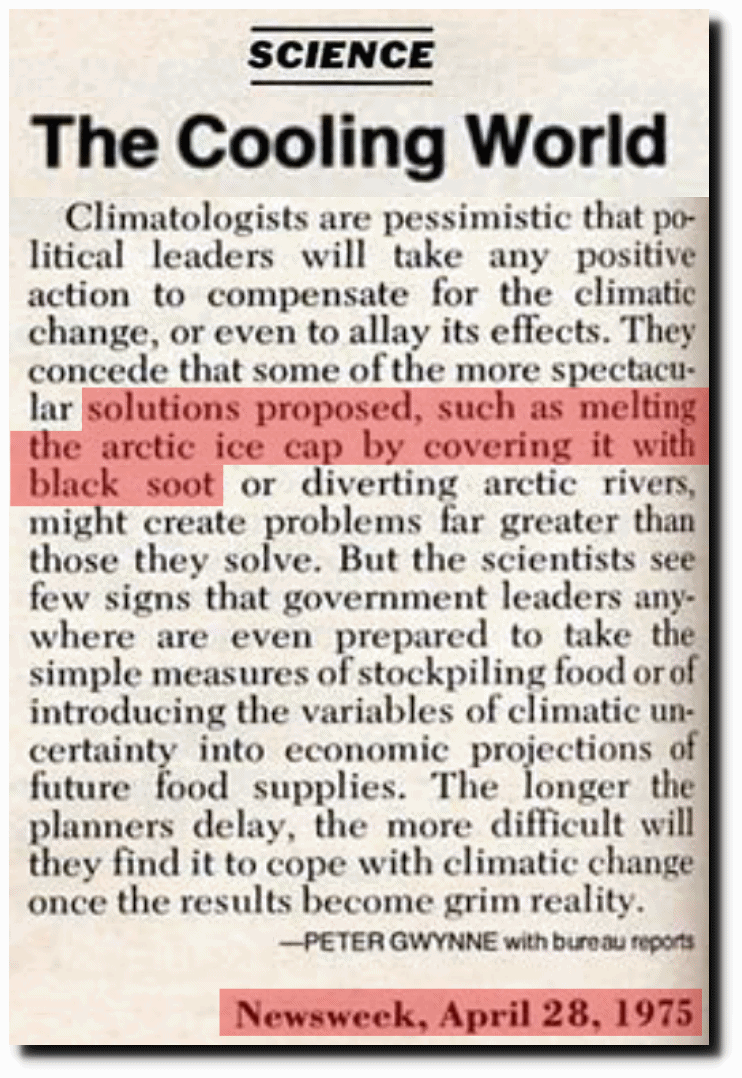
‎www.denisdutton.com/newsweek_coolingworld.pdf

I’ve worked with global temperature data, and know that you can produce any shaped global temperature graph you want by picking the right set of stations. There are grossly inadequate amounts of both historical and current data to produce a meaningful long term temperature graph for the earth.  Much of the data is fake –  by their own admission.

The best temperature data set (by far) is the US data, which has been altered by NOAA and NASA over the past 20 years to turn 90 years of cooling in to warming. Global temperatures have also been massively altered over the past 45 years. And climate scientists colluded to remove the 1940s blip.

There is no conceivable way this graph could have been produced without lots of collusion between the four “independent” agencies.

This entry was posted in Uncategorized. Bookmark the permalink.

41 Responses to Overwhelming Evidence Of Collusion

  1. Yonason says:

    Funny how not only do all the data sets agree, but so does the tampering do the adjustments. Now THAT’S amazing!
    Just like that with that kid in high school whose term paper was identical to the encyclopedia article on the topic.
    Wouldn’t it be funny if it was the same kid!

  2. spike55 says:

    We can add BEST to that lot.

    Deliberately create to “support” the collusion.

  3. Lasse says:

    And at the same time they are concerned of populism by the people.
    You can not joke the mass all the time without reactions.

    • arn says:

      Don’t you know that marxist globalist have a monopol
      on populism,hate speech,propaganda,racism,deception and guerilla tactics?

      But when they use it is not called populism,bigotry hate speech etc but
      business as usual and philantrophie.
      +they have the moral high ground and the interpretational sovereignity to define and redefine reality and truth.
      This methods were once called agitprop.

  4. Steven Parker says:

    This should be a pinned post. Half way through I thought this might be a final brain dump before you head off into the sunset. Tons of excellent material that destroys the climate cabal’s lie. Keep it up.

    • rah says:

      I cannot recall Tony ever putting so many article clippings in a single post. Outstanding my man.
      Thinking back over my time frequenting this blog also reminded me that it has been a long time since I have read anything from Gail at any of the blogs I frequent including the Conservative Tree House. Anyone heard anything from her? Hope she’s doing ok.

    • arn says:

      Tony should use this post as base/blueprint for a book.

      • Johansen says:

        Agreed, except no one reads books. This forum, and the related videos, probably reach a larger audience.

        The title of this piece could be, “Overwhelming Evidence of Racketeering”. This is simple organized crime…

      • Louis Hooffstetter says:

        Tony, this is one of your best posts. I agree with arn that this could be the basis for a book. If not, please make a YouTube video of this at least.

  5. rah says:

    I wonder about that picture showing an armadillo and claiming they had started migrating north and then retreated. It appears to stand alone, unrelated to the articles immediately above or below. Do you have the story that went with that picture Tony? During my 63 year life time I never saw one north of Oklahoma, Arkansas, Mississippi, Alabama, S. Carolina in the wild. IOW no where near the Midwest.

    I looked up the range and it appears references do show them in S. Missouri and SE Kansas, and the SW corner of Tennessee. https://armadillo-online.org/expansion.html

    I would have to see that to believe it. Down in Texas we Yankees called armadillos “possum on the half shell” because they were such a common road kill. This truck driver that has driven all over down there can’t recall seeing an armadillo road kill in Missouri, Kansas, or Tennessee.

    I would have to see it to believe it. I have driven ex

  6. richard says:

    Add on that the WMO organisation flag up that temps across Africa, one fifth of the world’s land mass, are estimated.

    “Because the data with respect to in-situ surface air temperature across Africa is sparse, a one year regional assessment for Africa could not be based on any of the three standard global surface air temperature data sets from NOAA NCDC, NASA-GISS or HadCRUT4. Instead, the combination of the Global Historical Climatology
    Network and the Climate Anomaly Monitoring System (CAMS GHCN) by NOAA’s Earth System Research Laboratory was used to estimate surface air temperature patterns”

  7. Mac says:

    It’s funny how intelligent, rational people think differently from the religious fanatic climate change crowd. See, it isn’t phony and non-existent climate change that is going to wreck civilization. It’s leftist corpo-globalist lies, corruption, and the politicization of science that’s going to destroy the world. No one on the left is concerned at all with telling the truth any longer. Everything is political with the left, and everything is an opportunity for sanctimonious activism with them. They’re all completely out of control, obsessed, and thoroughly mentally ill. They don’t think anymore. Everything is pure emotion and primitive impulse, and the lies get bigger and bigger with every year that goes by. Truly a frightening time to be alive.

  8. feathers says:

    I’m surprised that the Japanese are also going along with the junk science. Don’t they know their society is the first to go with the globalist population management plan? I guess the grant money is just too good to pass up?

  9. Mark says:

    Looking forward to this video!

    May I suggest you start picking apart the CO2 sensitivity numbers from 1980’s to today?

  10. arn says:

    So 40 years ago they did not even had enough data for the southern hemisphere but nowadays they have enough data for the past 140 years
    worldwide!!!
    That’s the most interessting and contradicting development in science since co2 became superevil.

    One has to be Griff or Phil to not smell the shit AGW is based on.

  11. Don B says:

    Tony, you have outdone yourself, again. The truth will ultimately prevail.

  12. Frank K. says:

    I was curious about the “four independent data sets” for the GAST plot and decided as a test to look up what the JMA was doing, which can be found here:

    https://ds.data.jma.go.jp/tcc/tcc/products/gwp/temp/explanation.html

    Note the following statement:

    “JMA estimates global temperature anomalies using data combined not only over land but also over ocean areas. The land part of the combined data for the period before 2000 consists of GHCN (Global Historical Climatology Network) information provided by NCDC (the U.S.A.’s National Climatic Data Center), while that for the period after 2001 consists of CLIMAT messages archived at JMA. The oceanic part of the combined data consists of JMA’s own long-term sea surface temperature analysis data, known as COBE-SST.

    OK. So before 2000 they are using the homogenized, altered data from the NCDC for land!

    What about the sea surface temperature anomalies? Some information here:

    https://climatedataguide.ucar.edu/climate-data/sst-data-cobe-centennial-situ-observation-based-estimates

    “The COBE data set is a spatially complete, interpolated 1°x1° SST product for 1891 to present. It combines SSTs from ICOADS release 2.0, the Japanese Kobe collection, and reports from ships and buoys. Data are gridded using optimal interpolation. As in HadISST, data up to 1941 were bias-adjusted using the “bucket correction.” Prior to the interpolation analyses, data were also subject to quality control using a-priori thresholds, and nearby observations were combined. COBE data have been used in the JRA Reanalyses and for AMIP experiments.”

    So they use a SST data set that has the same “bucket corrections” as the Hadley data, and so will display similar trends. Moreover ICOADS is a ship temperature database which forms the basis of HadSST3 and ERSSTv3b. Guess where those are used???

    In summary, the JMA data are NOT really independent at all, but draw from the same databases as all of the others. No wonder the GAST plots look the same!

    • Richard M says:

      I think you figured it out. It’s not so much collusion as is it the fact they are all using mostly the same data sets and that data has already been “corrected”.

      • Frank K. says:

        Right! So why publish a GAST plot from four supposedly “independent” sources? Sure, they may use slightly different averaging here and there, but the agreement between them is simply a matter of using essentially the same data!

  13. Bob Hoye says:

    The “warmunists” insist that unless the Earth’s temp is kept from rising 2 degrees above some arbitrary level it will reach a “Tipping Point”. When a monstrous positive feedback mechanism will kick in and the Earth “will fry”.
    Diminishing solar activity is a “built in” cooling force that will soon destroy the promotion.
    Over in economics there has been a longer-running set of control freaks.
    The pitch over most of the last decade has been that if the rate of CPI inflation is not kept above 2 percents something terrible.
    will happen.
    That would be a financial contraction.
    And bureaucrats are fixed upon the number “2”.
    Contractions always follow financial bubbles and the public will soon see that the central bank in spending trillions of taxpayer dollars to prevent “bad things” from happening is not working.
    Popular condemnation of economic policymaking is likely.
    The next step would be popular condemnation of the global warming mantra.
    And Tony is providing an impressive body of criticism.

  14. Al Shelton says:

    I hope that your info gets into the correct Government hands, so that Trump and his Staff can continue to drain the swamp.
    The swamp is still full of pollution.

  15. Gamecock says:

    I have saved a link to this post. It is DEFINITIVE! Thanks for posting it!

    But I go one up on you, Tony. As severely limited as our weather data is, it is massive compared to ocean data. We have virtually NONE. Yet we get agitprop like this:

    https://www.nytimes.com/2019/01/10/climate/ocean-warming-climate-change.html

    We don’t know if oceans are warming or cooling. We have no data. Not today’s data, nor yesterday’s data.

    Man’s Argo float system does not give us ocean temperature. If you think measurements in central Africa are sparse, note that each Argo float represents 350,000 cubic kilometers of ocean.

    And by design, Argo floats don’t go into 40% of the world’s oceans (any depth below 2000 meters).

    The Argo system is a 21st century creation. To whatever extent its data is useful, there is nothing to compare it to.

    • Johansen says:

      The oceans are so large and varied, I don’t know how you would ever come up with an average ocean temperature…
      Yes – maybe spot trends in specific locations/depths, but an overall, unified-temperature?

  16. Jeff L. says:

    “Between 1999 and 2016, NASA completed altered the shape of the US temperature graph to turn seventy years of cooling into warming.”

    I believe Tony meant to say “completely” instead of “completed” in the above.

  17. Dee says:

    NASA manually added half a degree of warming to the US 20th century temperature record through “adjustments”.

    They tell us here: “These adjustments caused an increase of about 0.5°C in the US mean for the period from 1900 to 1990.”

    https://data.giss.nasa.gov/gistemp/faq/

    Research prior to this showed NO warming trend:

    U.S. Data Since 1895 Fail To Show Warming Trend

    https://www.nytimes.com/1989/01/26/us/us-data-since-1895-fail-to-show-warming-trend.html

  18. Dave says:

    Tony’s point of the lock step correlation of global temperatures between 5 different climate agencies seems indicates collusion is valid. Given that the surface temperature data set they are working with is riddled with temporal and spacial deficiencies, making any conclusions from these data at a 95% confidence level is absurd, let alone having 5 independent agencies get essentially the same results. However, when I was looking at satellite data recently, is seems that the UAH and RSS data also track very closely. Since these are much more reliable data sets, this correlation is likely real. But, you can be pretty sure that this will end up in a SkepticalScience or Potholer rebuttal. See attached graph. Be prepared.

  19. gregole says:

    Yes there’s M@nn-Made Climate change. Both cooling and heating. And it is dangerous. I mean, it can’t possibly be a good idea to base public policies on entirely fabricated junk science.

  20. Grilled Tomatoes says:

    Fine work, as usual, Mr. H.
    Also, interesting (not the first time you’ve pointed this out) that a couple of the articles you posted referred to pre-1979 satellite data for the Arctic showing lots of ice!

  21. Mats Jangdal says:

    Very telling article about the falsehood of AGW.
    I must ask though, are all those news clips real? It seems so unlikely anyone would come up with the idea of promoting a manmade climate scare when history is so easily checked. It’s jaw dropping!
    How stupid are the alarmists? How stupid do they think we are?

    In Swedish there is a word for all the complexities of natural variations in not only weather, but climate and any other phenomena influencing the conditions for life. It sounds like oars moan when pronounced. It tells that the differences between years form a natural margin for variations to occur within.
    Yet many swedes fail to recognise the importance of this expression in relation to the dogma of “climate change”. They can say stupid things like; well that’s fine when it comes natural variations for growing potatoes or prunes, but this is CATASTROPHIC GLOBAL WARMING we are talking about!
    Longer explanation in English here. https://www.frihetsportalen.se/2012/07/years-margin/

  22. Patrick healy says:

    Brilliant Mr Heller.
    Wish it could be more widely promulgated over here in the Walter mitty land of Britain.
    Many thanks and keep warm.
    We are at present global warming refugees in Cyprus (from the Scottish gulag).
    Spending the grandchildren inheritance in 5 star global warming luxury.

  23. Thanks for the new stuff you have revealed in your article. One thing I’d like to comment on is that FSBO relationships are built over time. By launching yourself to owners the first weekend break their FSBO is announced, ahead of the masses commence calling on Wednesday, you make a good link. By sending them resources, educational supplies, free reports, and forms, you become a good ally. If you take a personal fascination with them along with their problem, you produce a solid relationship that, on many occasions, pays off in the event the owners opt with a realtor they know along with trust — preferably you.

Leave a Reply to gregole Cancel reply

Your email address will not be published. Required fields are marked *