
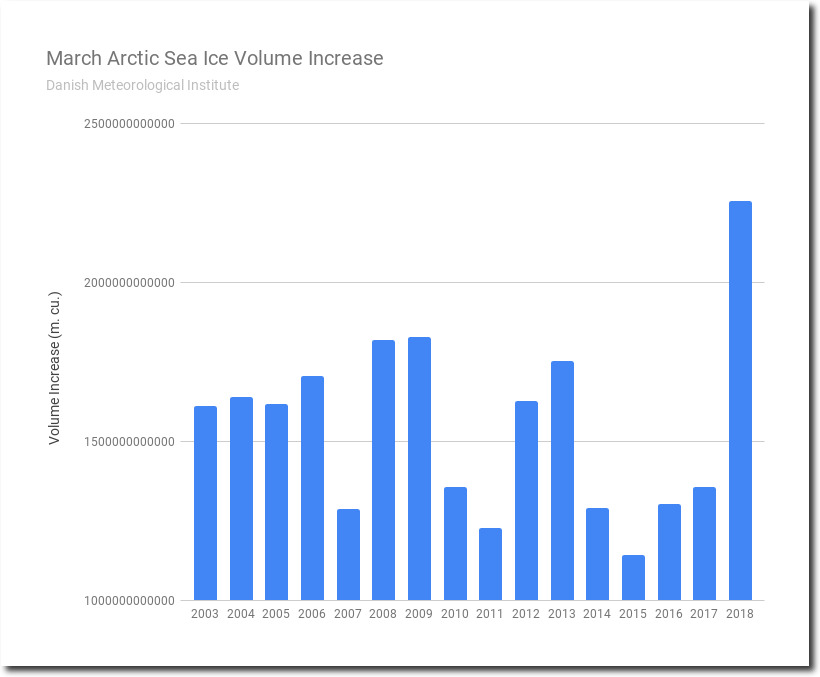
The Arctic sea ice scam began to rapidly unravel last March, when all records for Arctic sea ice volume gain were blown away.
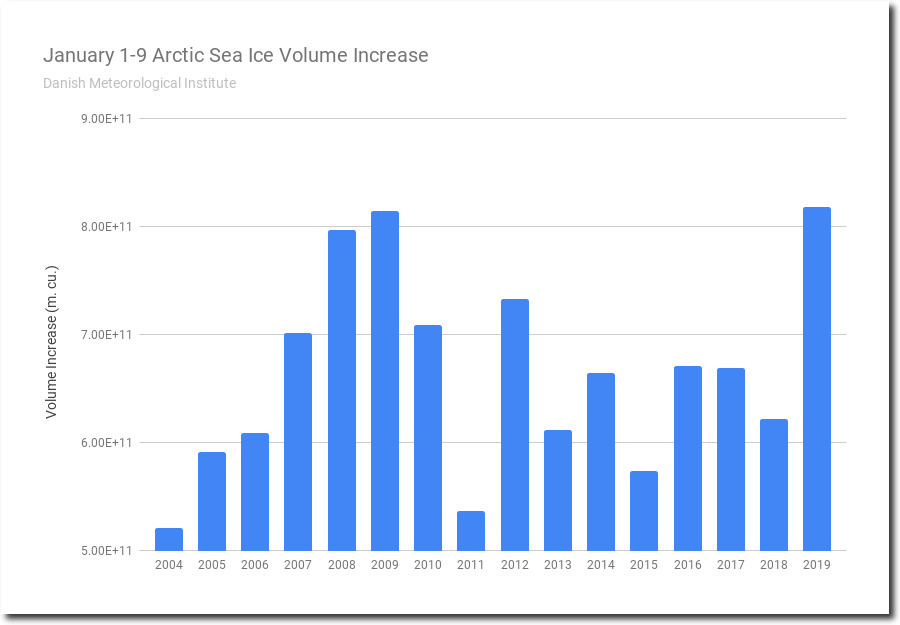
So far this month, ice volume gain has also been a record high.
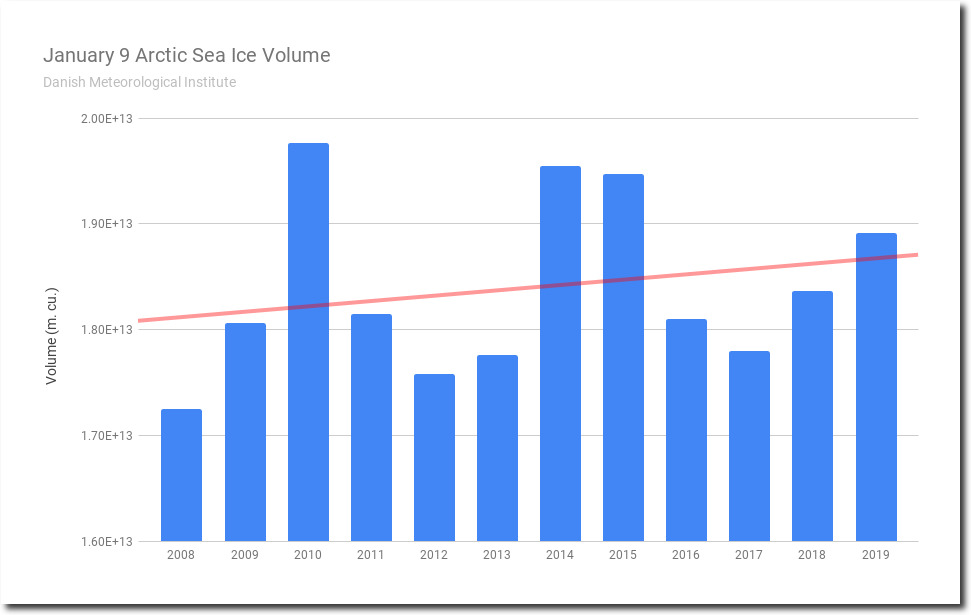
And January 9 Arctic sea ice volume has been increasing for over a decade.
The area of the Arctic covered with thick sea ice has greatly expanded over the past eleven years.
Ice extent is very close to the 1981-2010 median, and rapidly increasing.
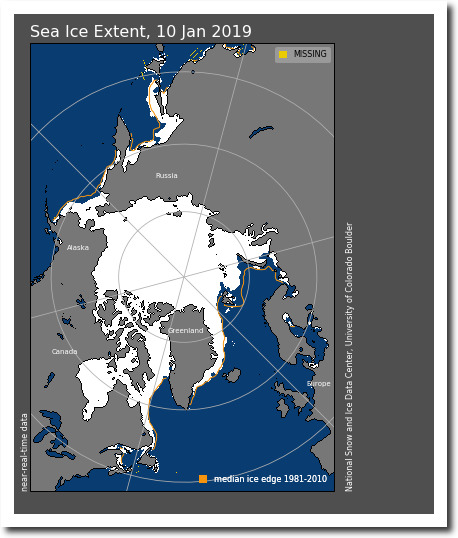
N_20190110_extn_v3.0.png (420×500)
My Northwest Passage cruise had to be cancelled last year, because of too much ice.
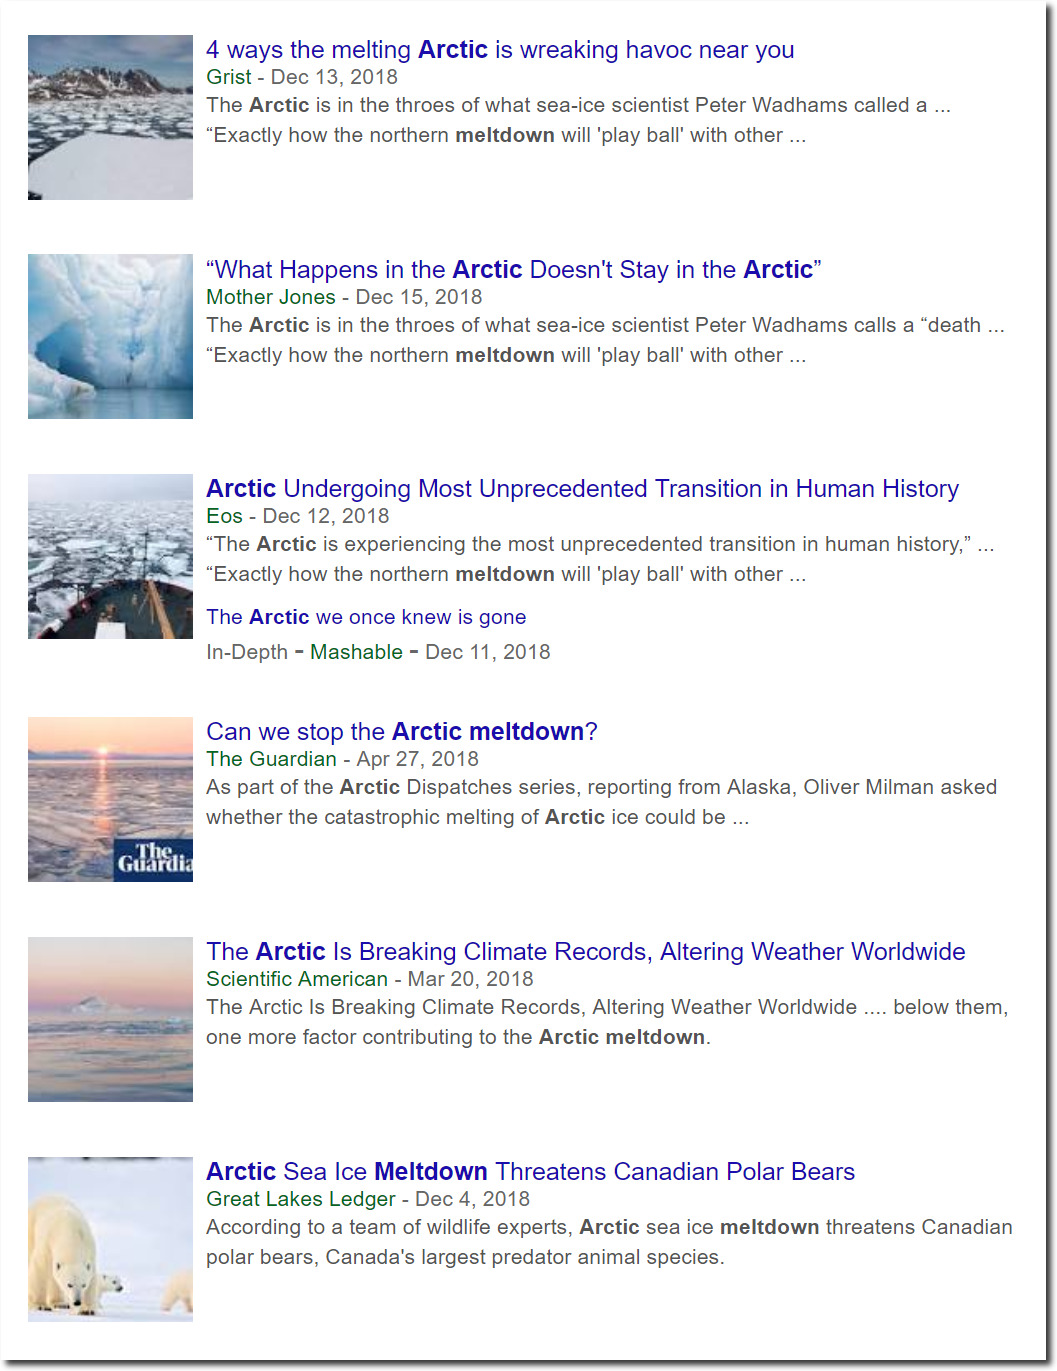
Climate experts describe these record large increases in ice as an unprecedented meltdown.
