
The Arctic is very important for people pushing global warming, because that is where they claim most of the warming is occurring.
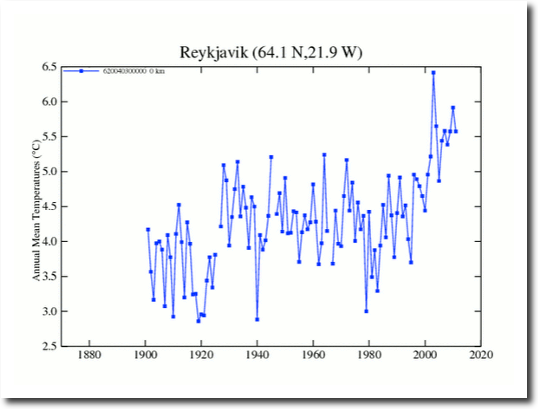
In NASA GISS Version 2 (V2) – Iceland was warmer in the 1940s than in recent years.
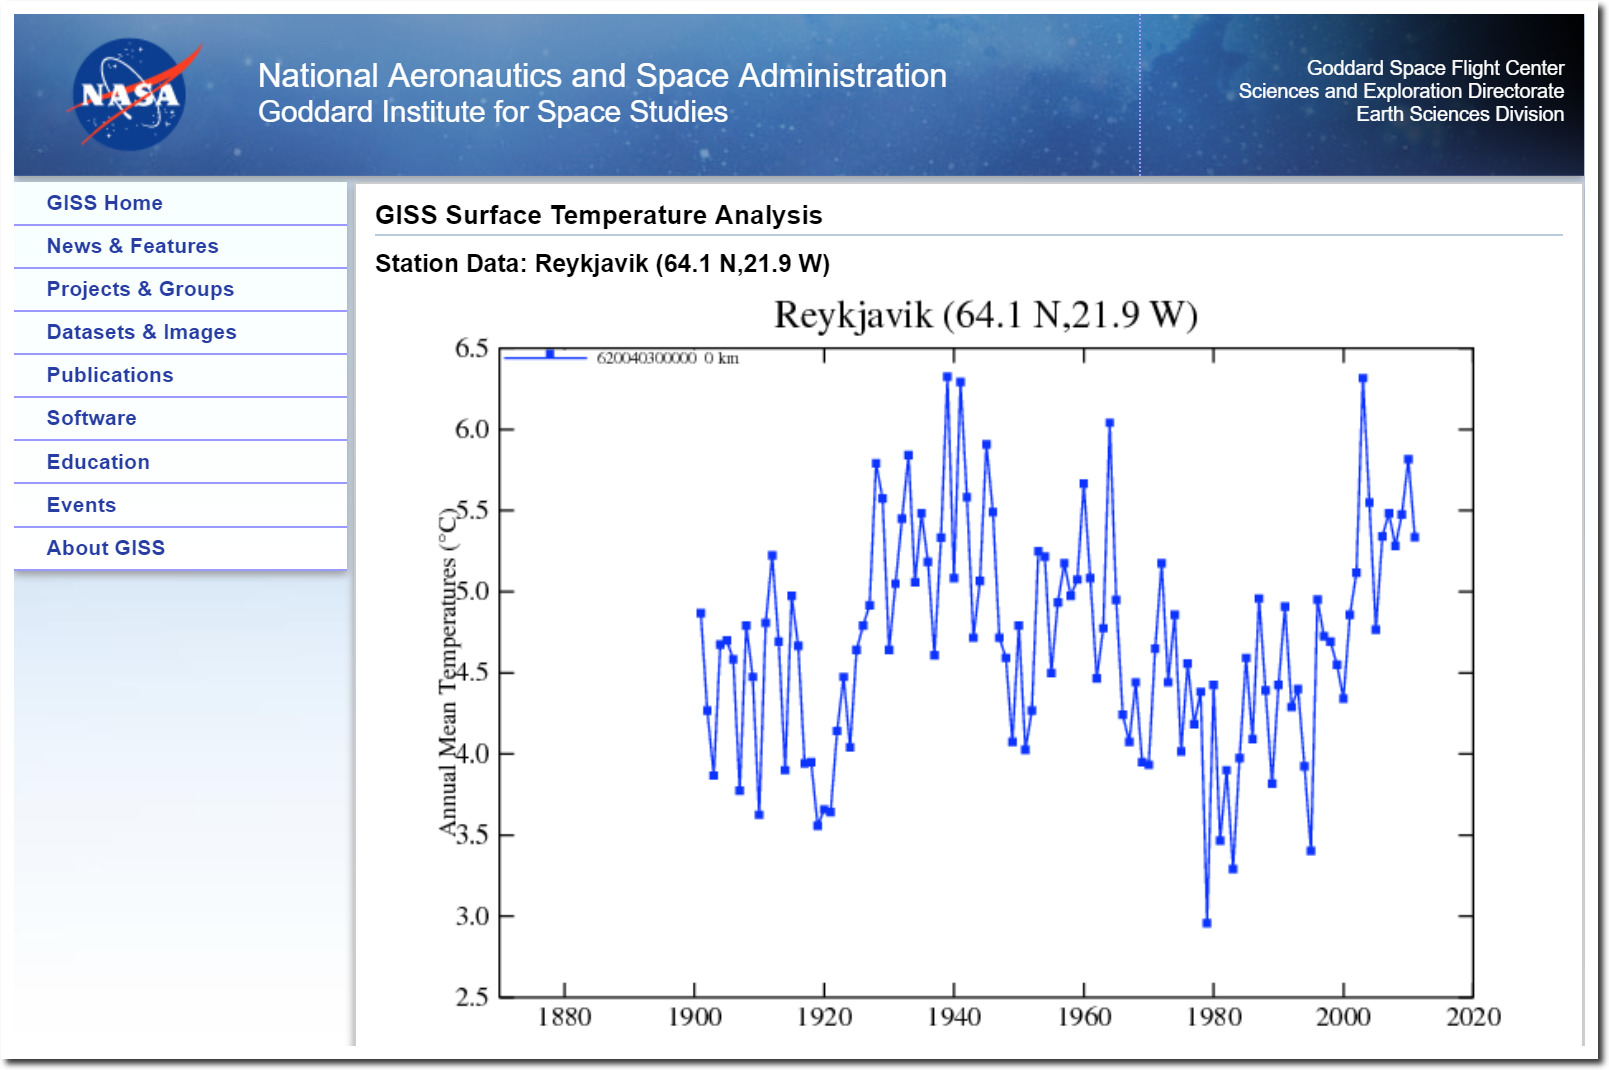
Data.GISS: GISS Surface Temperature Analysis
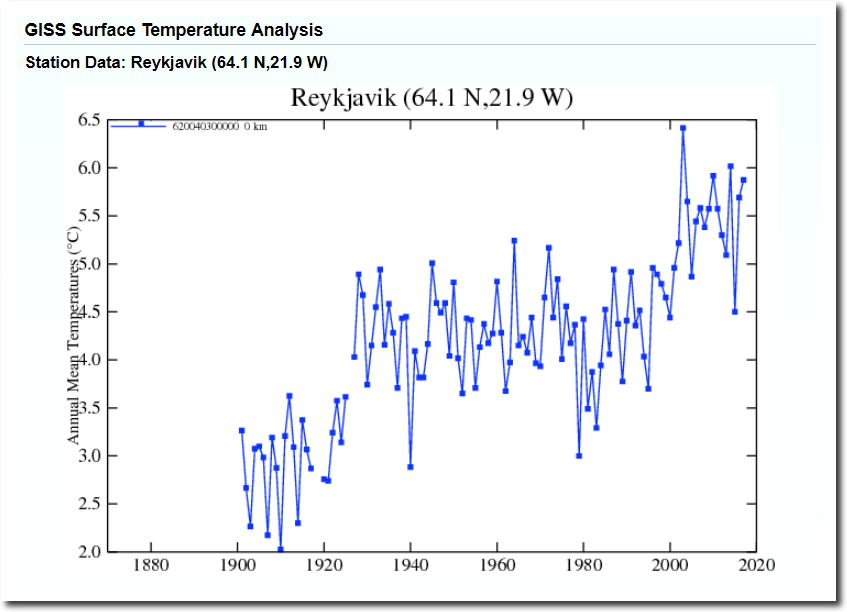
The current version V4 has massively cooled the past, to make it look like Iceland is warming.
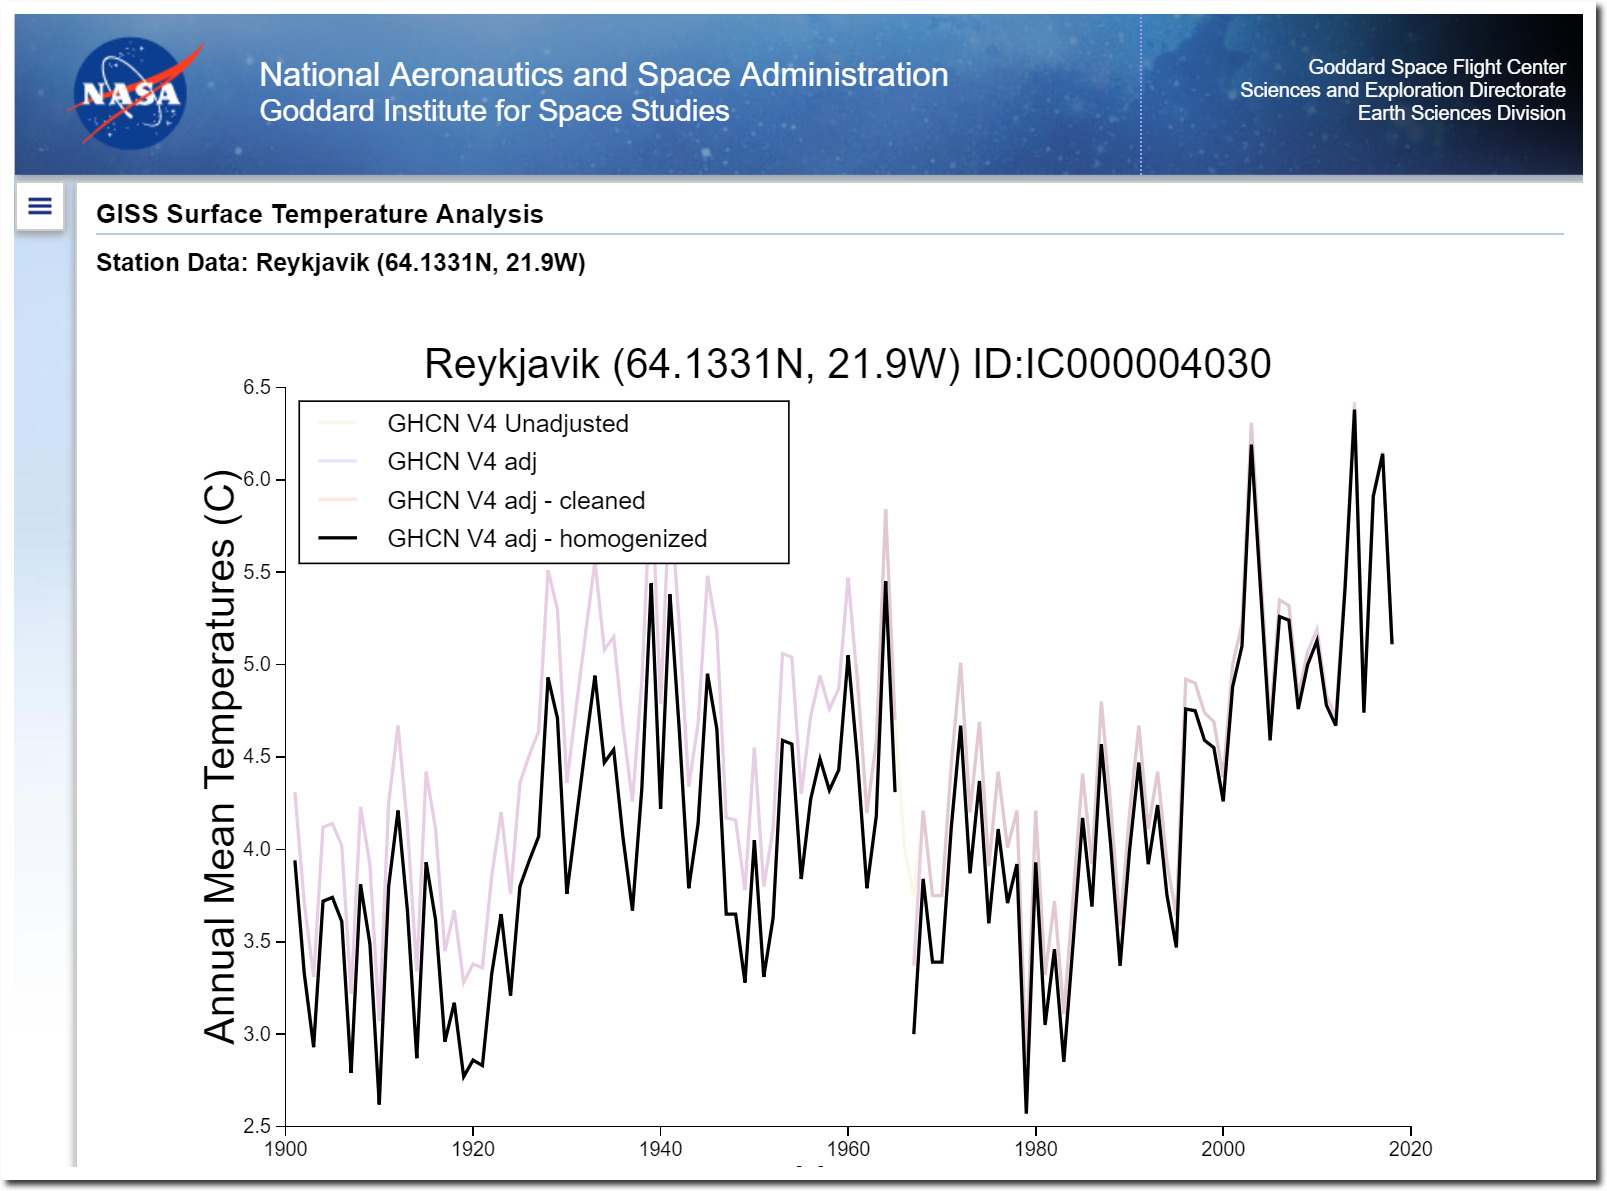
Data.GISS: GISS Surface Temperature Analysis
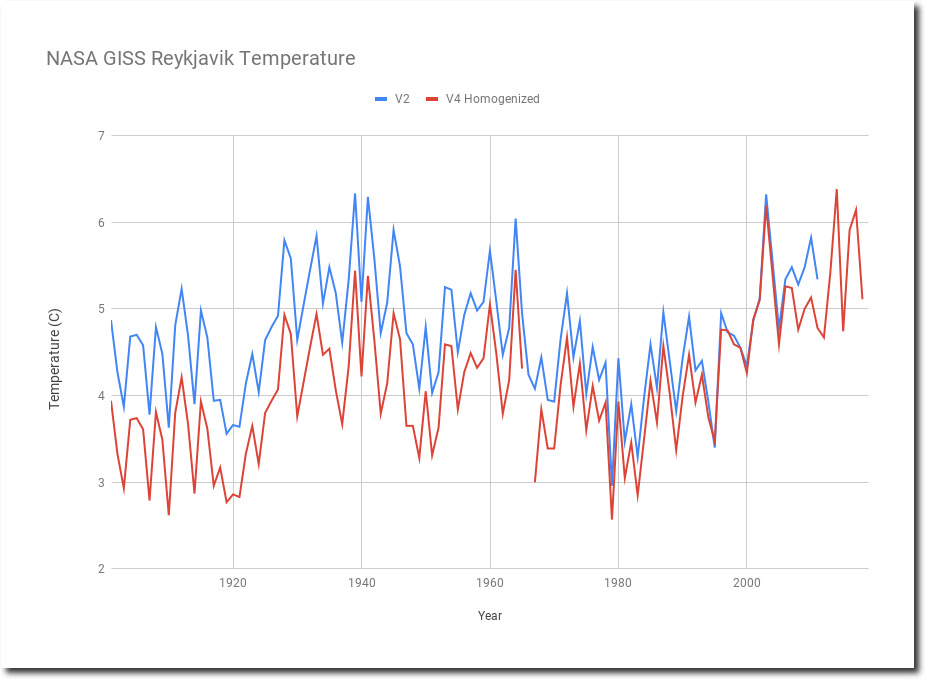
This graph shows how NASA has rewritten Iceland’s history.
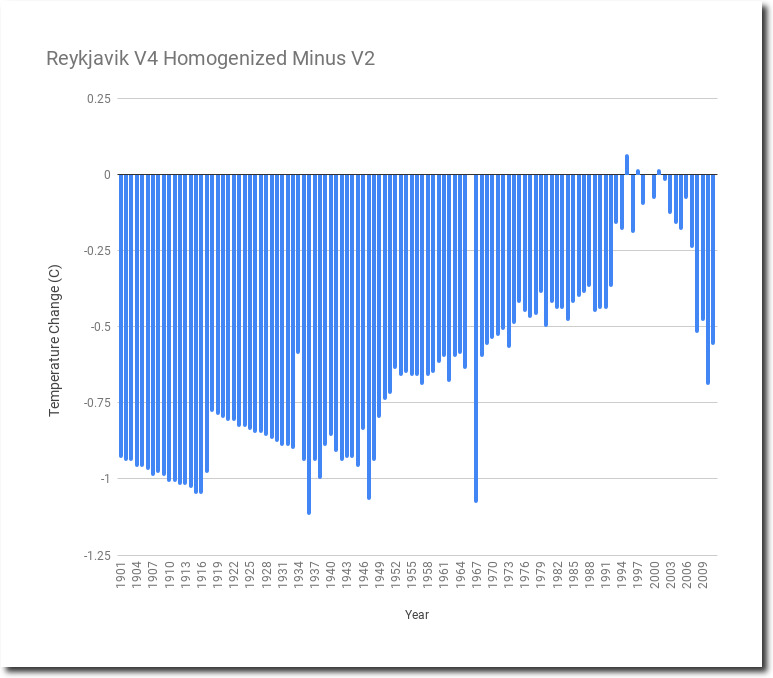
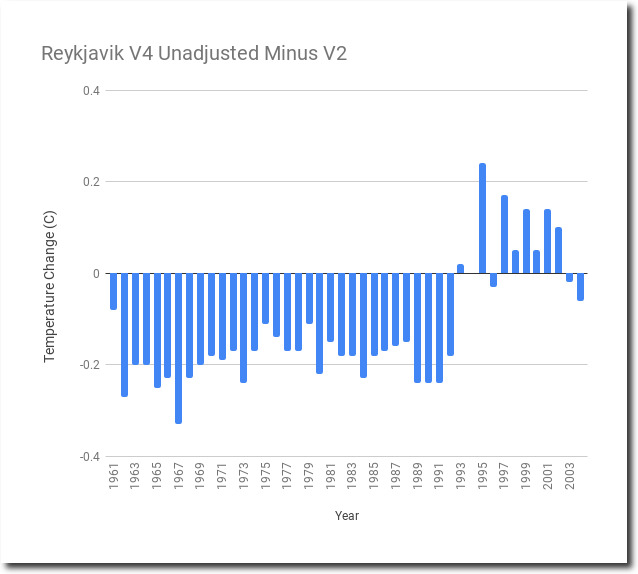
The next graph shows the magnitude of NASA tampering. The past has been cooled about 1C.
What is even more disturbing, is that NASA is now tampering with unadjusted data too. They also seem to have lost the pre-1961 and post-2004 unadjusted data. How does unadjusted data change and disappear over time?
Data.GISS: GISS Surface Temperature Analysis
NASA has a long history of tampering with Iceland temperature data, and the numbers continuously and dramatically change.
V2 adjusted.
Here is another version of the V2 adjusted graph which was captured in 2012. It is different from the previous versions.
And another version from 2014 – again different from the previous three versions, but with the 1940’s warmth removed.
A fifth version was captured during October 2017, with the 1940’s warmth still removed in their final, homogenized data.
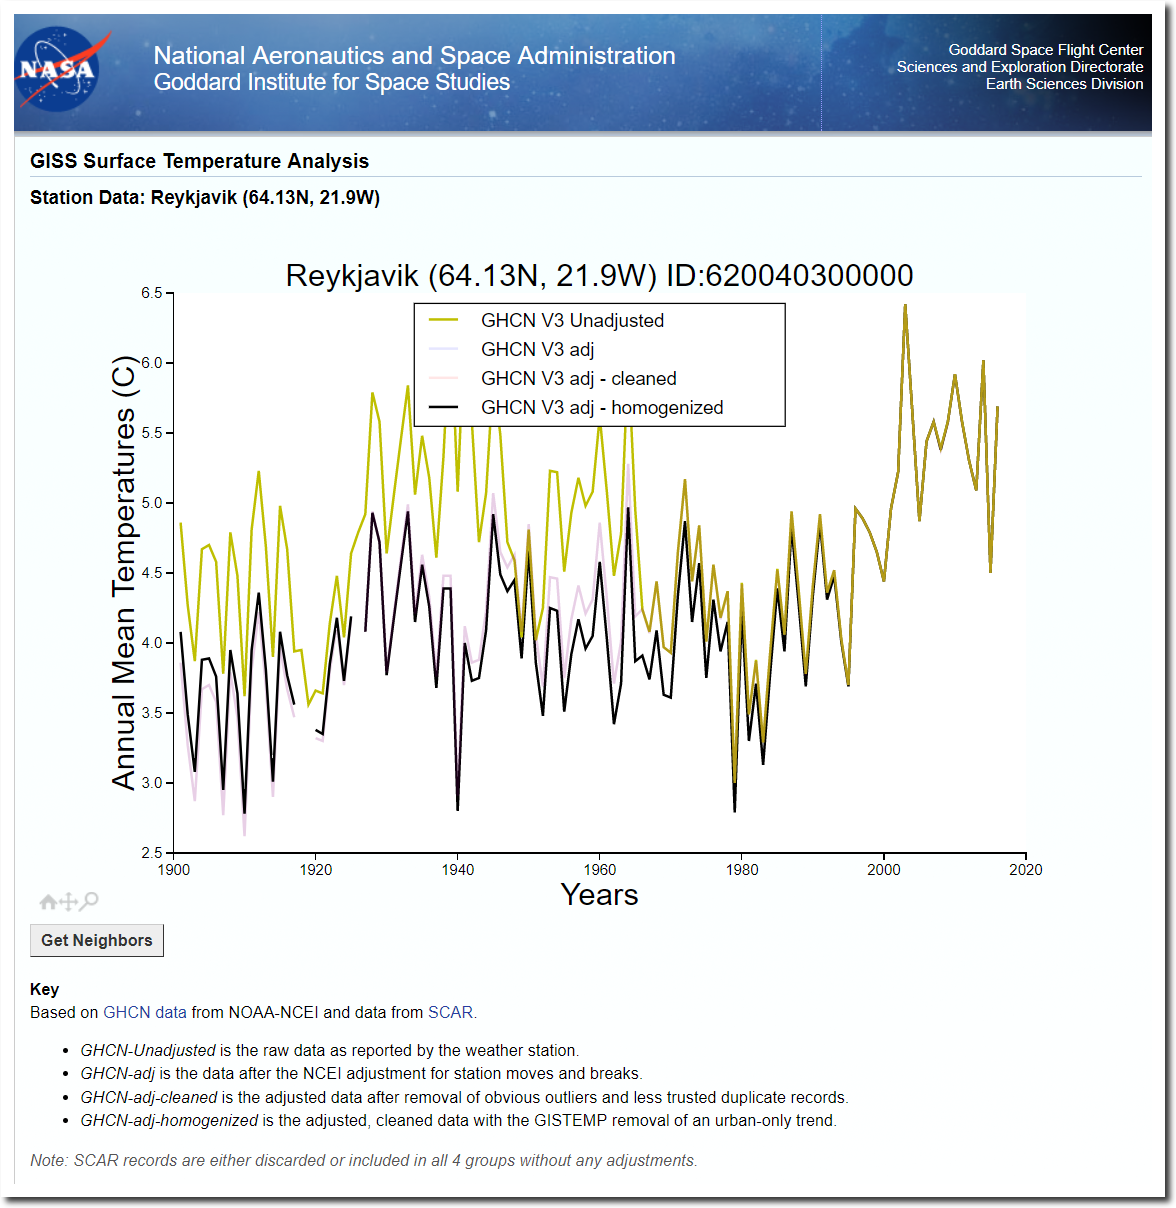
October 2017 V3 Measured Vs Homogenized
The May 2018 NASA homogenized graph had restored most of the 1940’s warmth – indicating that there was never any reason to tamper with the data.
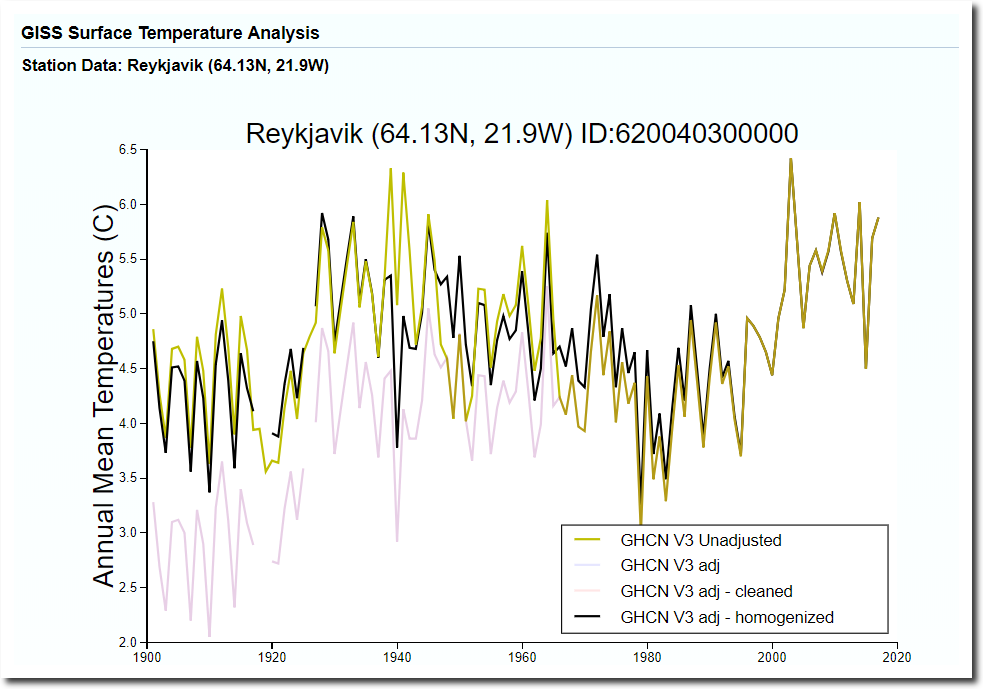
May 2018 Measured Vs. Homogenized
But the July 2018 NASA adjusted temperature graph removed the 1940’s warmth.
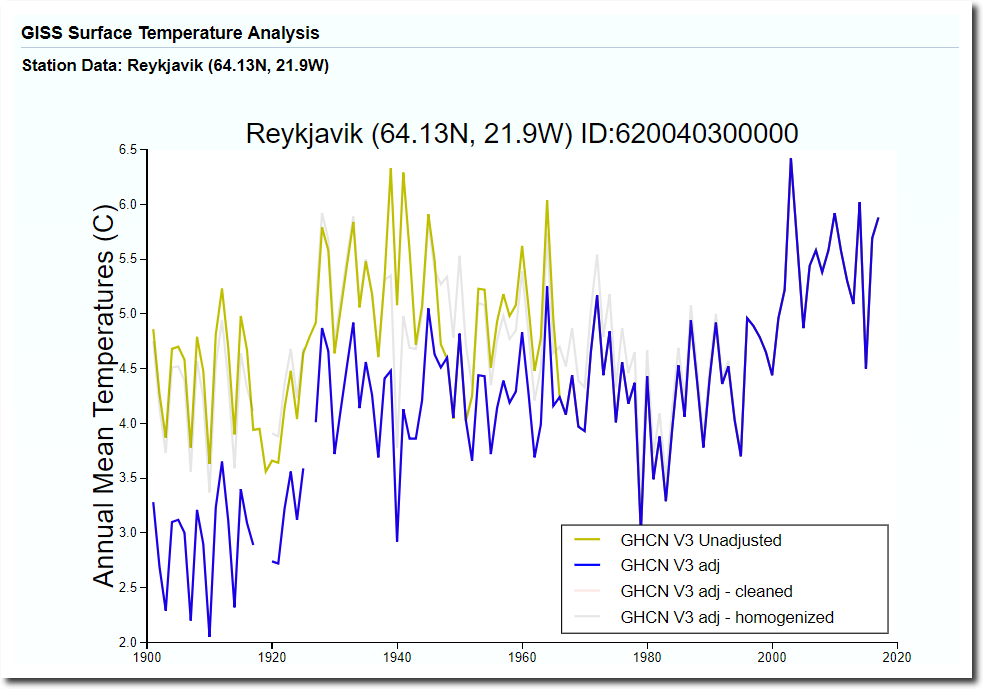
May 2018 Measured Vs. Adjusted
The person in charge at the Icelandic Met Office said four years ago : The GHCN “corrections” are grossly in error in the case of Reykjavik.
From: Trausti Jónsson
To: paul homewood
Cc: Halldór Björnsson
Sent: Monday, 23 January 2012, 17:40
Subject: Re: monthly temperatures
Hi Paul.We have sent a questions to the GHCN database regarding this and they will look into the problem. Regarding your questions:
a) Were the Iceland Met Office aware that these adjustments are being made?No we were not aware of this.
b) Has the Met Office been advised of the reasons for them?No, but we are asking for the reasons
c) Does the Met Office accept that their own temperature data is in error, and that the corrections applied byGHCN are both valid and of the correct value? If so, why?
The GHCN “corrections” are grossly in error in the case of Reykjavik but not quite as bad for the other stations. But we will have a better look. We do not accept these “corrections”.
d) Does the Met Office intend to modify their own temperature records in line with GHCN?No.
No changes have been made in the Stykkisholmur series since about 1970, the Reykjavík and Akureyri series that I sent you have been slightly adjusted for major relocations and changes in observing hours. Because of the observing hour changes, values that where published before 1924 in Reykjavík and before 1928 in Akureyri are not compatible with the later calculation practices. For other stations in Iceland values published before 1956 are incompatible with later values except at stations that observed 8 times per day (but the differences are usually small). The linked paper outlines these problems (in English):
http://www.vedur.is/media/vedurstofan/utgafa/greinargerdir/1995/Climatological1960.pdf
The monthly publication Vedrattan 1924 to 1997 (in Icelandic) is available at:
http://timarit.is/view_page_init.jsp?pubId=278&lang=is&navsel=666
and earlier data (in Icelandic and Danish – with a summary in French) at:
http://timarit.is/view_page_init.jsp?pubId=240&lang=is&navsel=666
http://timarit.is/view_page_init.jsp?pubId=241&lang=is&navsel=666
Monthly data from all stations from 1961 onwards :
http://www.vedur.is/Medaltalstoflur-txt/Manadargildi.html
Best wishes,
Trausti J.
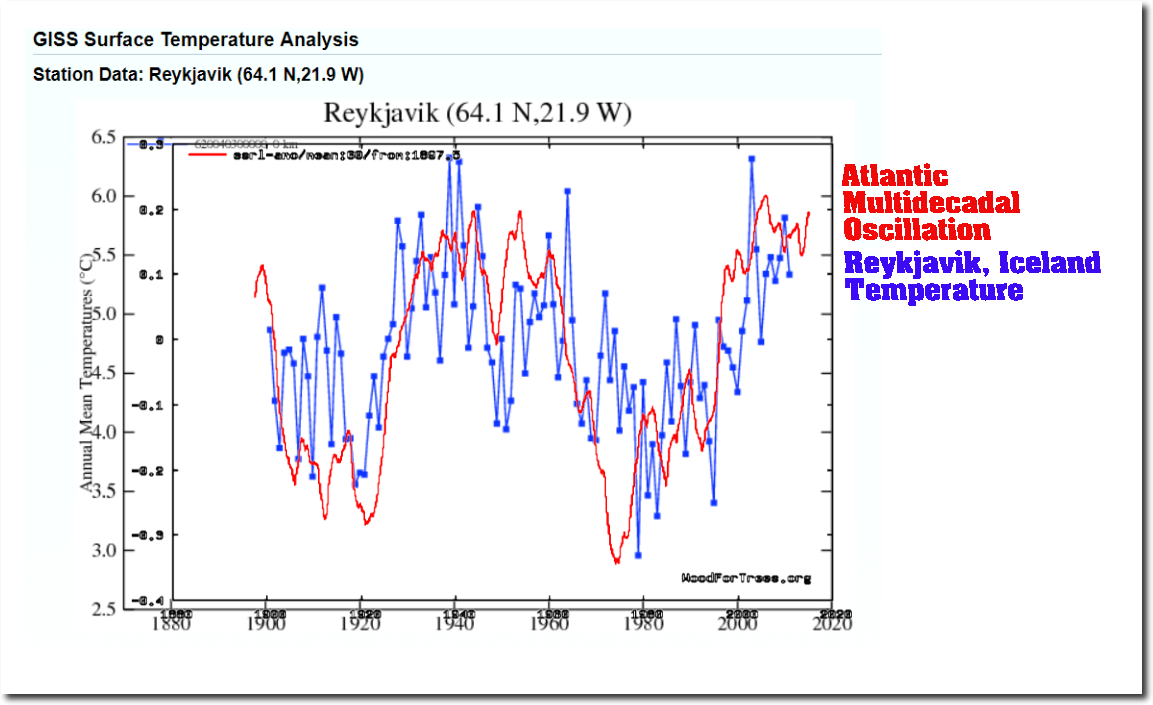
The reason it is so important for climate scientists to make the 1940’s warmth disappear, is that it shows what actually drives the climate – and destroys their multi-billion dollar scam.

