Massart said Schlesinger studied climate change and global warming at UCLA in the 1960s and went around trying to stop companies from polluting, even though nobody knew what global warming was at the time.
“Everyone just thought he was crazy, and he went on to do all this research to really open everyone’s eyes, and now climate change is really recognized as a tremendous thing that we must pay attention to around the world,” Massart said. “He really made a significant impact there.”
“Professor Schlesinger was one of the most intelligent people I have ever worked with. As a professor, he was very demanding of his graduate students, always insisting on the highest quality work, and as a result, his students have gone on to very successful careers,” Rauber said.
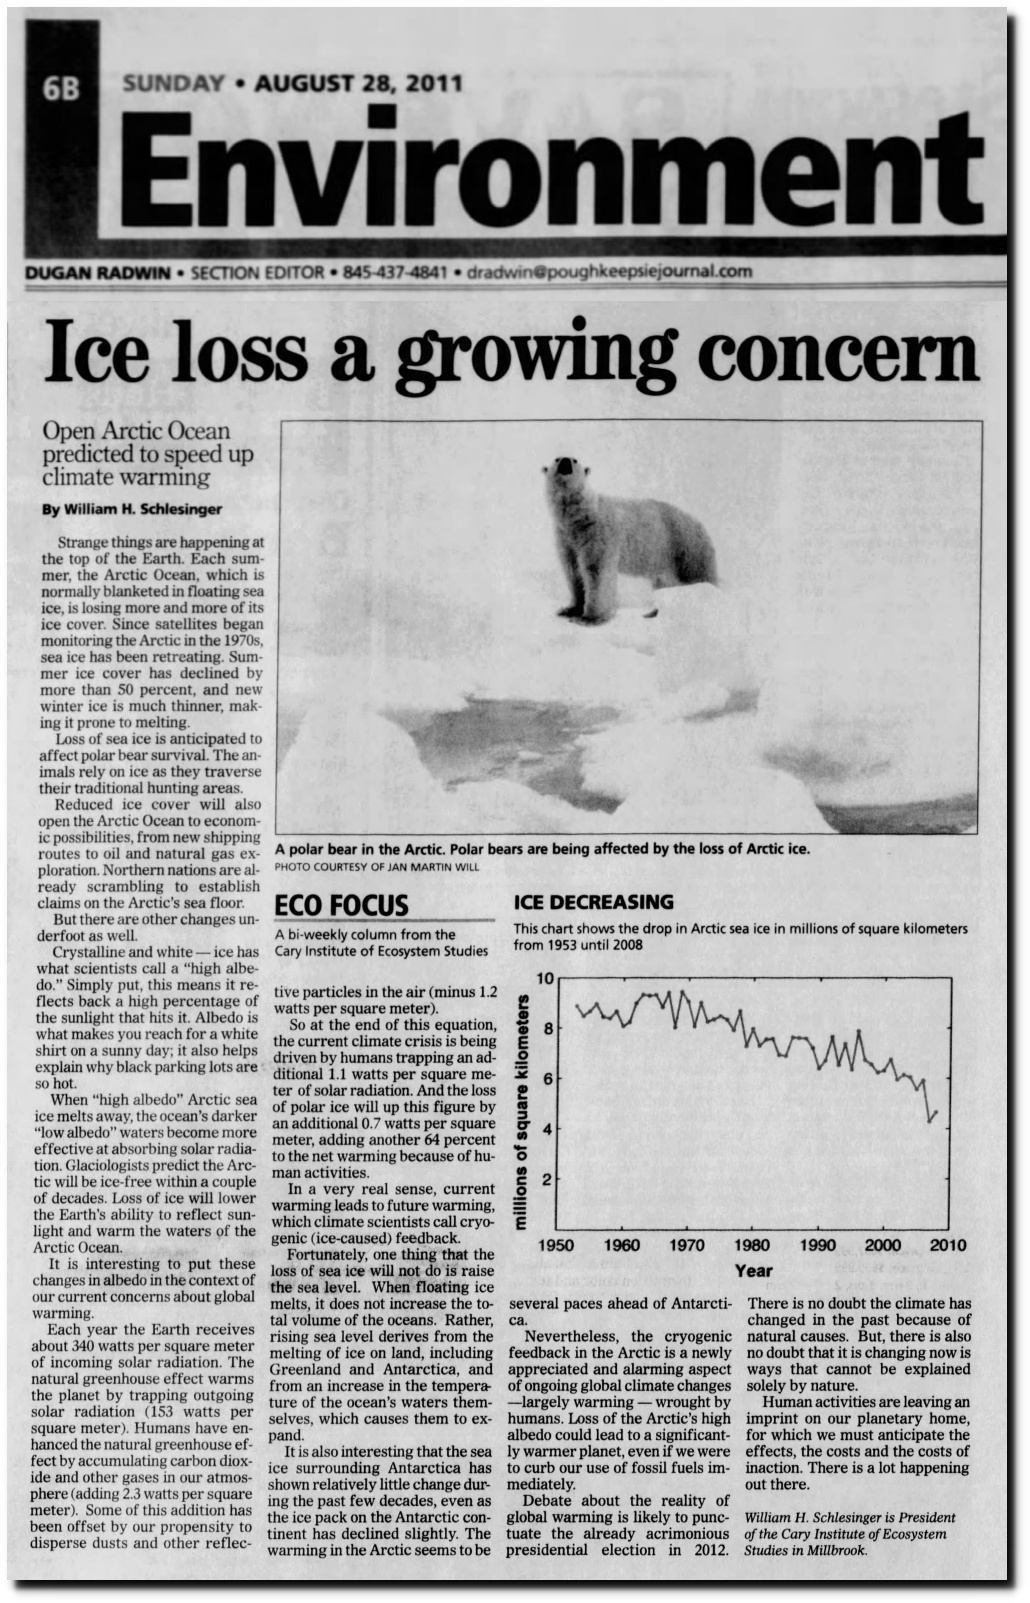
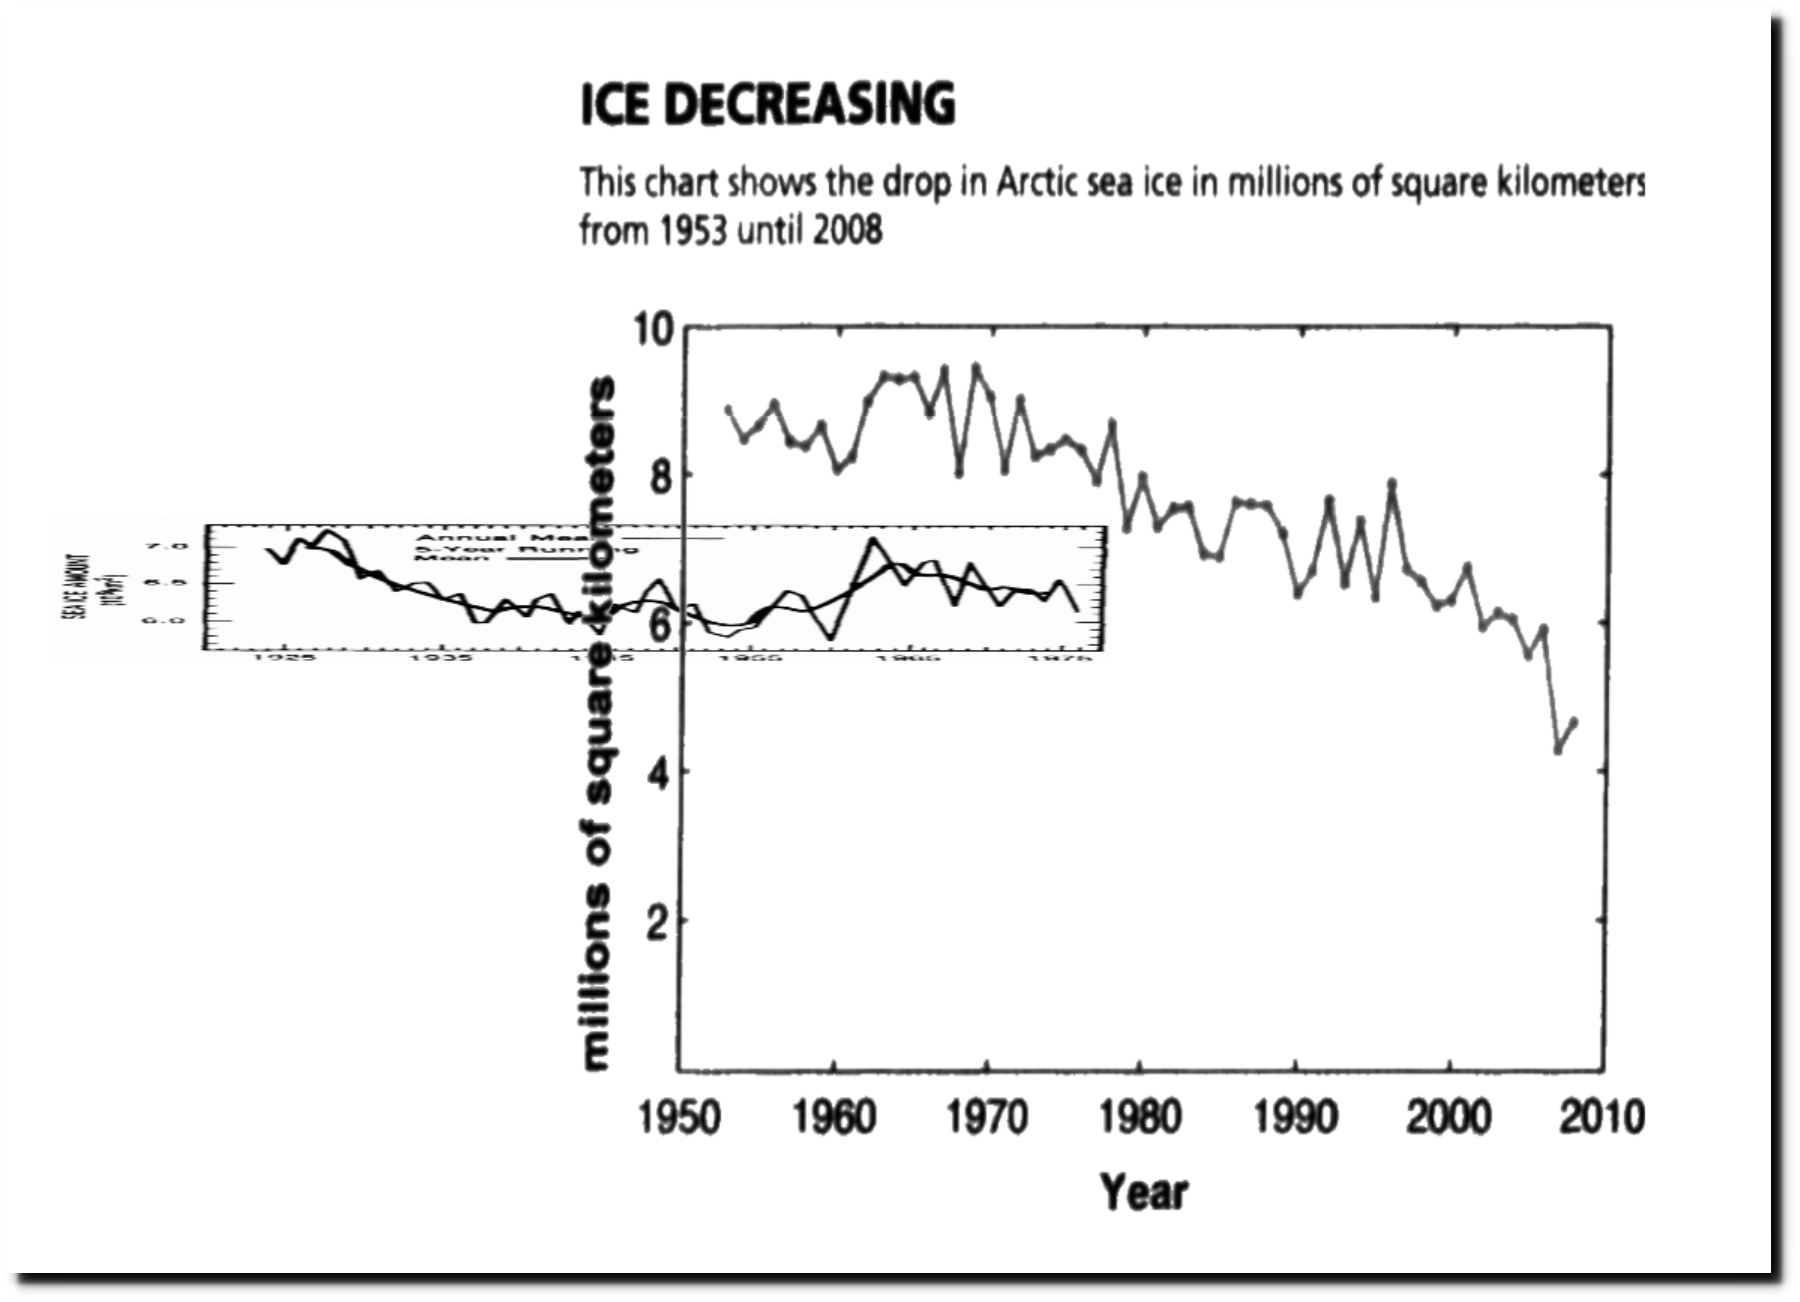
This 2011 article by Michael Schlesinger has an Arctic sea ice graph which peaked before 1970, and showed a steady decline ever since. He said “Strange things are happening at the top of the earth.”

28 Aug 2011, Page 22 – Poughkeepsie Journal at Newspapers.com
His graph looks nothing like the graphs from Vinnikov in the 1985 DOE Report and the 1990 IPCC report.

Projecting the climatic effects of increasing carbon dioxide
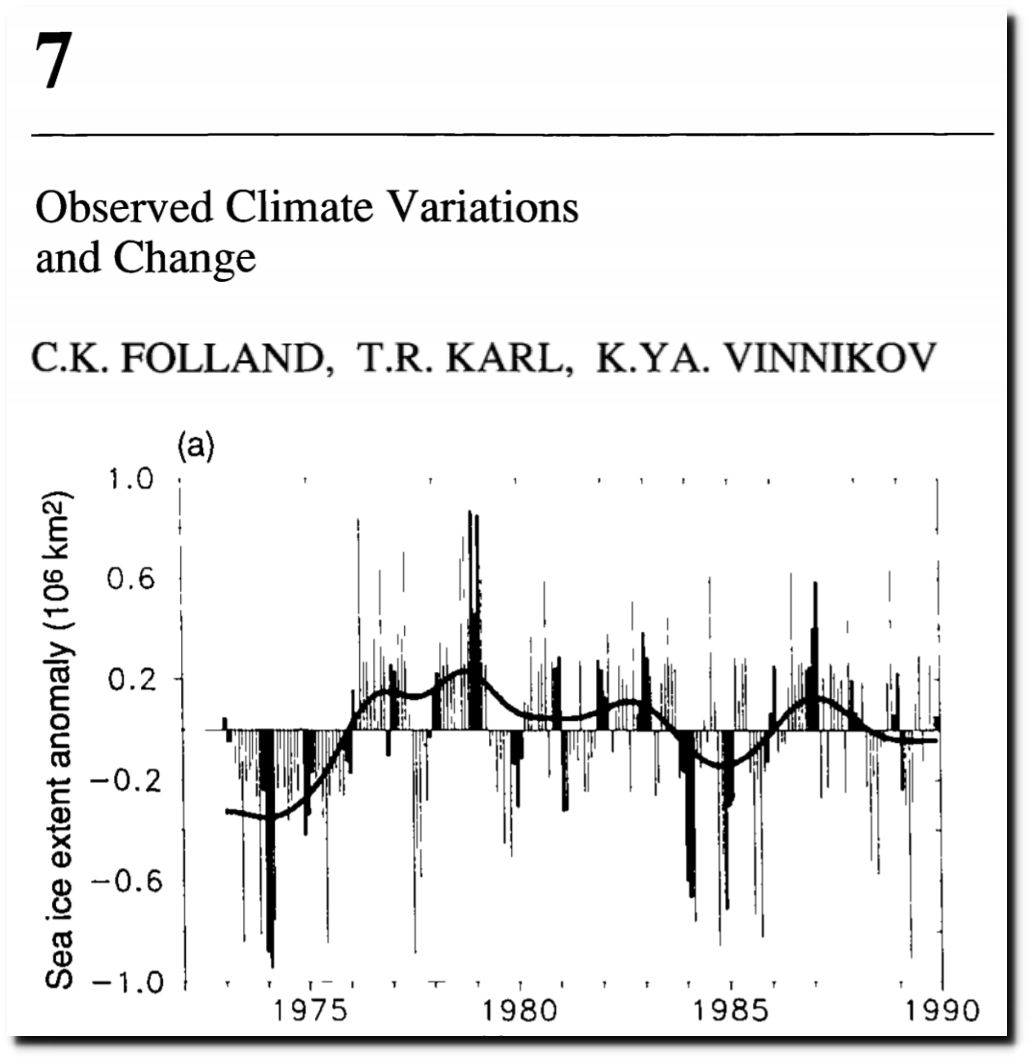
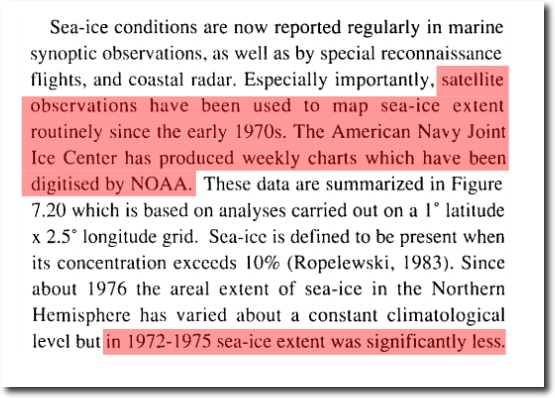
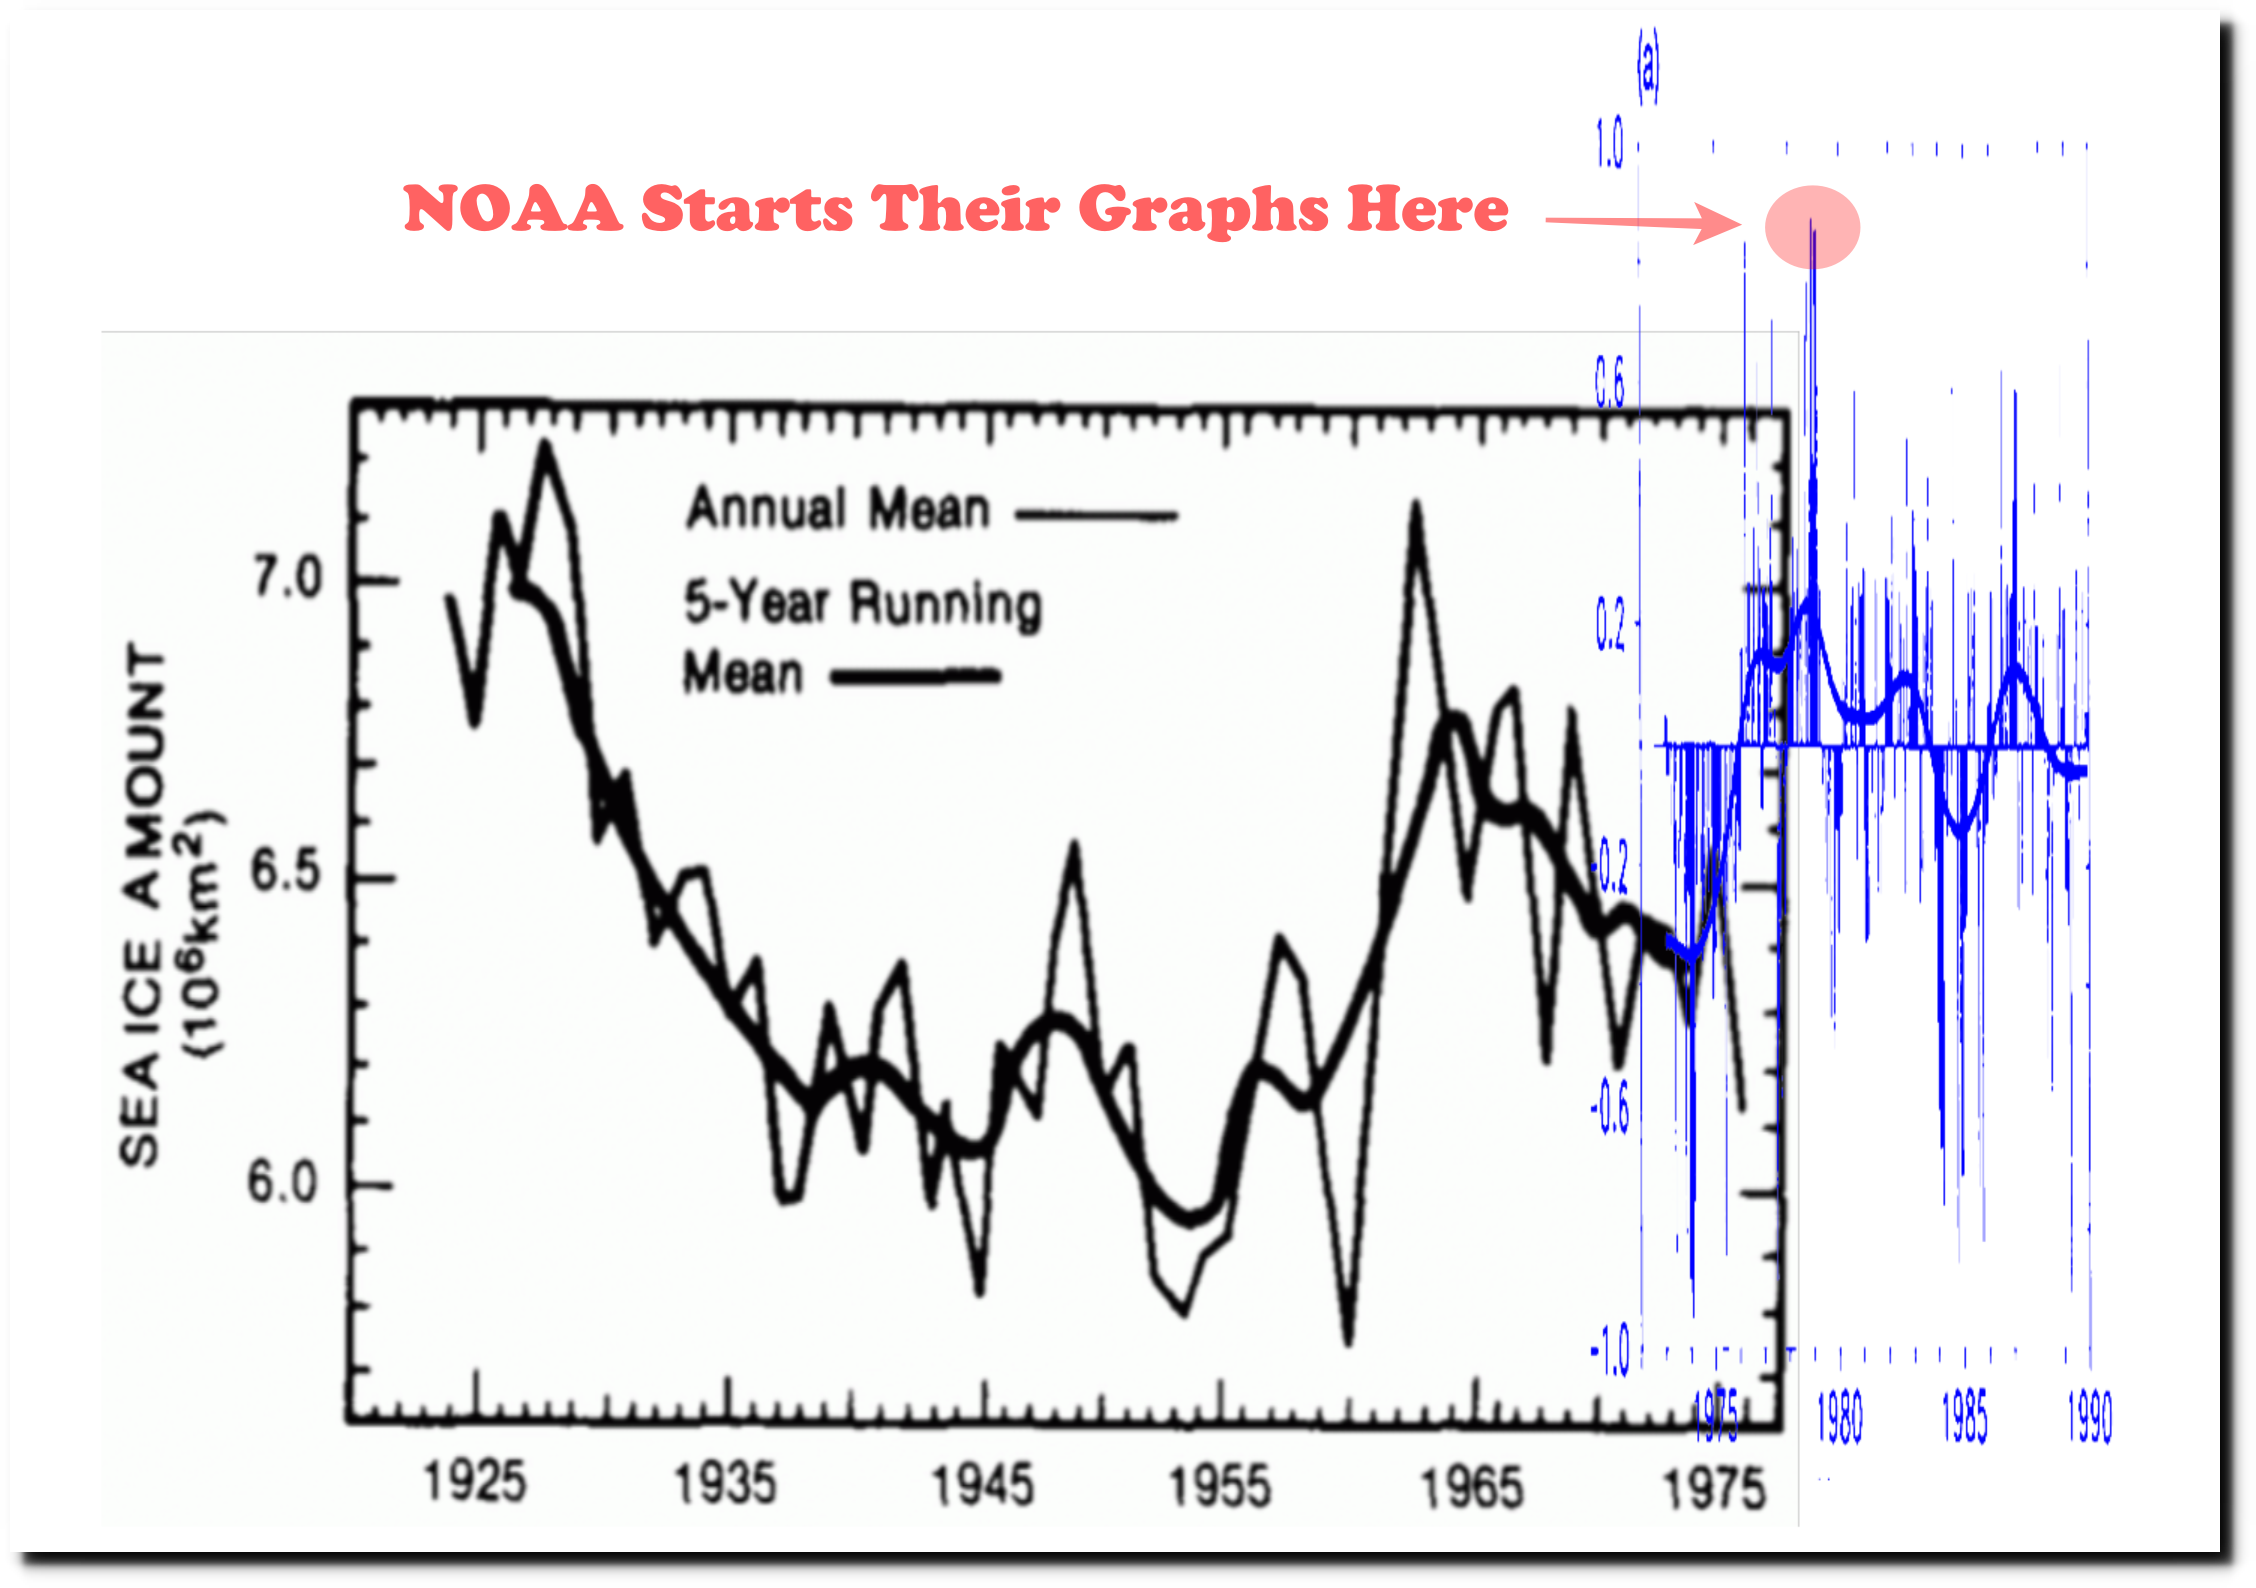
Vinnikov showed a sharp gain in ice during the 1970s and no net change in sea ice extent from 1963 to 1990. The graph below merges the 1985 and 1990 Vinnikov graphs at the same scale on both axes.

Schlesinger showed a decline of 2 million km. sq. from 1963 to 1990.

It was widely reported that Arctic sea ice increased during the 1970s, but Schlesinger showed a sharp decline..
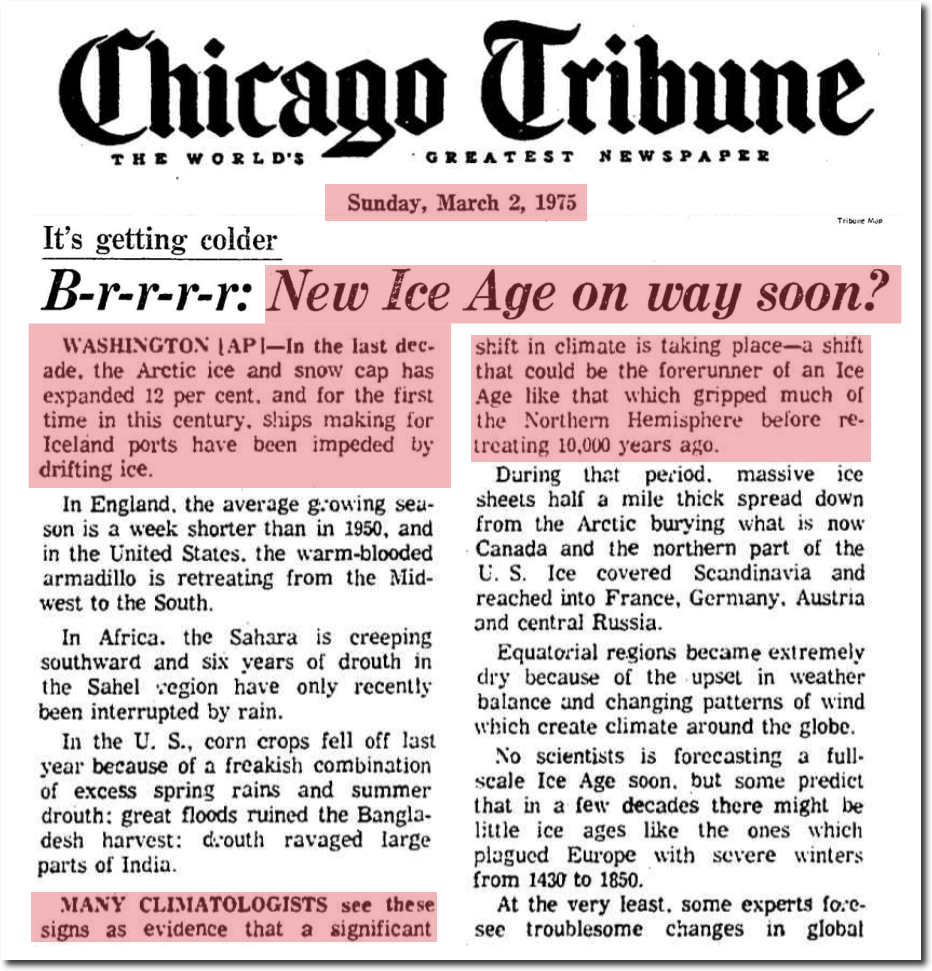
March 2, 1975 – B-r-r-r-r: New Ice Age on way soon? | Chicago Tribune Archive
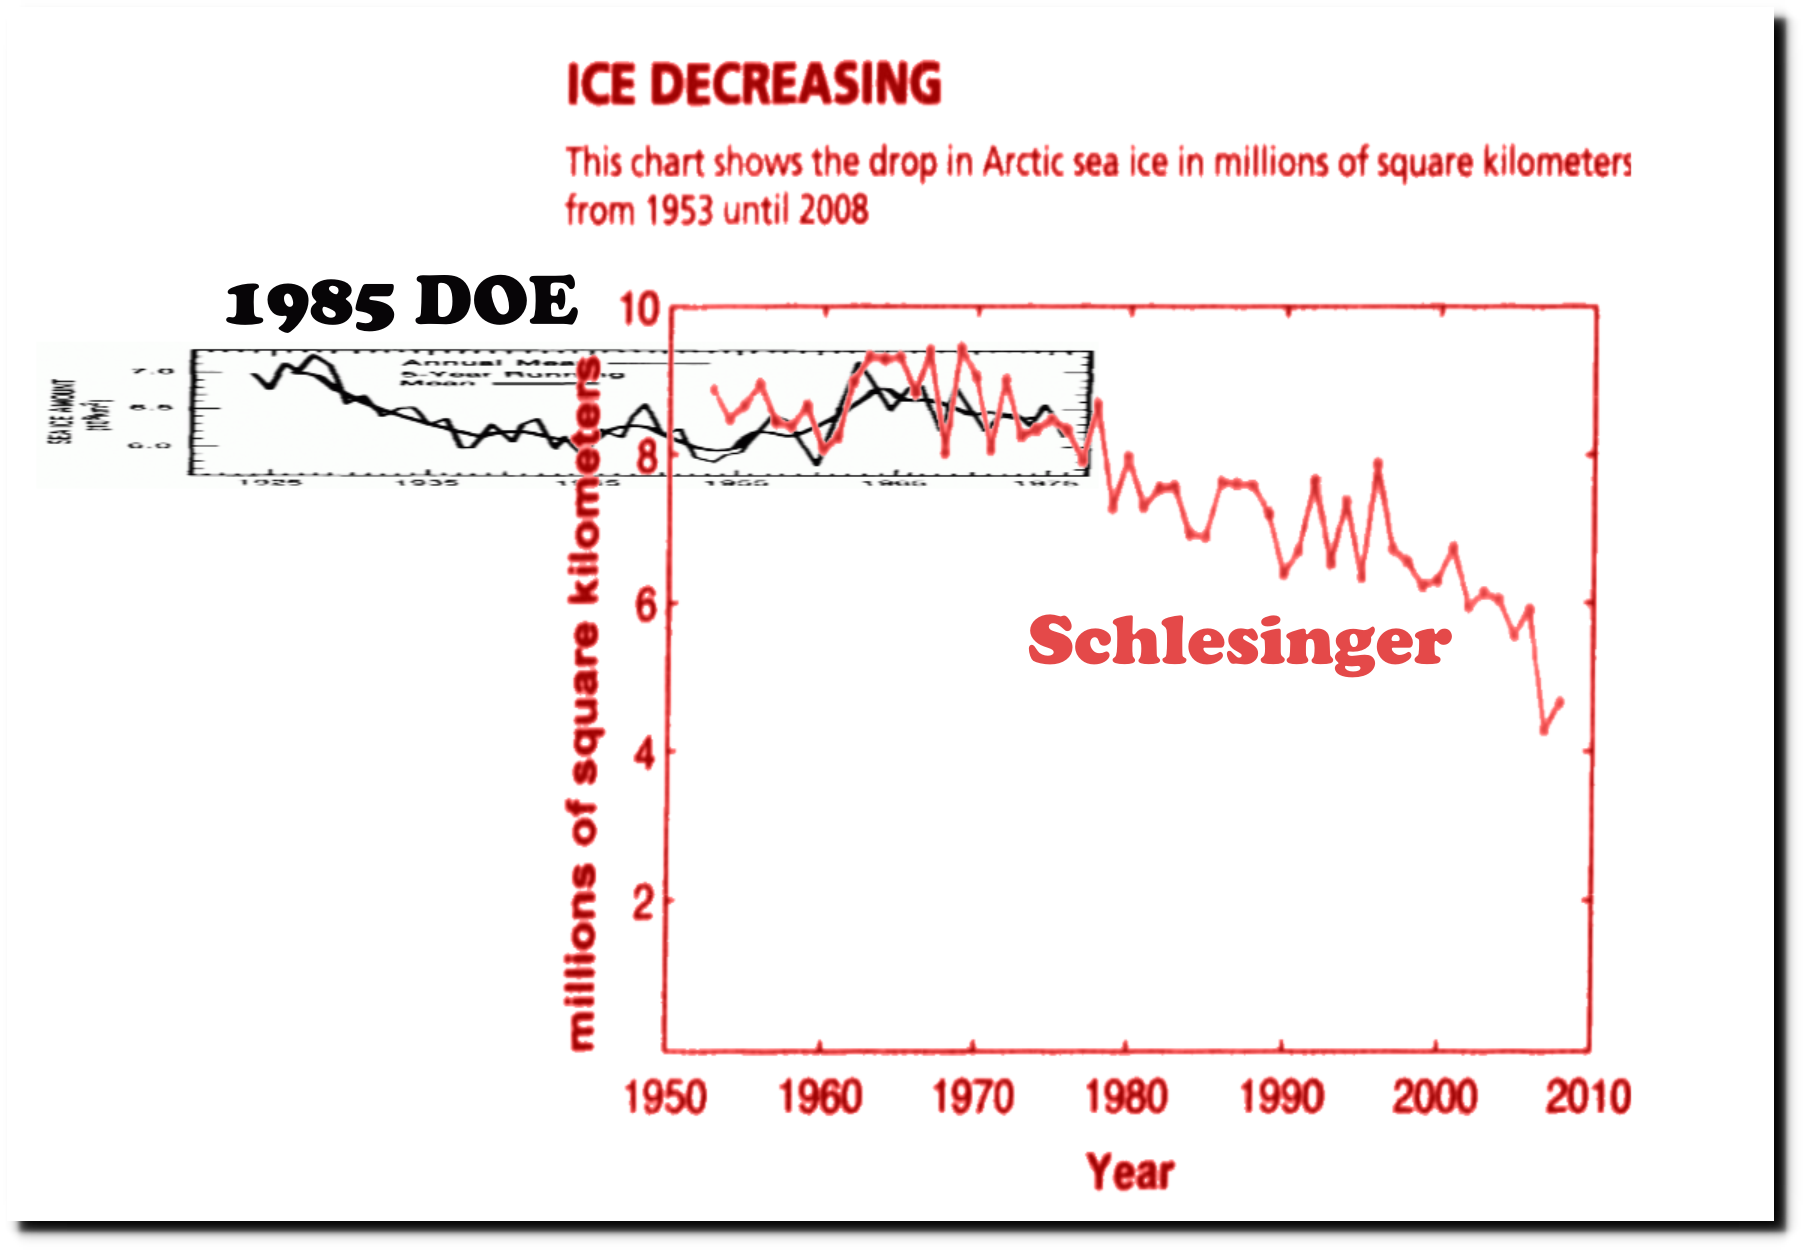
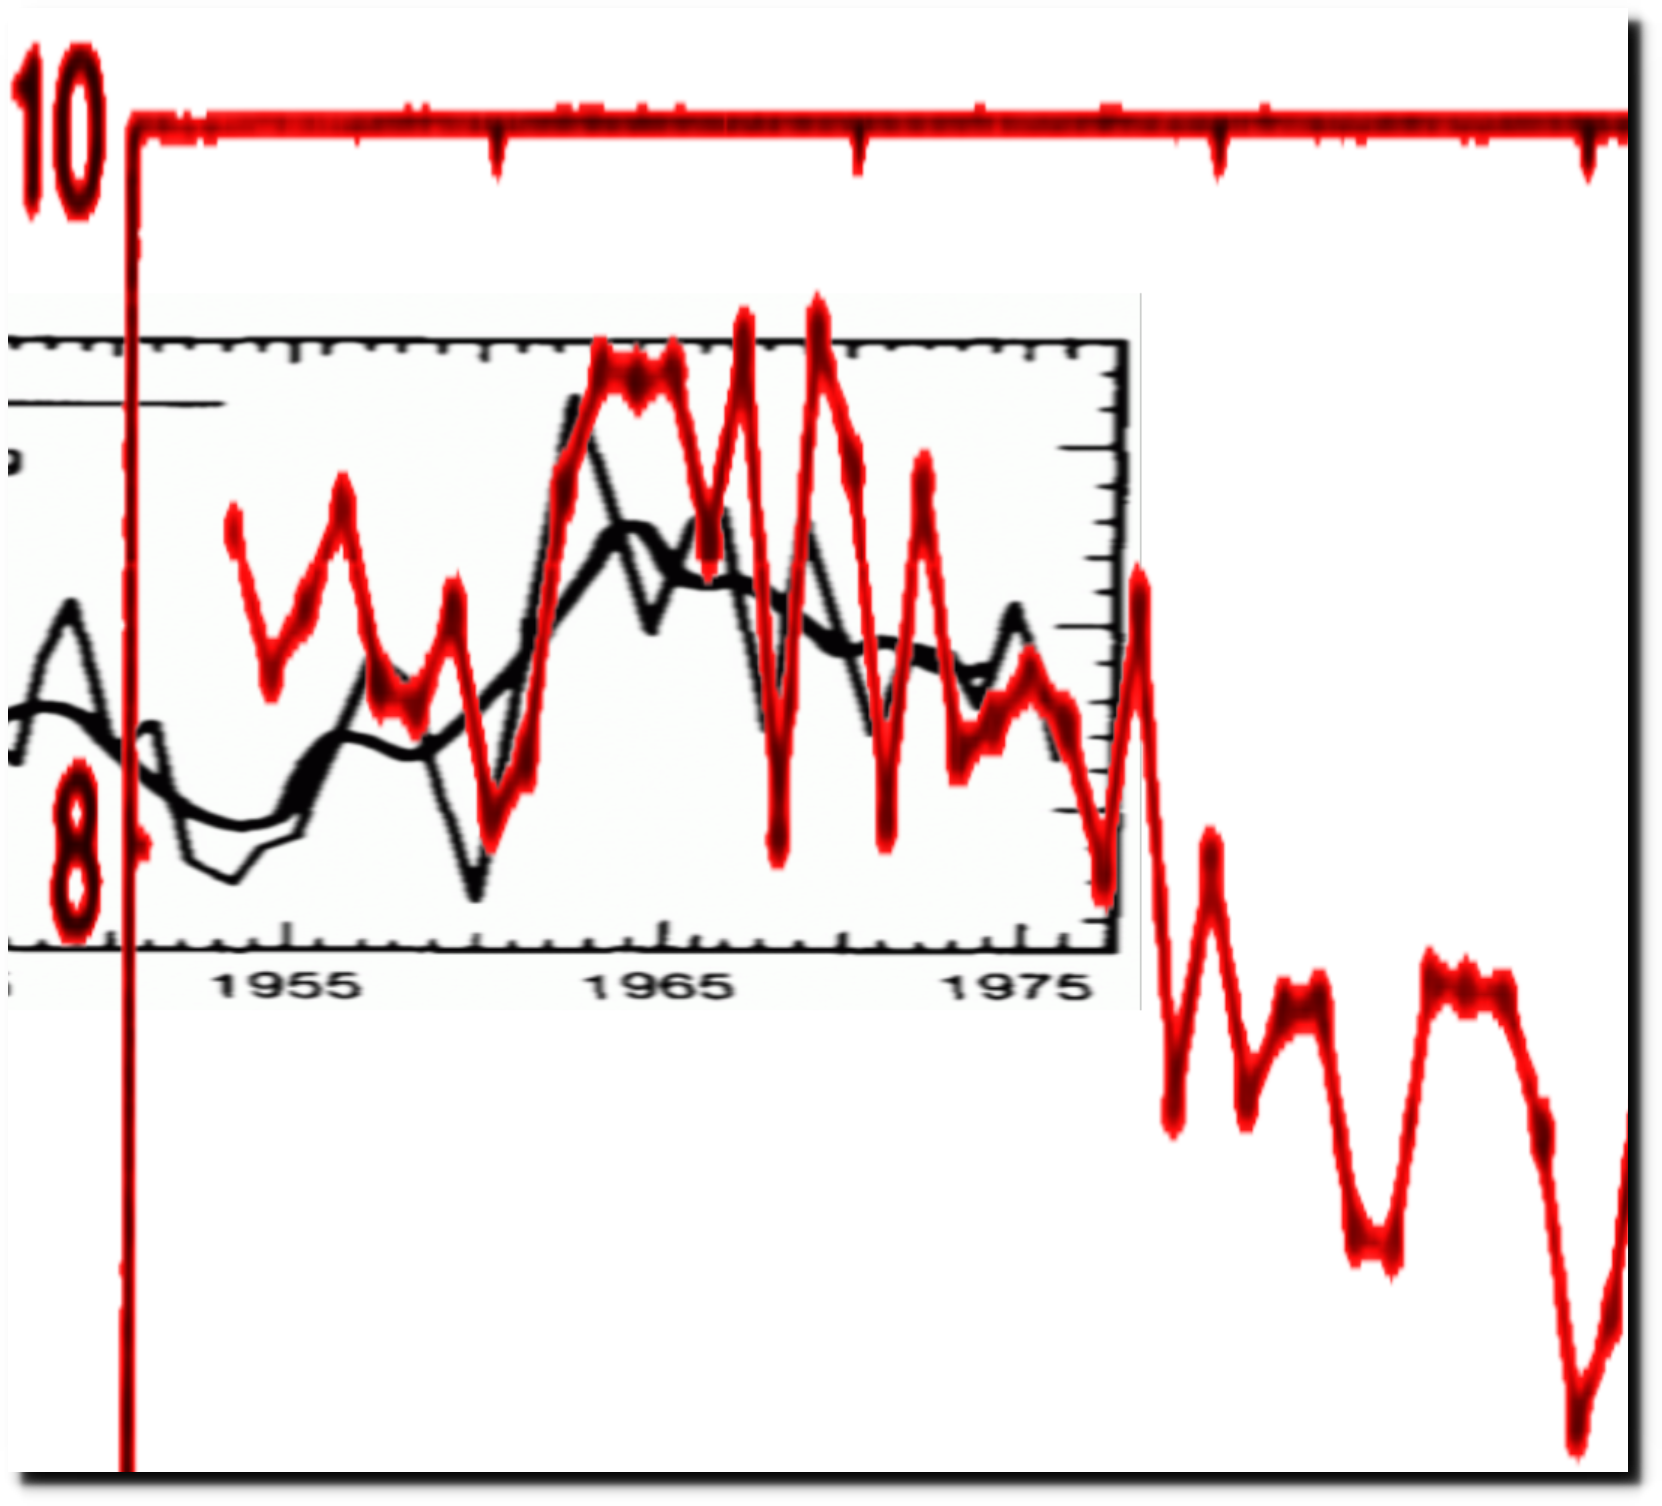
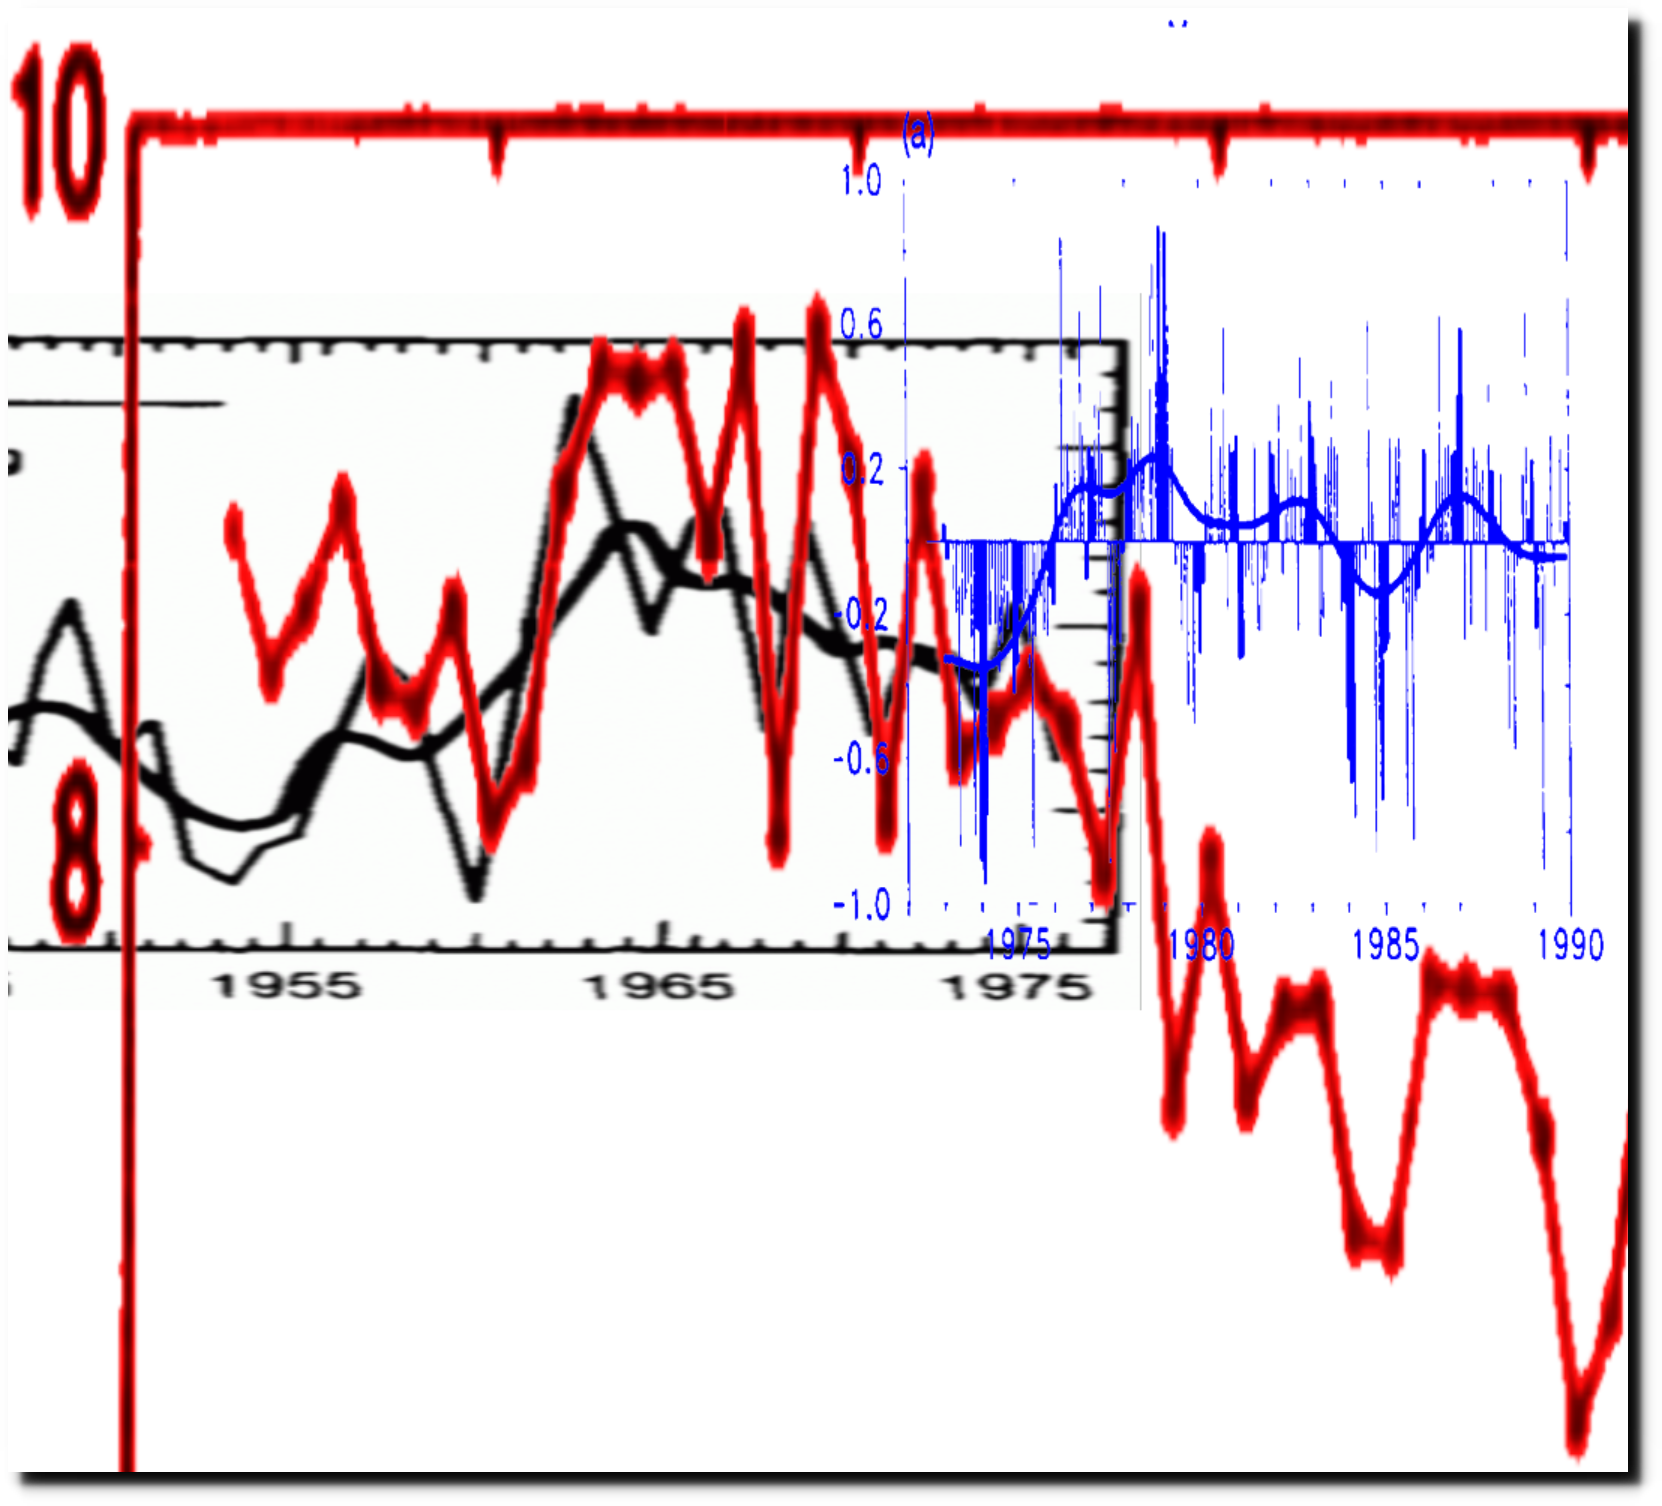
The next diagram overlays Schlesinger’s graph on the 1985 DOE graph, at the same scale. Schlesinger showed nearly 50% more ice in the 1960’s than the 1985 DOE Report
I normalized the graphs by sliding Schlesinger’s graph down the Y-axis. After doing that, the period prior to 1977 looks somewhat similar.
Then I added in the 1995 IPCC graph in blue. Schlesinger’s trends look nothing like those in the 1985 DOE Report and the 1990 IPCC report.

In 1922, journalists used the same words : “Strange things happening in the Frozen Arctic.” They described a radical change in climatic conditions with hitherto unheard-of high temperatures, and glaciers disappearing. They wondered if the Arctic was going to melt entirely.
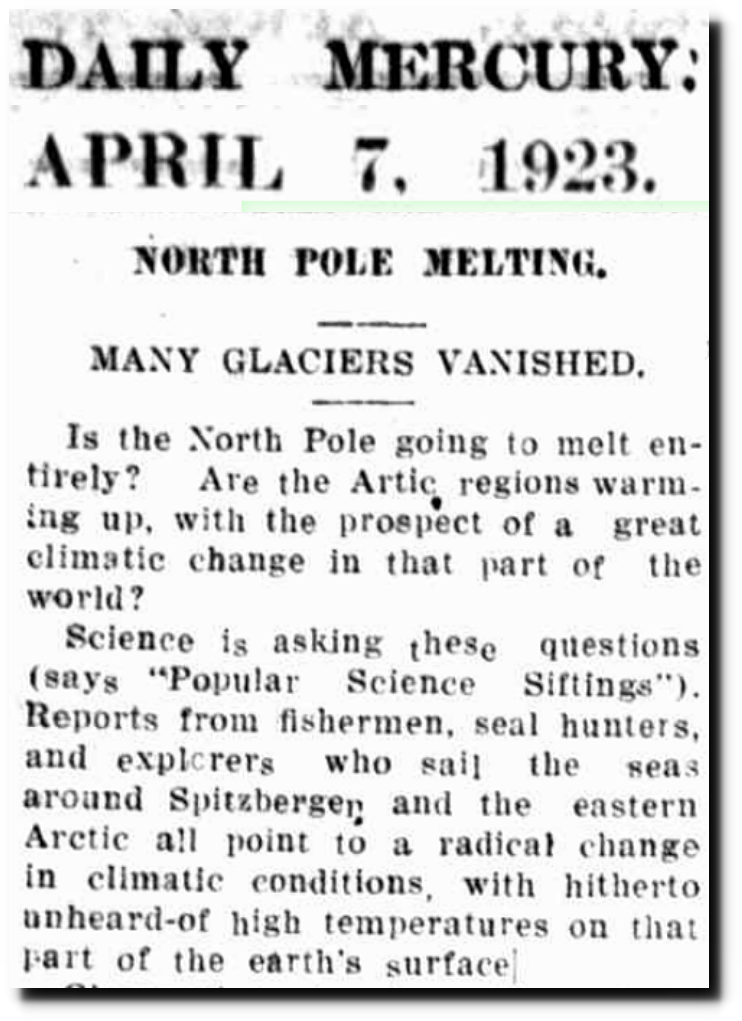
07 Apr 1923 – NORTH POLE MELTING. – Trove

03 Dec 1922, Page 92 – The Pittsburgh Press at Newspapers.com
NOAA uses a different propaganda technique from Schlesinger. They don’t make data up, but rather they hide all the inconvenient data before the peak in 1979.
ftp://ftp.oar.noaa.gov/arctic/documents/ArcticReportCard_full_report2016.pdf
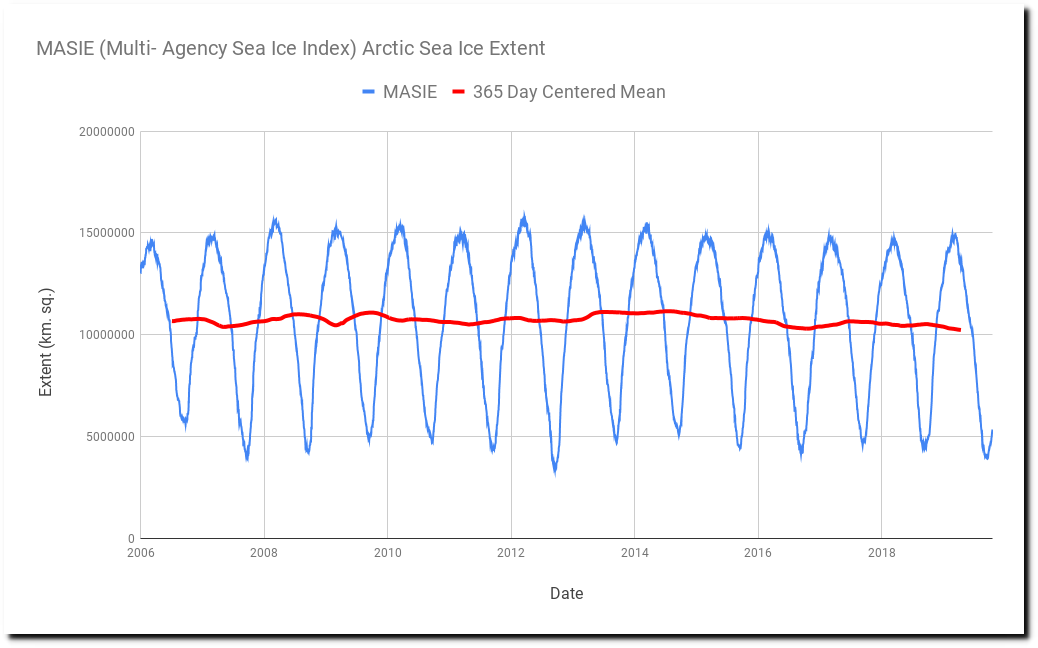
There has been no trend in sea ice extent since the start of MASIE records in 2006.