BOM Hiding The Heat In Australia

Experts predict 50C temperatures in Australia, due to increased levels of CO2 in the atmosphere.

Australia reached 51C in 1906.

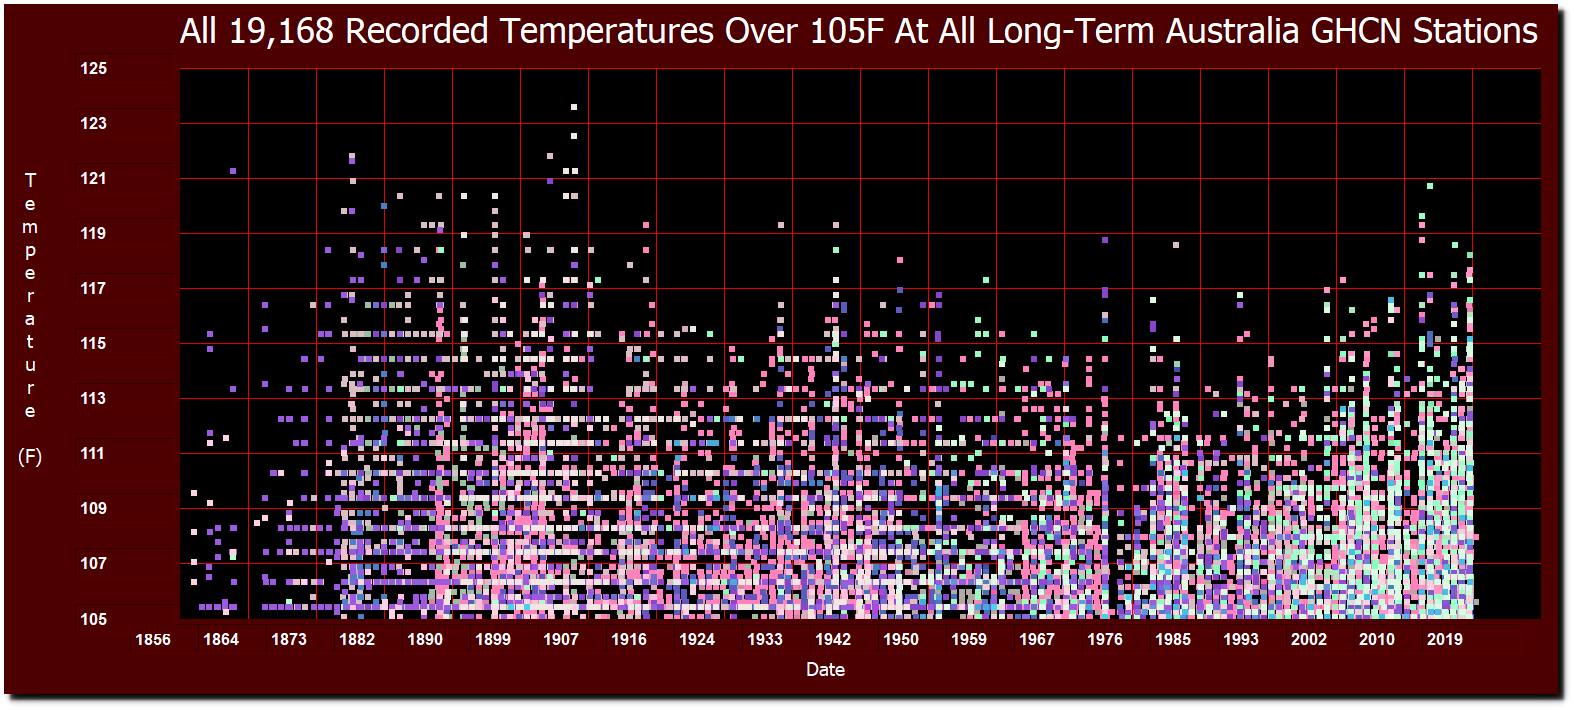
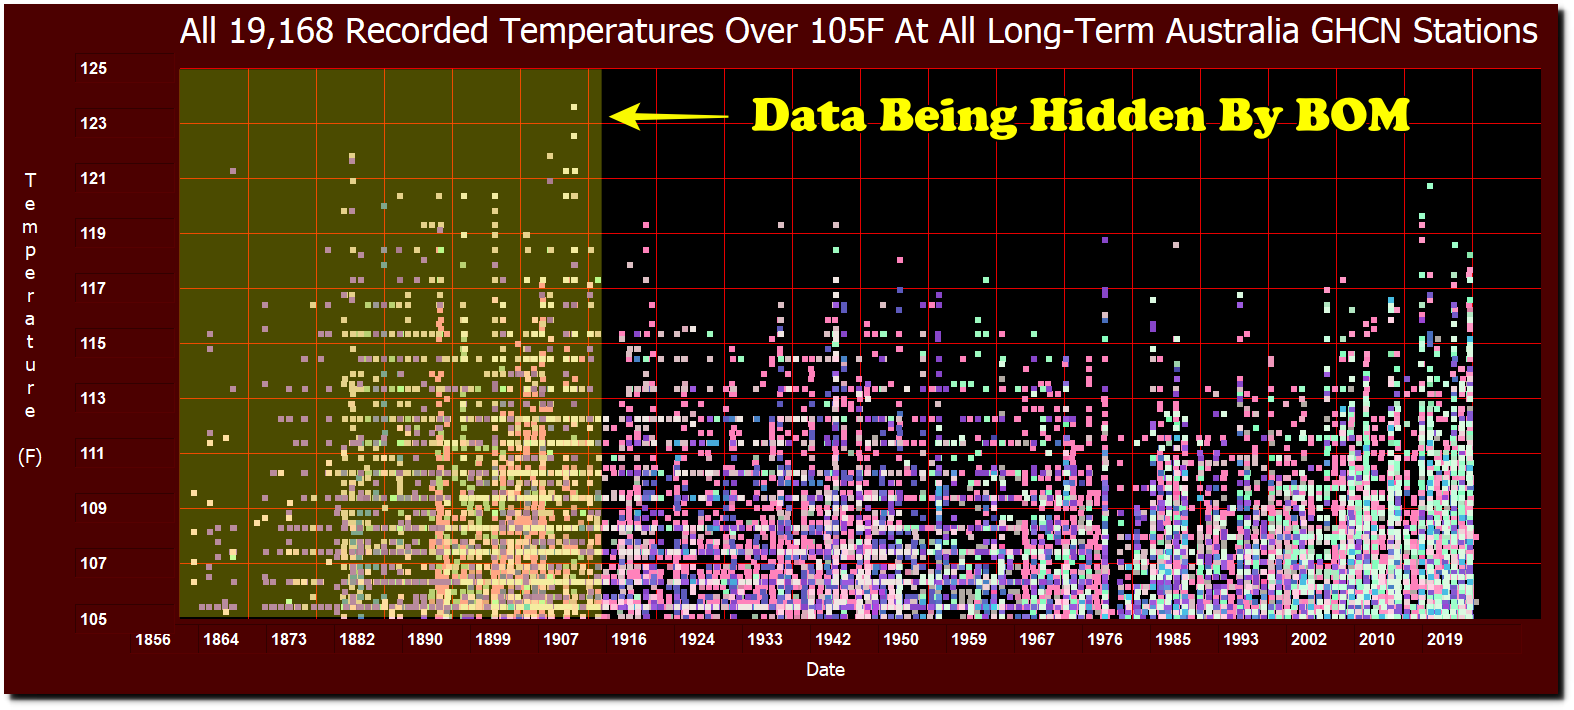
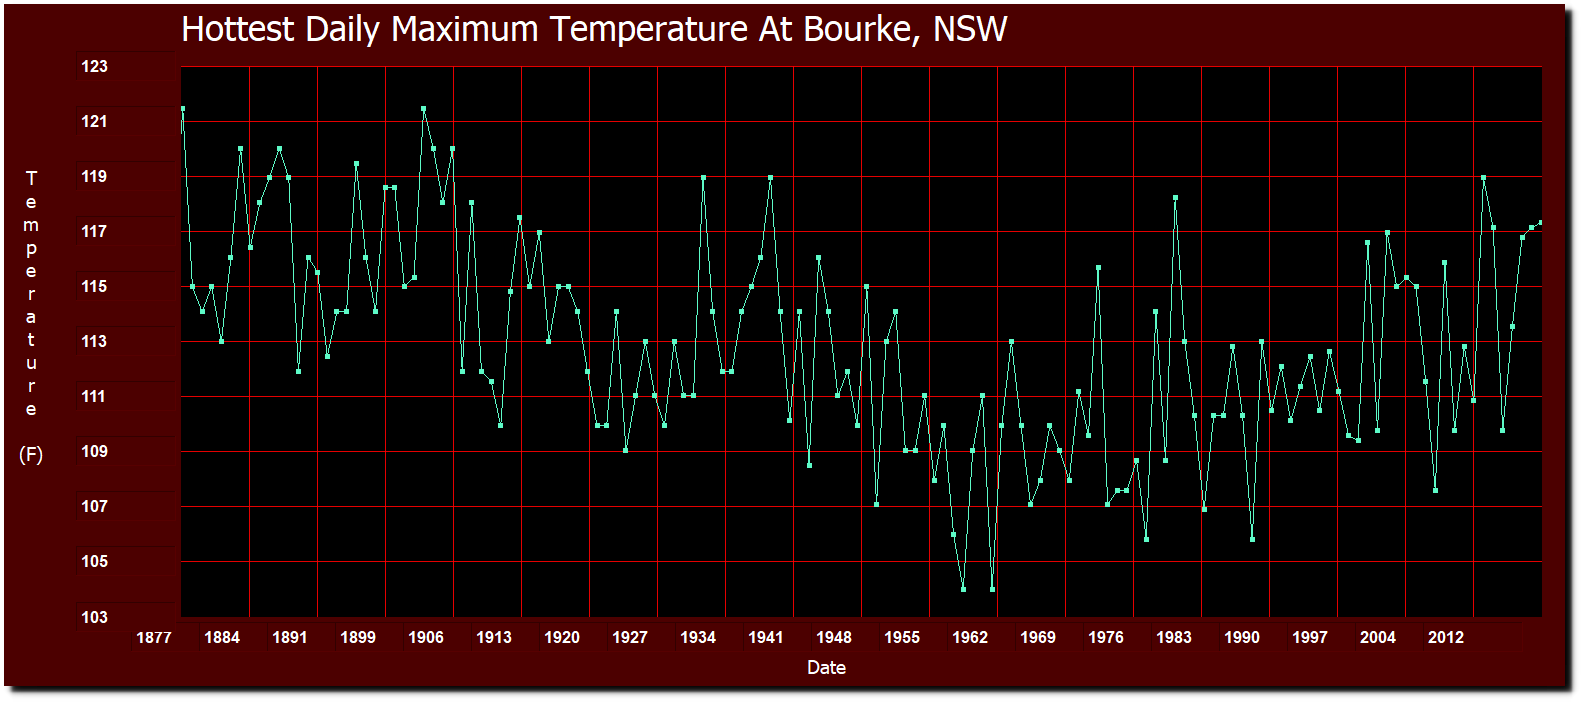
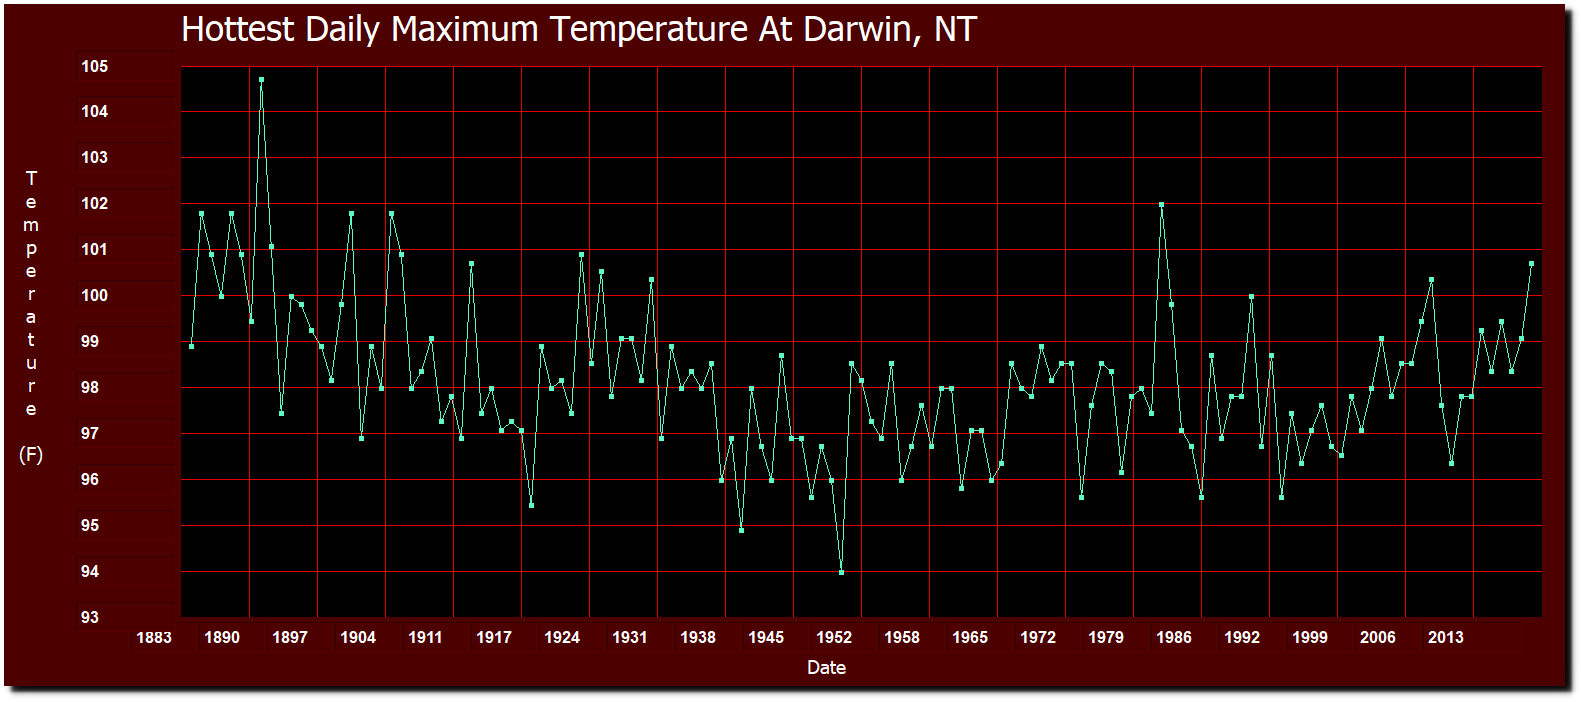
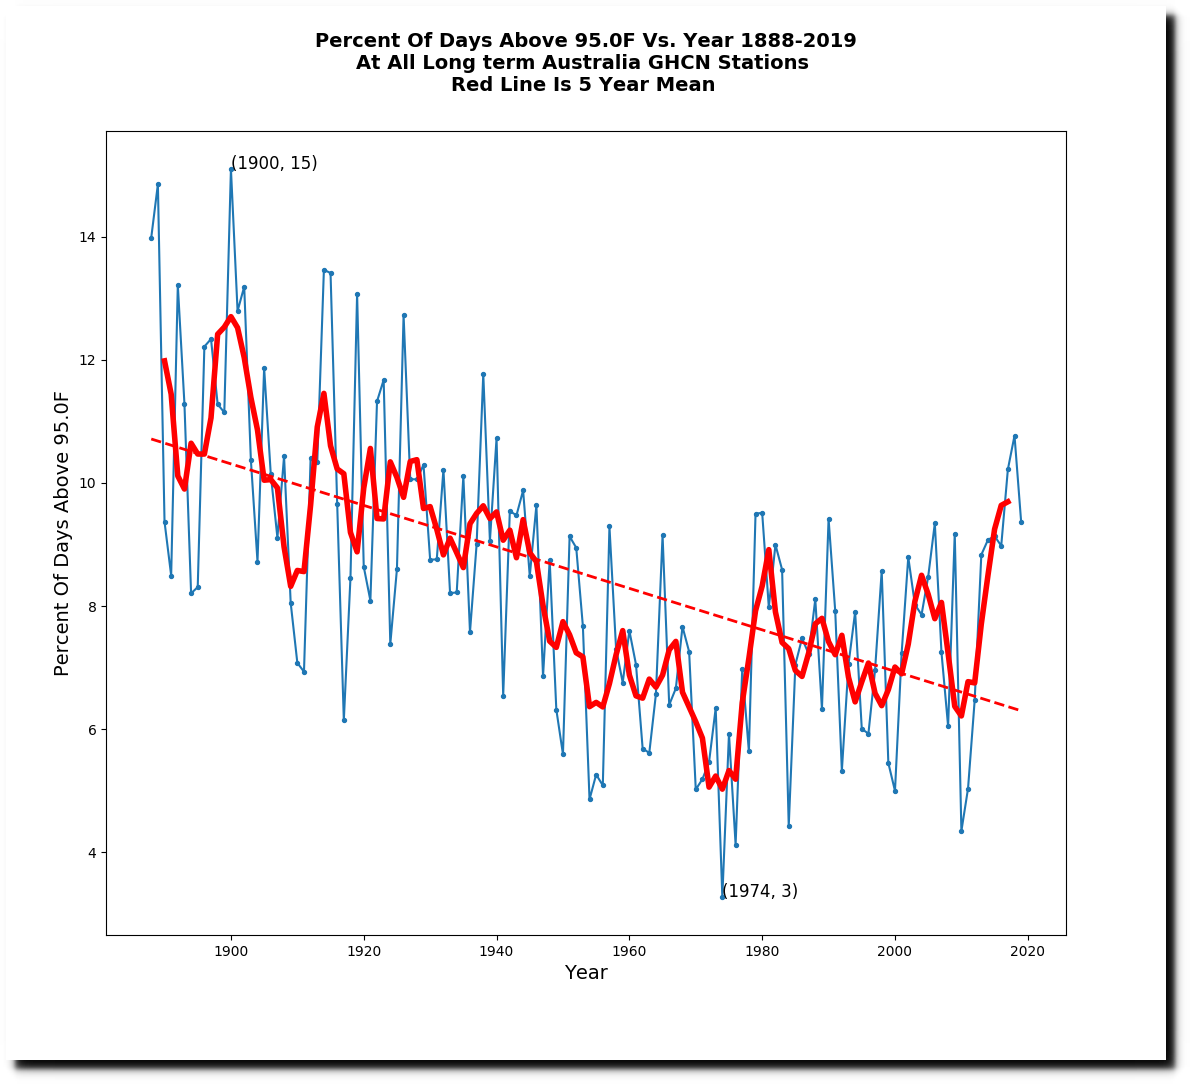
Not surprisingly, BOM hides all of the hot weather before 1910.

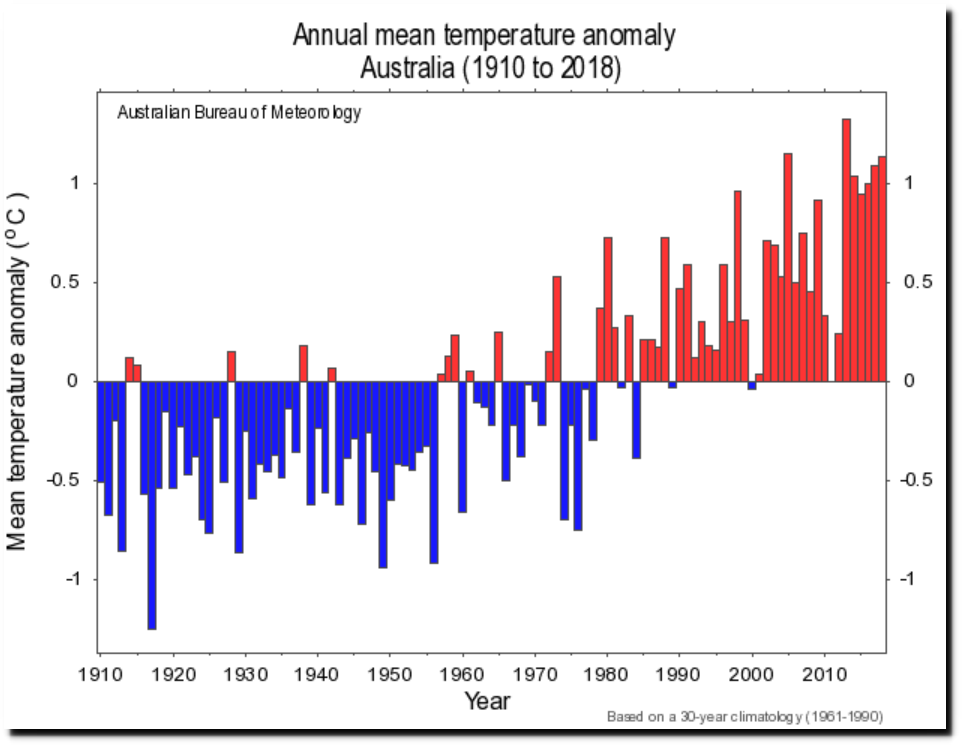
Climate change and variability: Tracker: Australian timeseries graphs


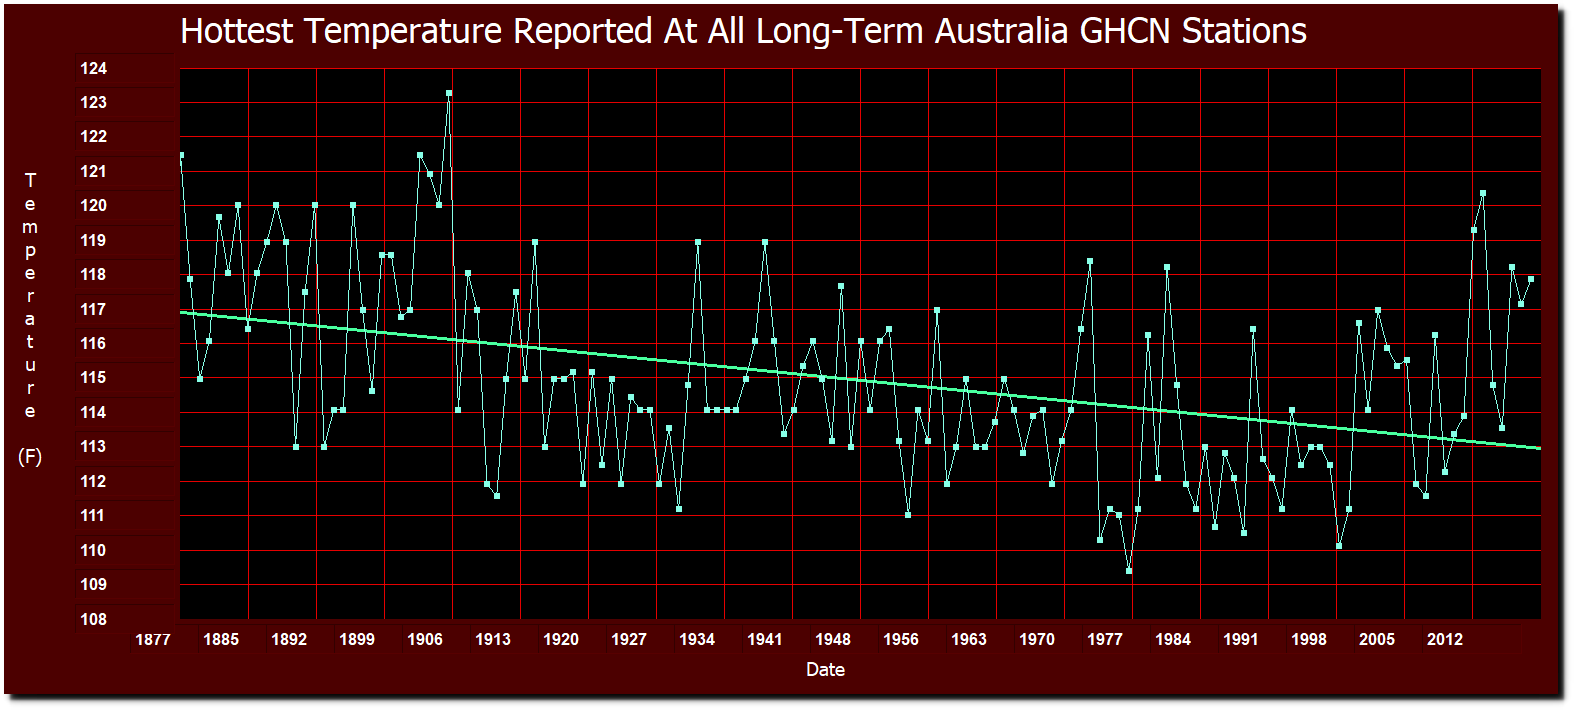
One of the hottest days on record in Australia was January 7, 1906.

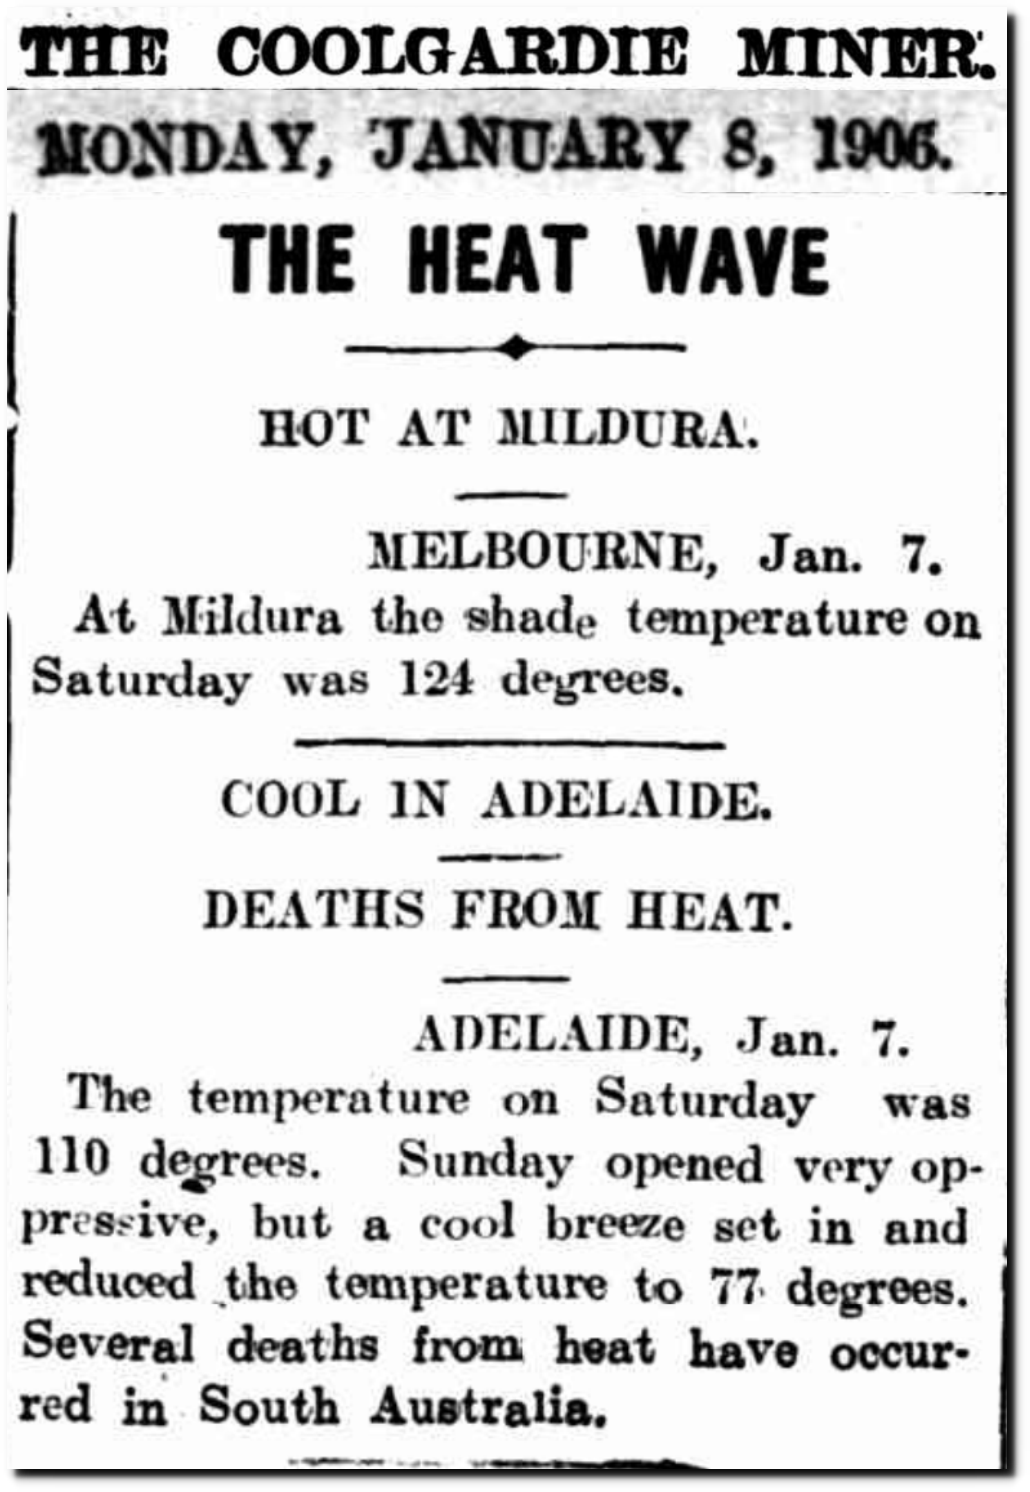
08 Jan 1906 – THE HEAT WAVE – Trove

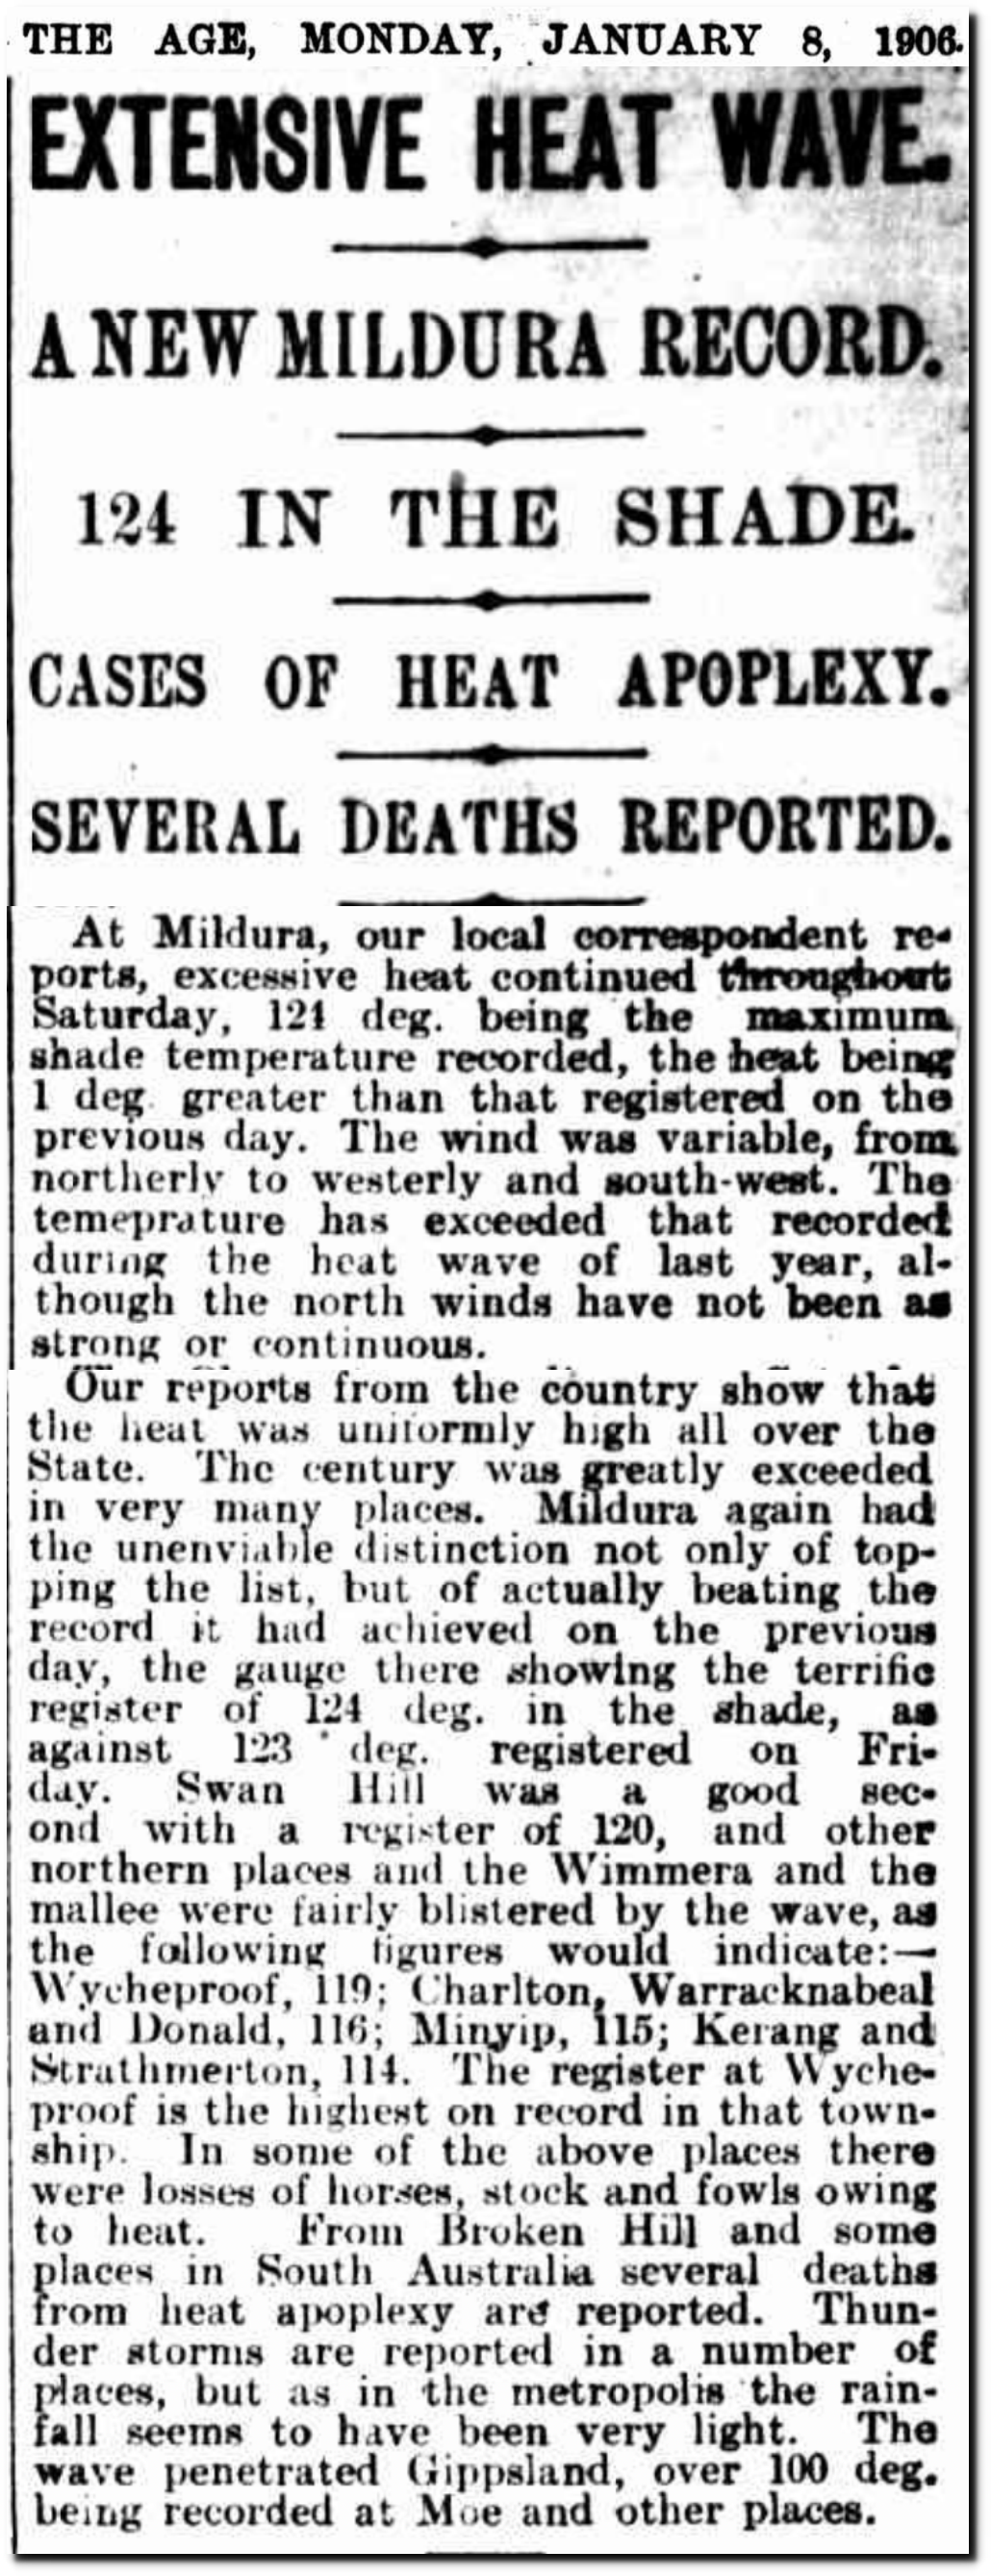
08 Jan 1906 – EXTENSIVE HEAT WAVE. – Trove

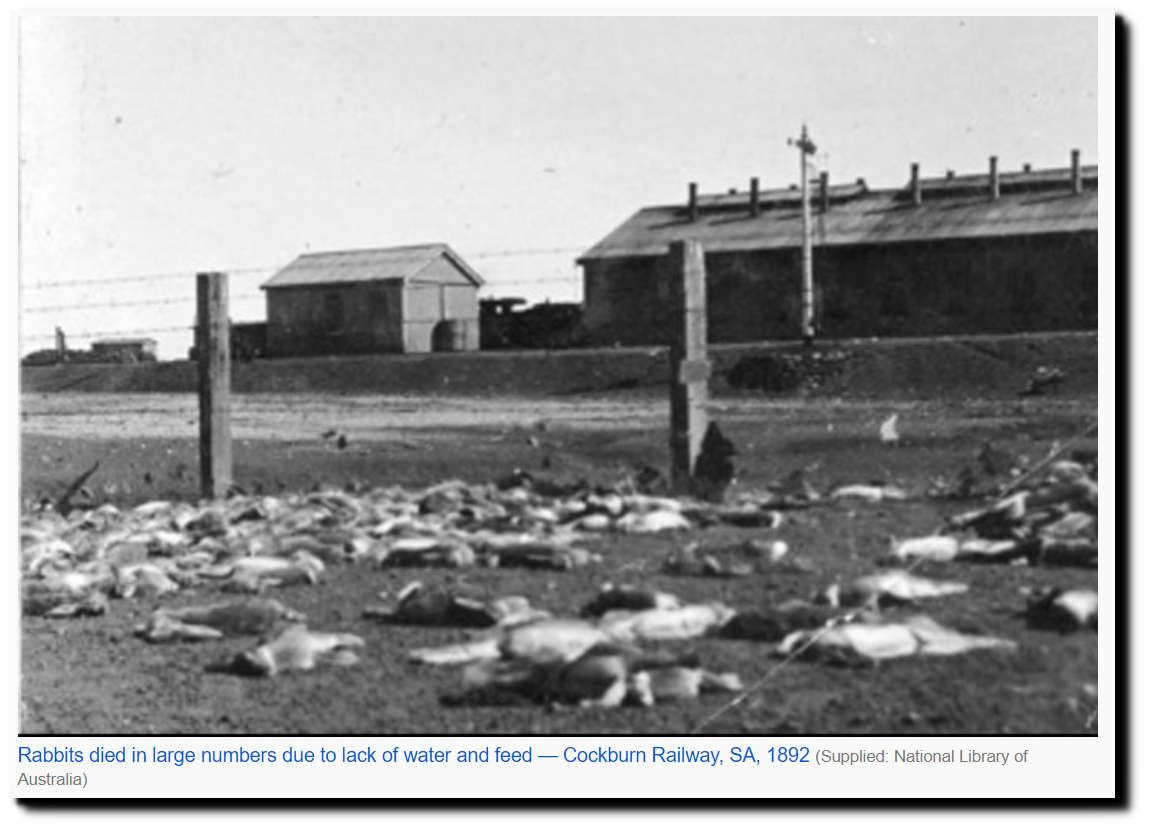
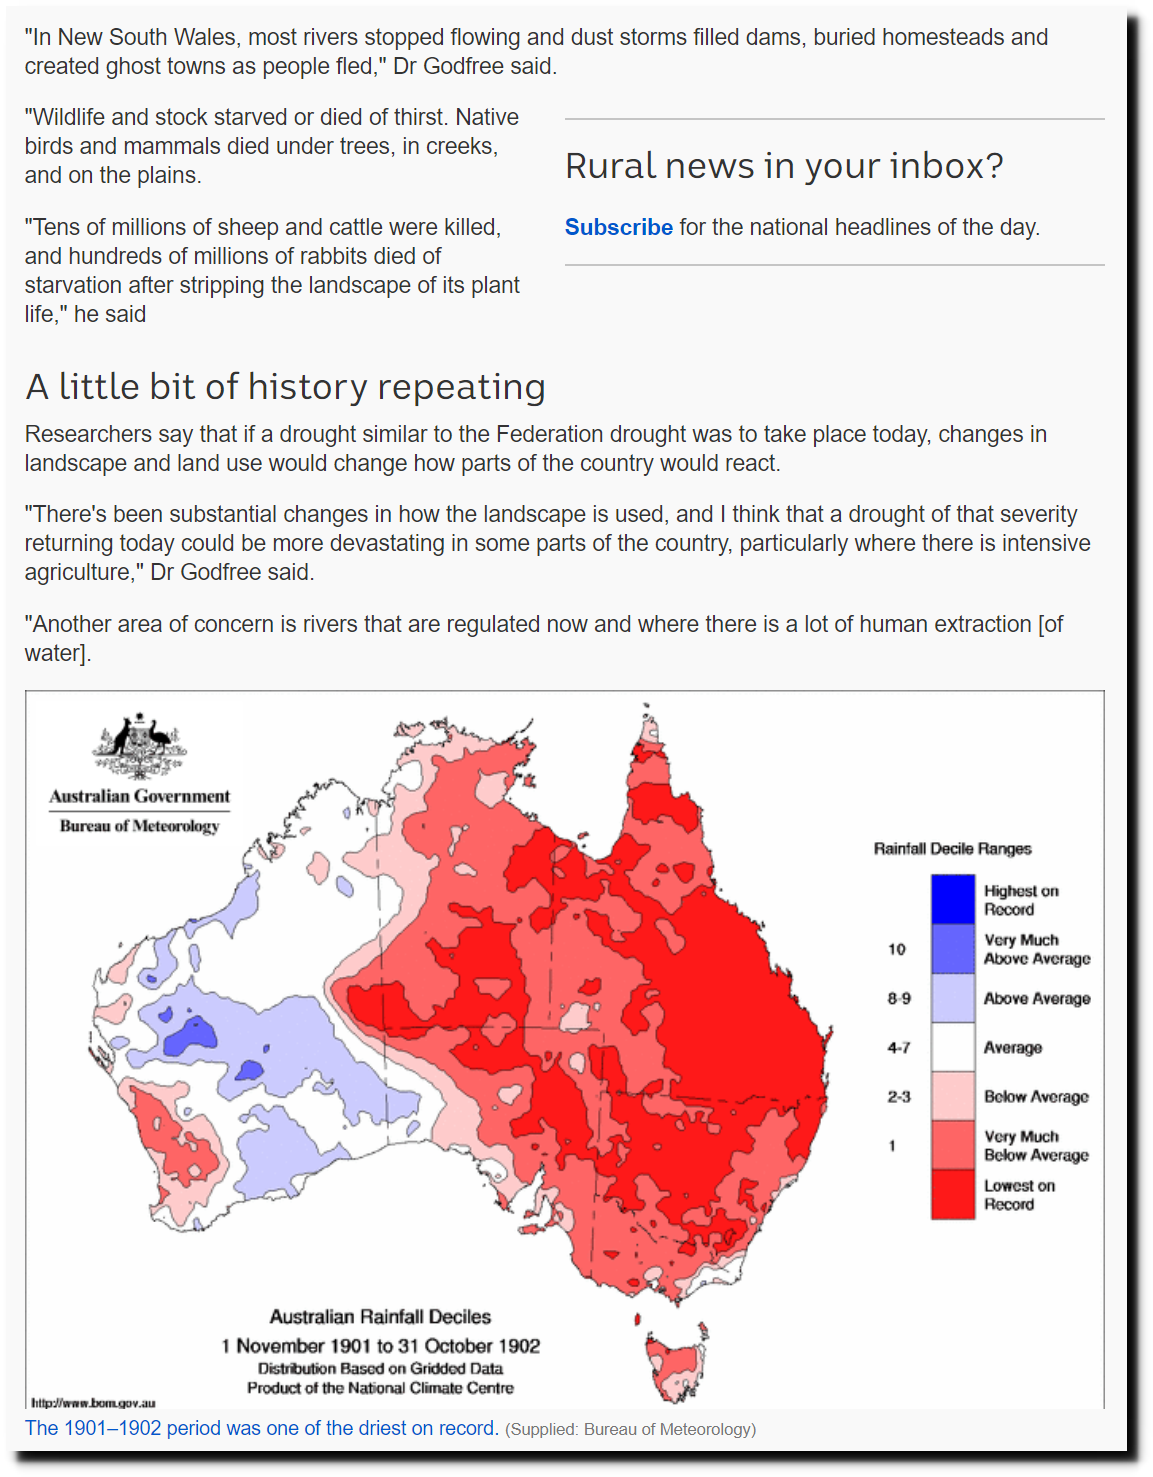
This was near the end of 15 years of the Federation drought.

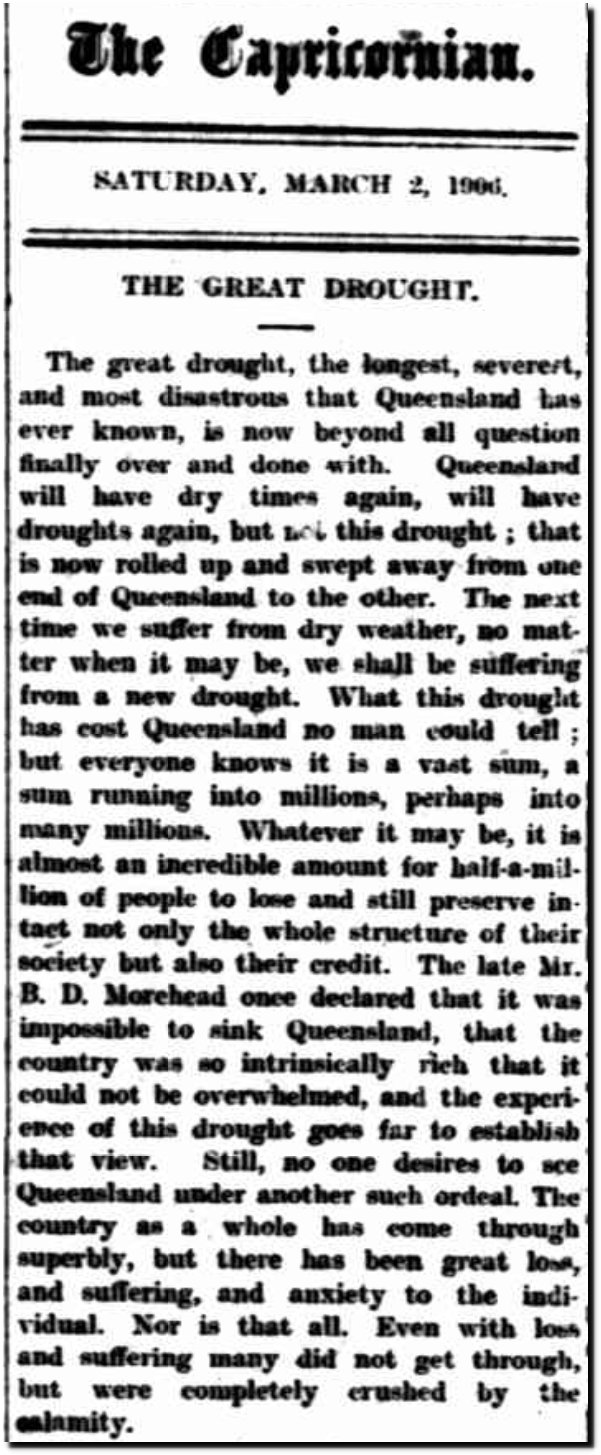
03 Mar 1906 – The Capricornian. SATURDAY, MARCH 2, 1906. – Trove

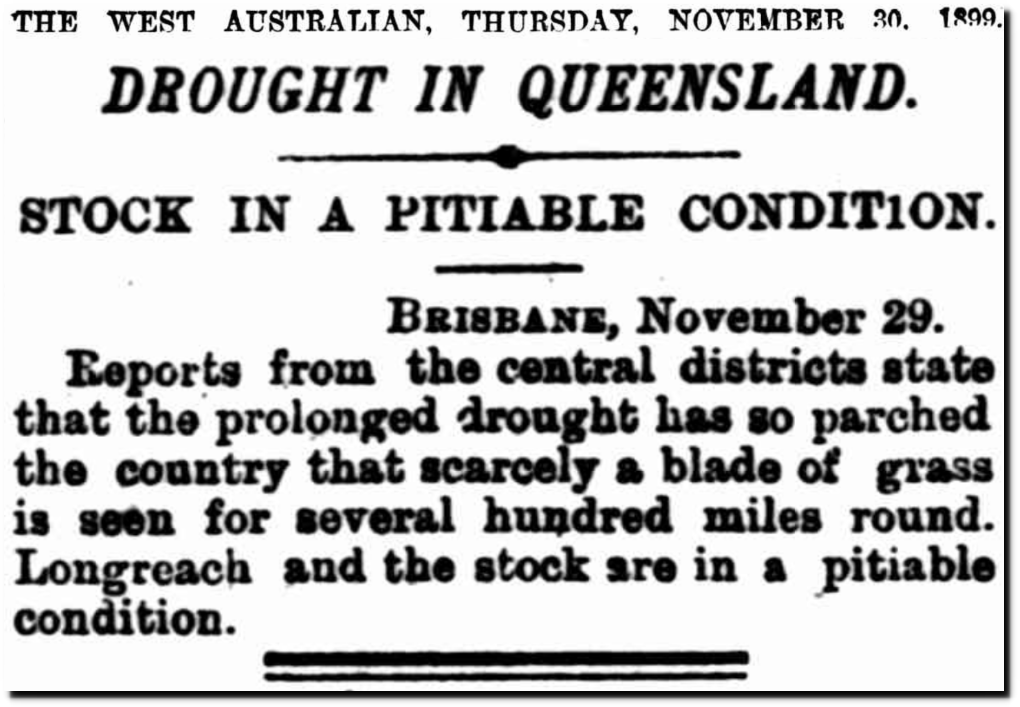
30 Nov 1899 – DROUGHT IN QUEENSLAND. – Trove

Drought of 1891 to 1903 reconstructed shows today’s conditions likely to have more devastating effects – ABC Rural – ABC News

There was also a tremendous drought in Europe at that time.

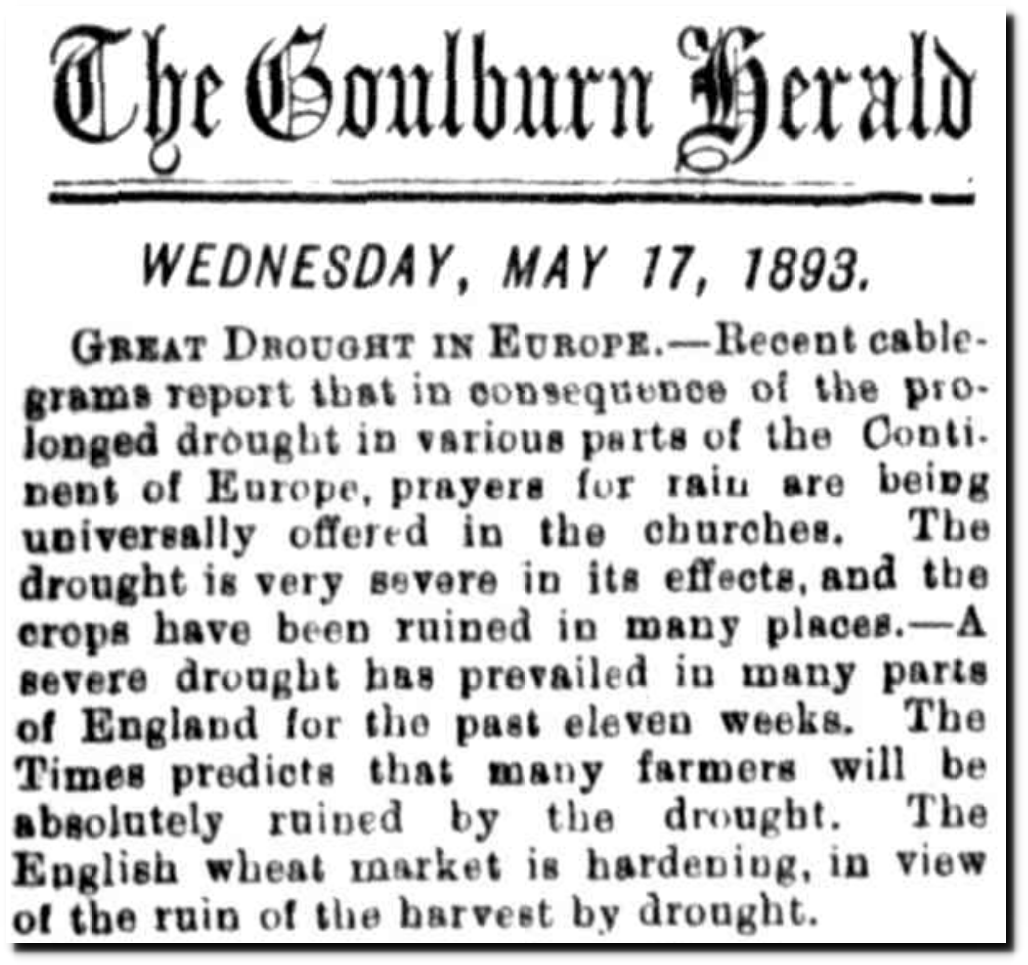
17 May 1893 – GREAT DROUGHT IN EUROPE. – Trove

And in the US.

Spokane Falls Daily Chronicle – Google News Archive Search

Minnesota also had some of their worst fires that decade.

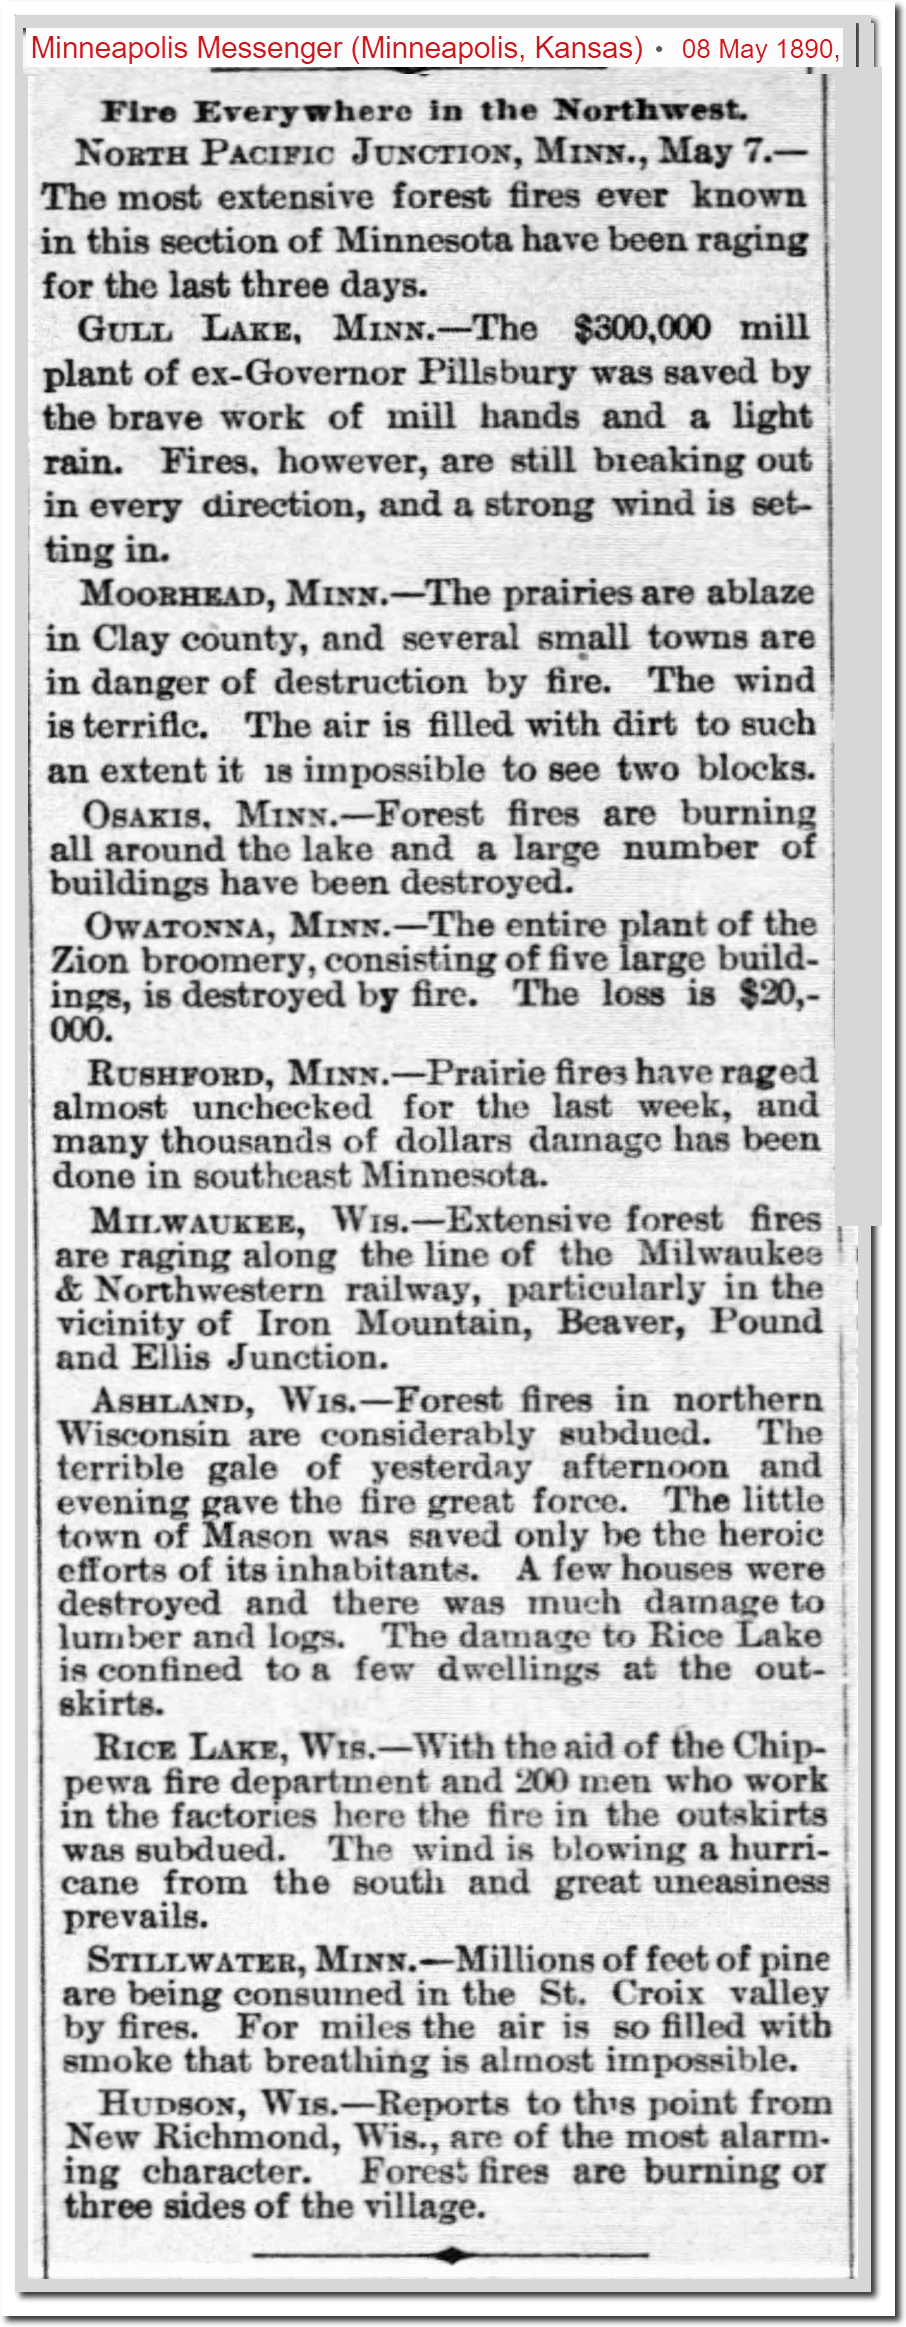
08 May 1890, 6 – Minneapolis Messenger at Newspapers.com

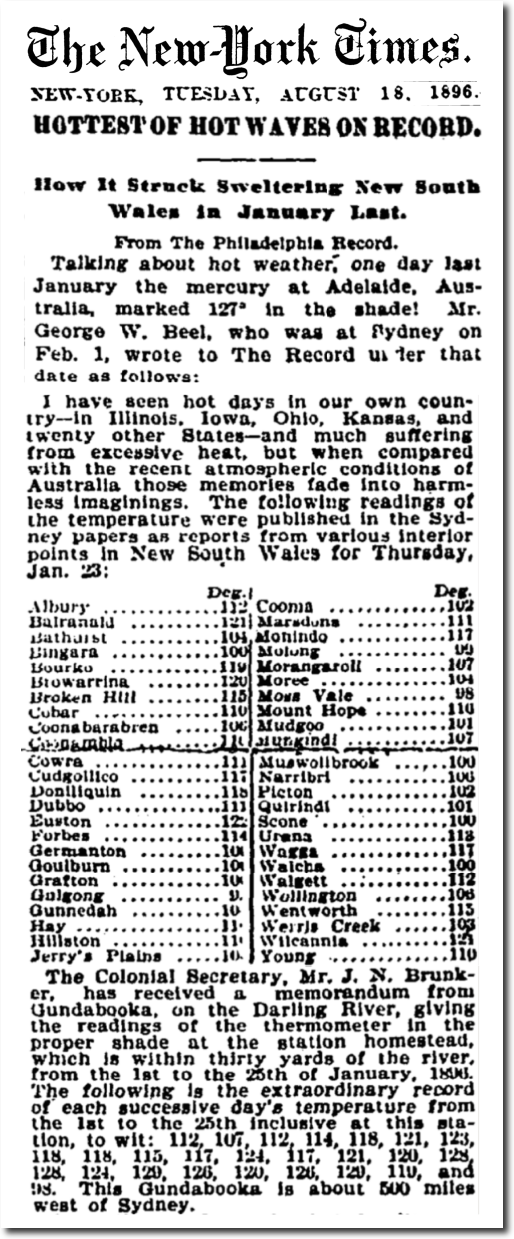
The New York Times described the the January, 1896 heatwave in Australia as the hottest of hot waves on record.

TimesMachine: August 18, 1896

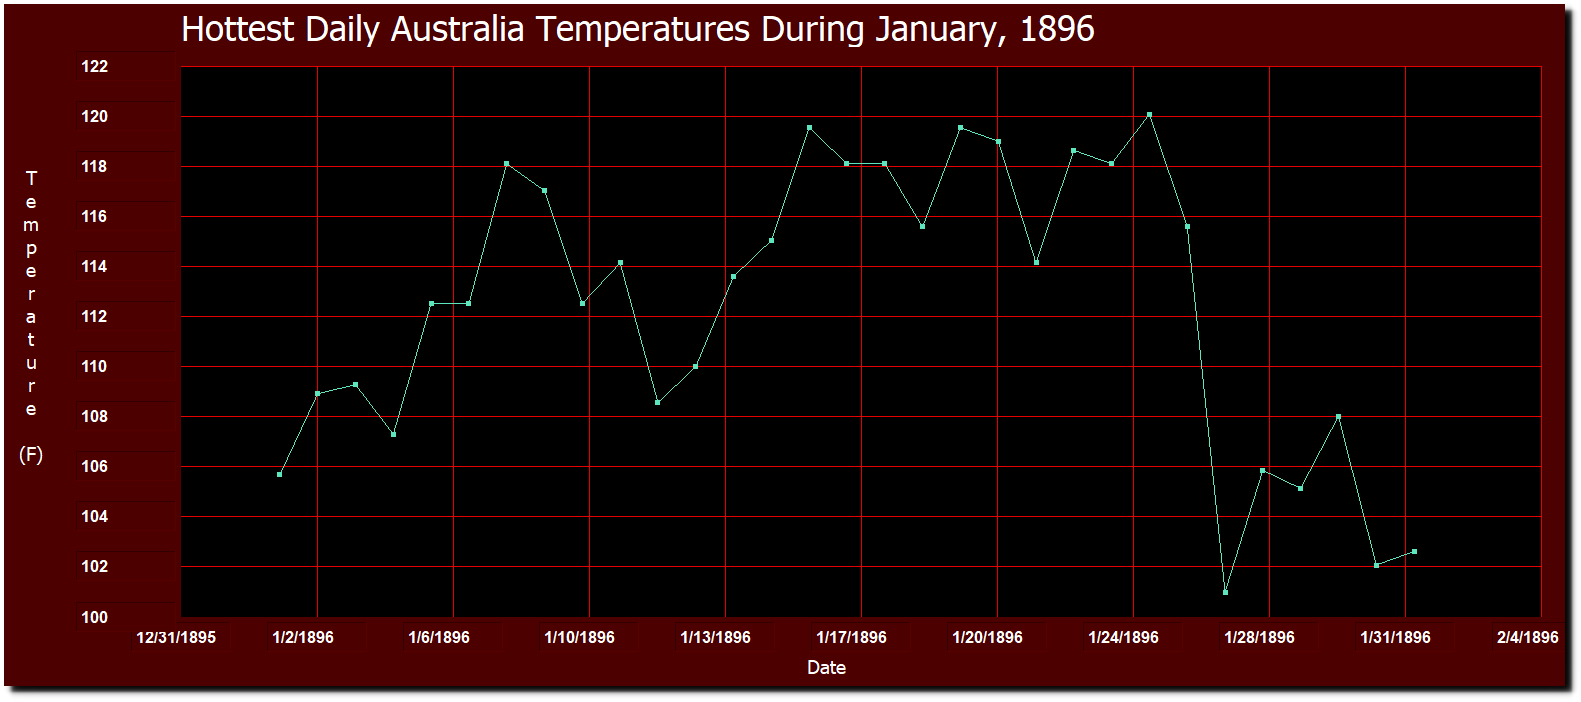
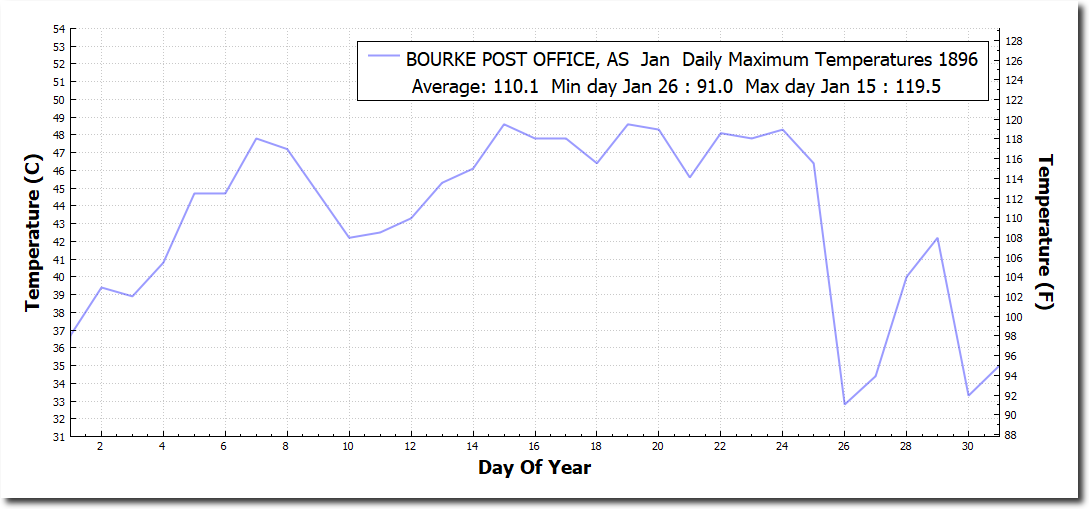
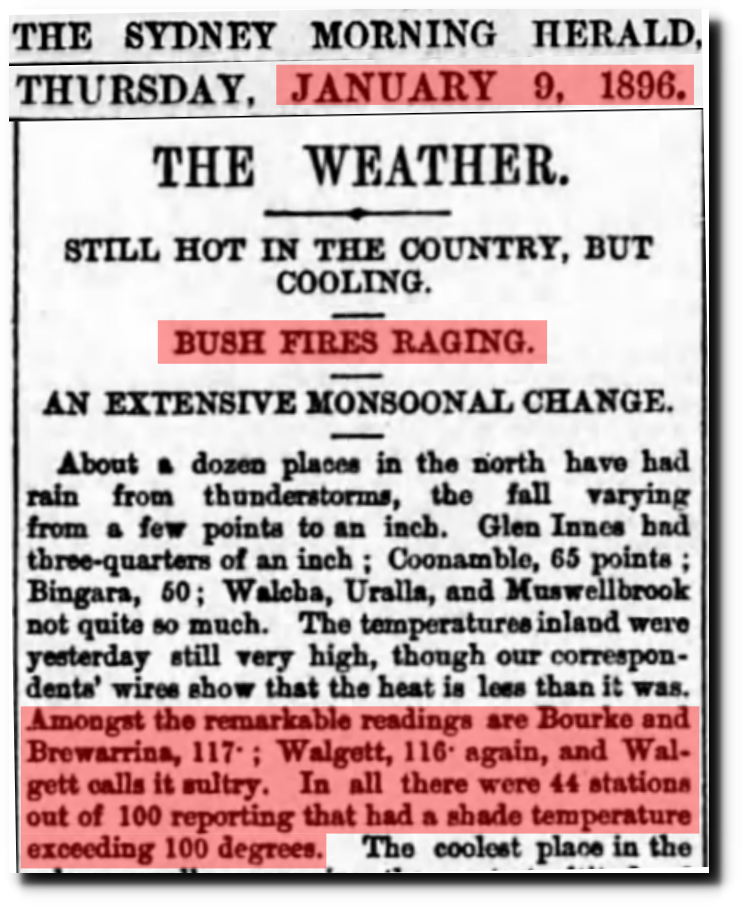
09 Jan 1896, Page 5 – The Sydney Morning Herald at Newspapers.com


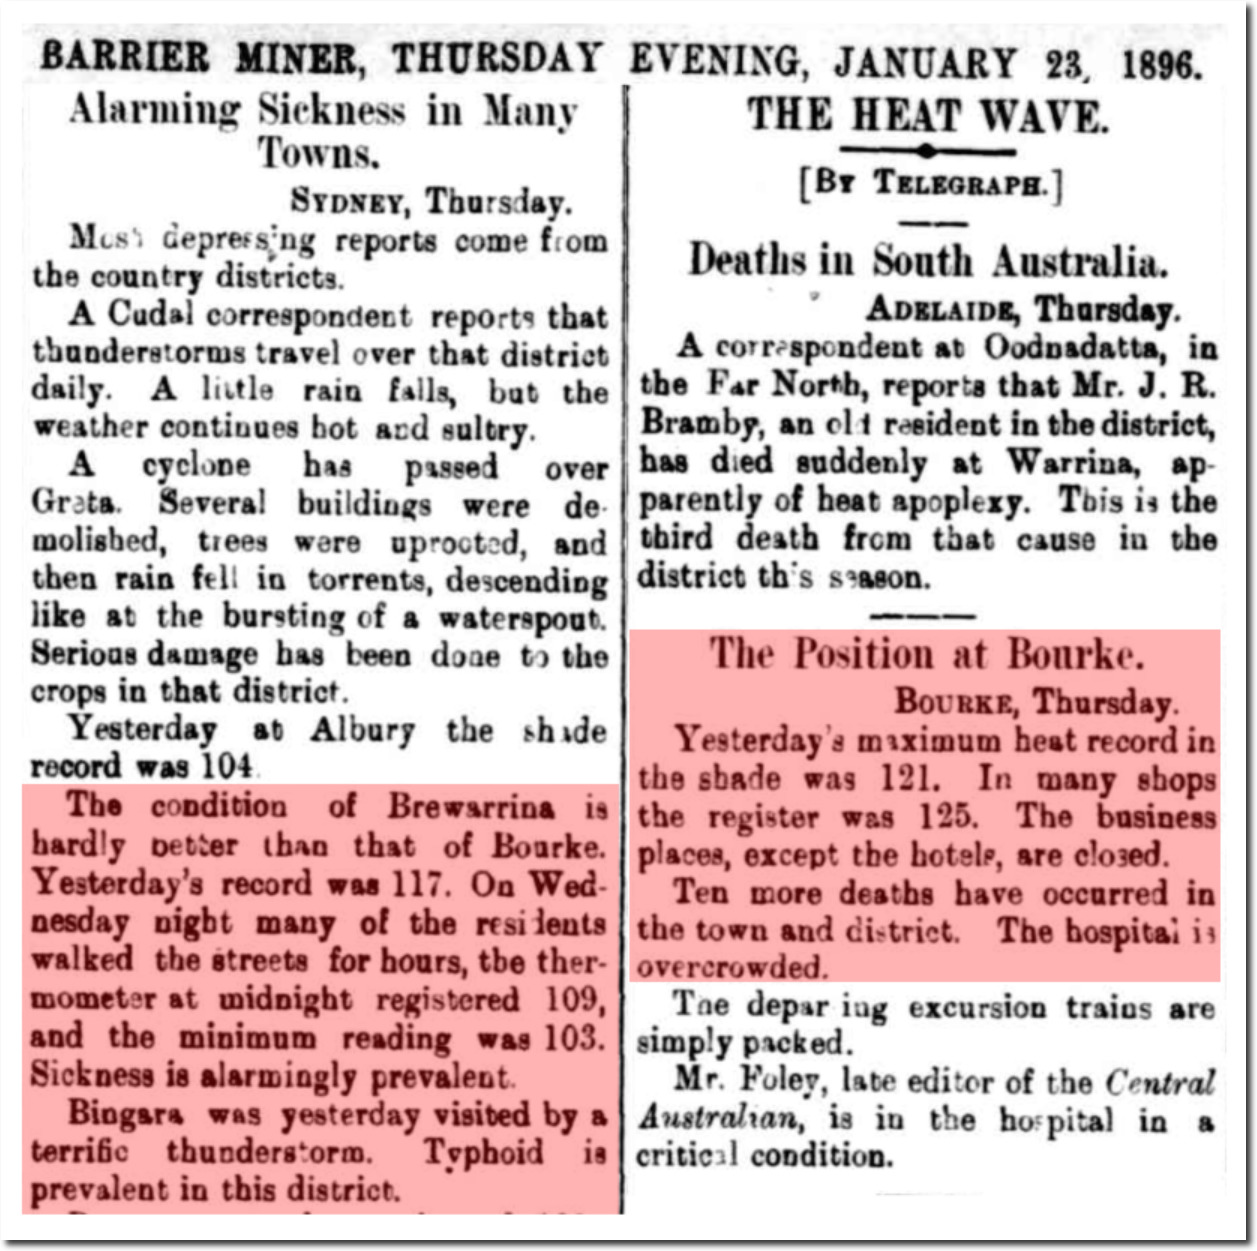
23 Jan 1896 – THE HEAT WAVE. – Trove

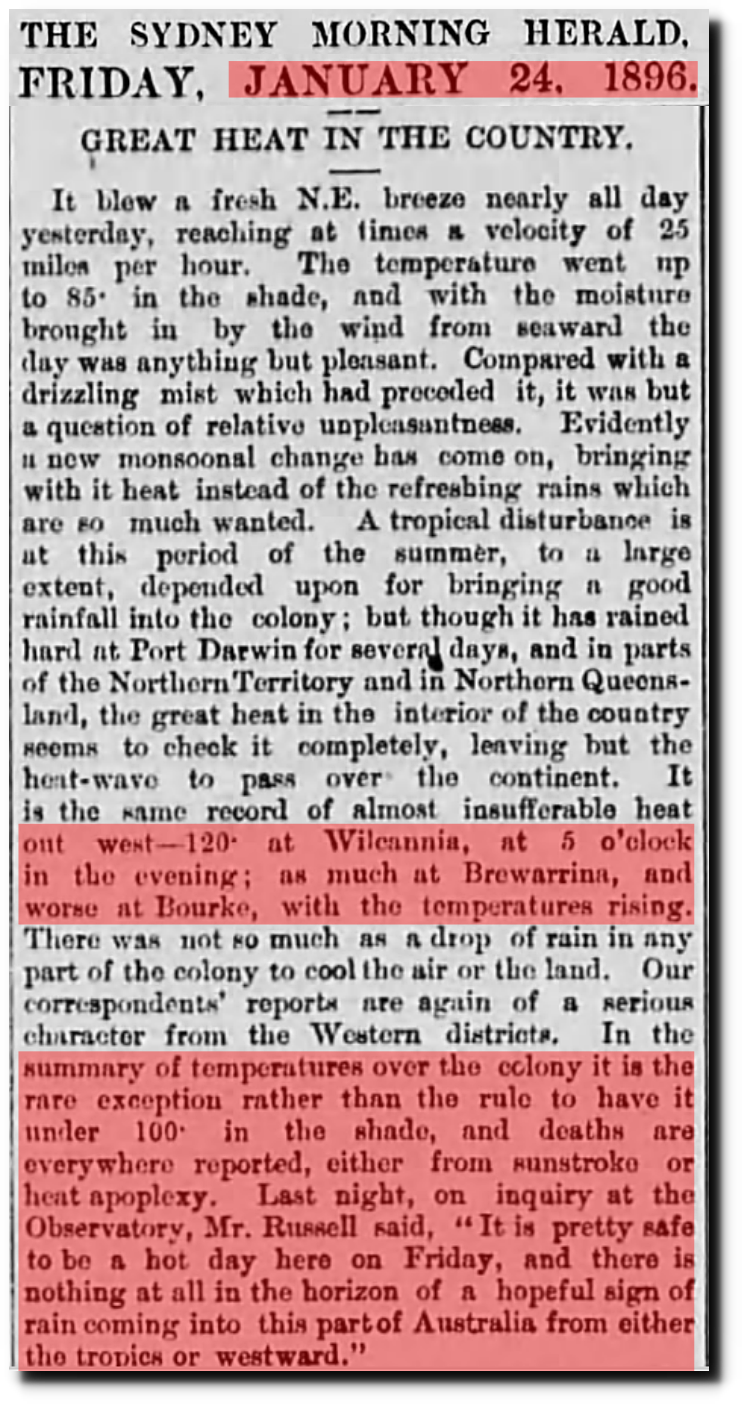
24 Jan 1896, Page 5 – The Sydney Morning Herald at Newspapers.com

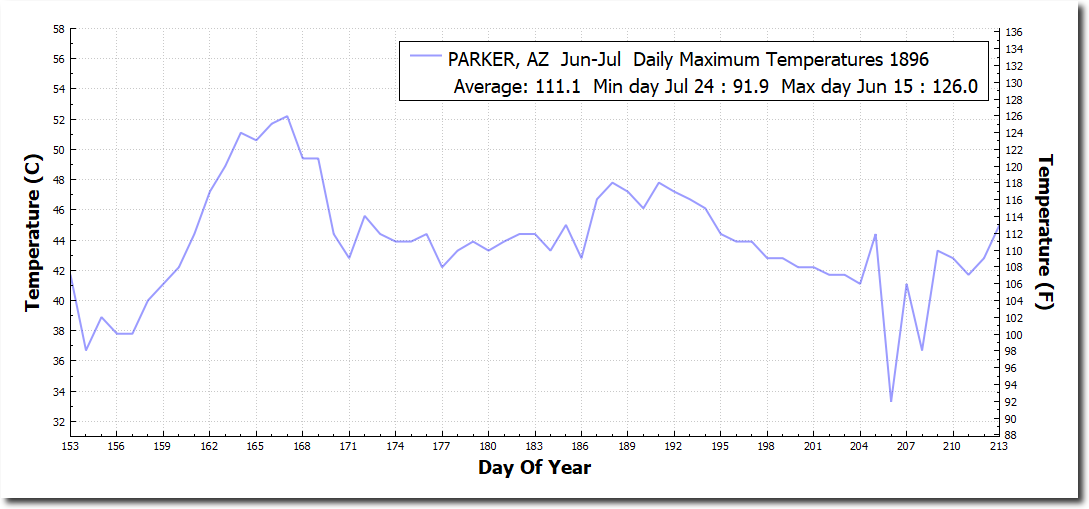
The year 1896 brought record heat all around the world, including Arizona’s longest spell over 120F.

India was 51C.

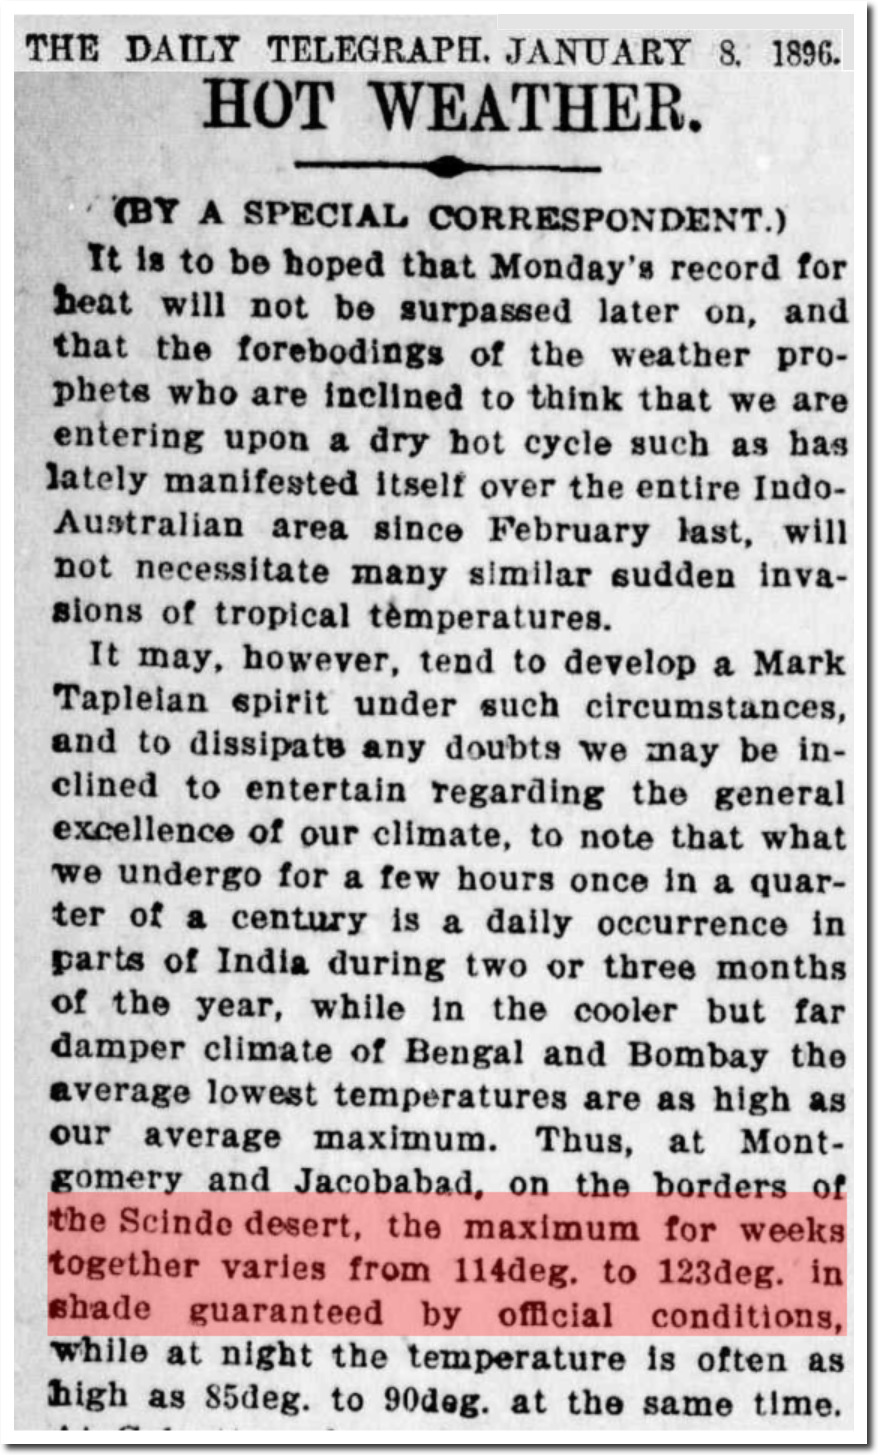
08 Jan 1896 – HOT WEATHER. – Trove

Europe

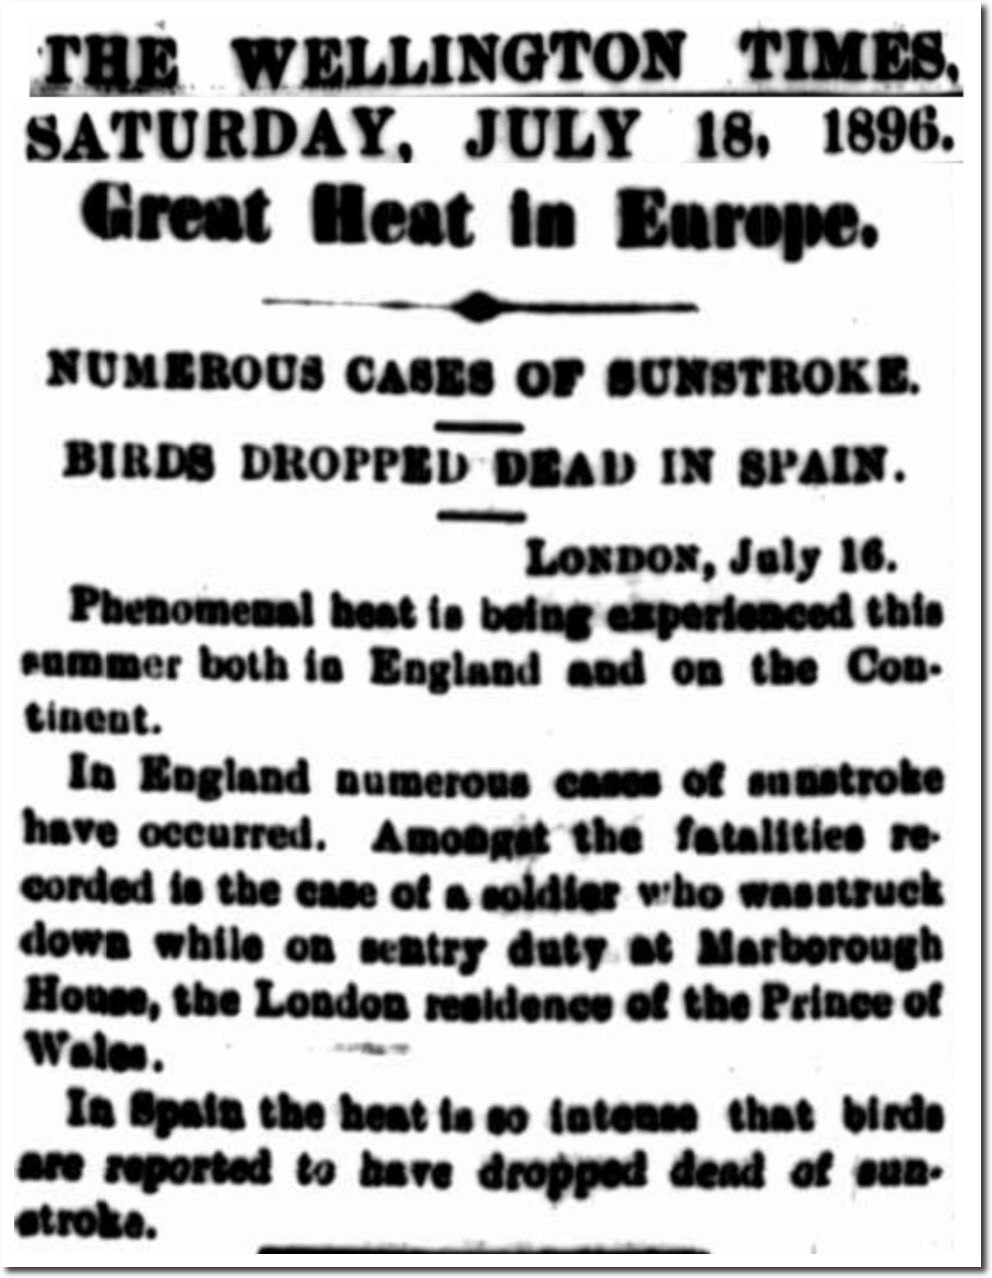
18 Jul 1896 – Great Heat in Europe. – Trove

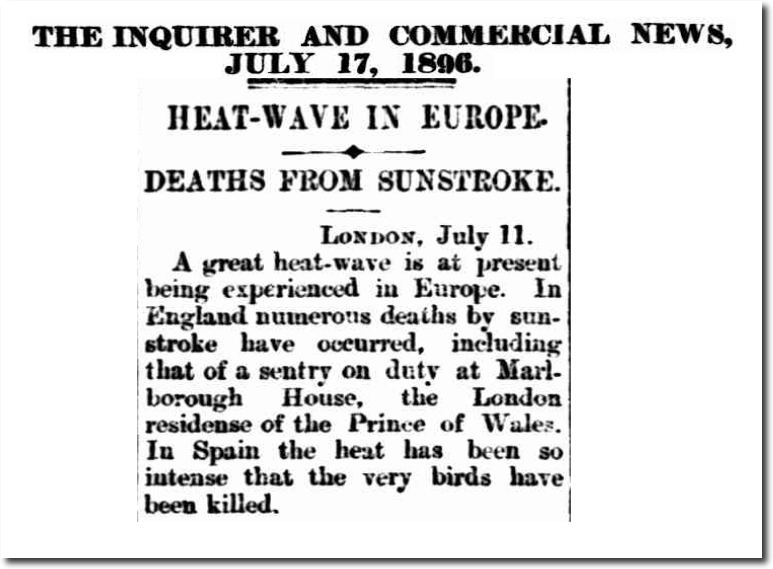
17 Jul 1896 – HEAT-WAVE IN EUROPE.

New York

1896 Heatwave

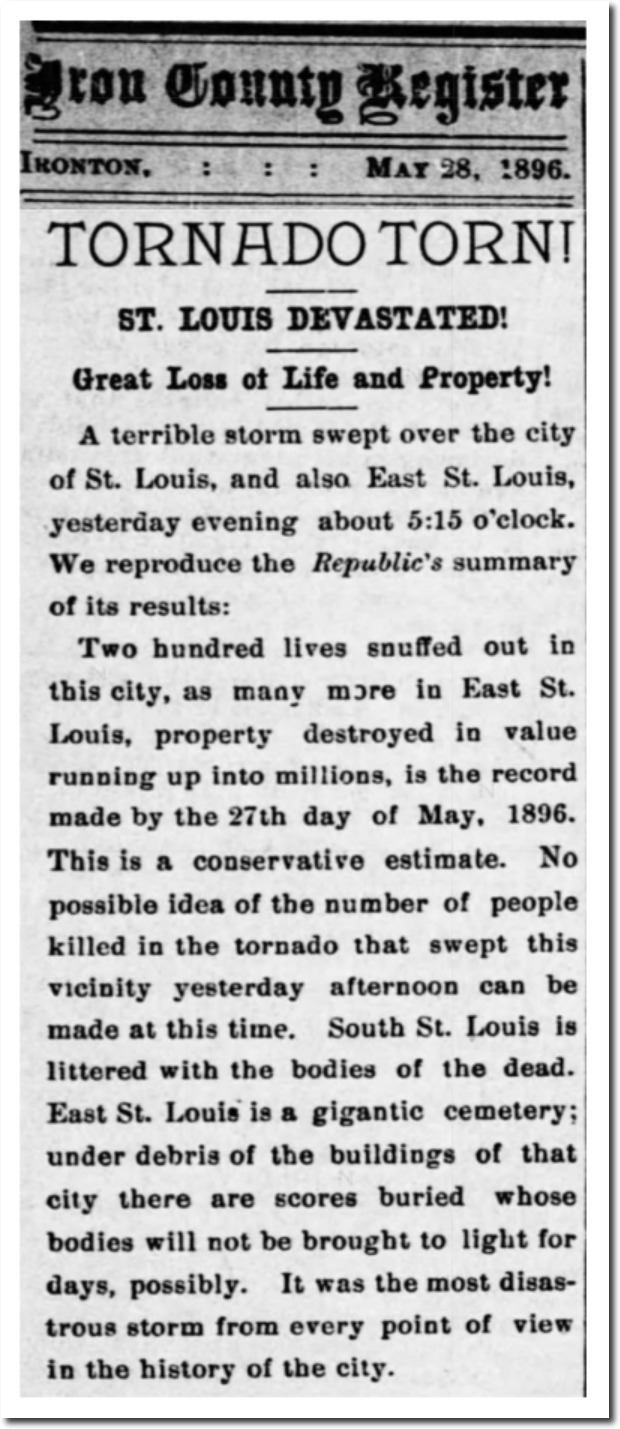
28 May 1896, 4 – Ironton County Register at Newspapers.com

National Geographic reported that Alaska’s largest glacier retreated 40 miles by 1896.

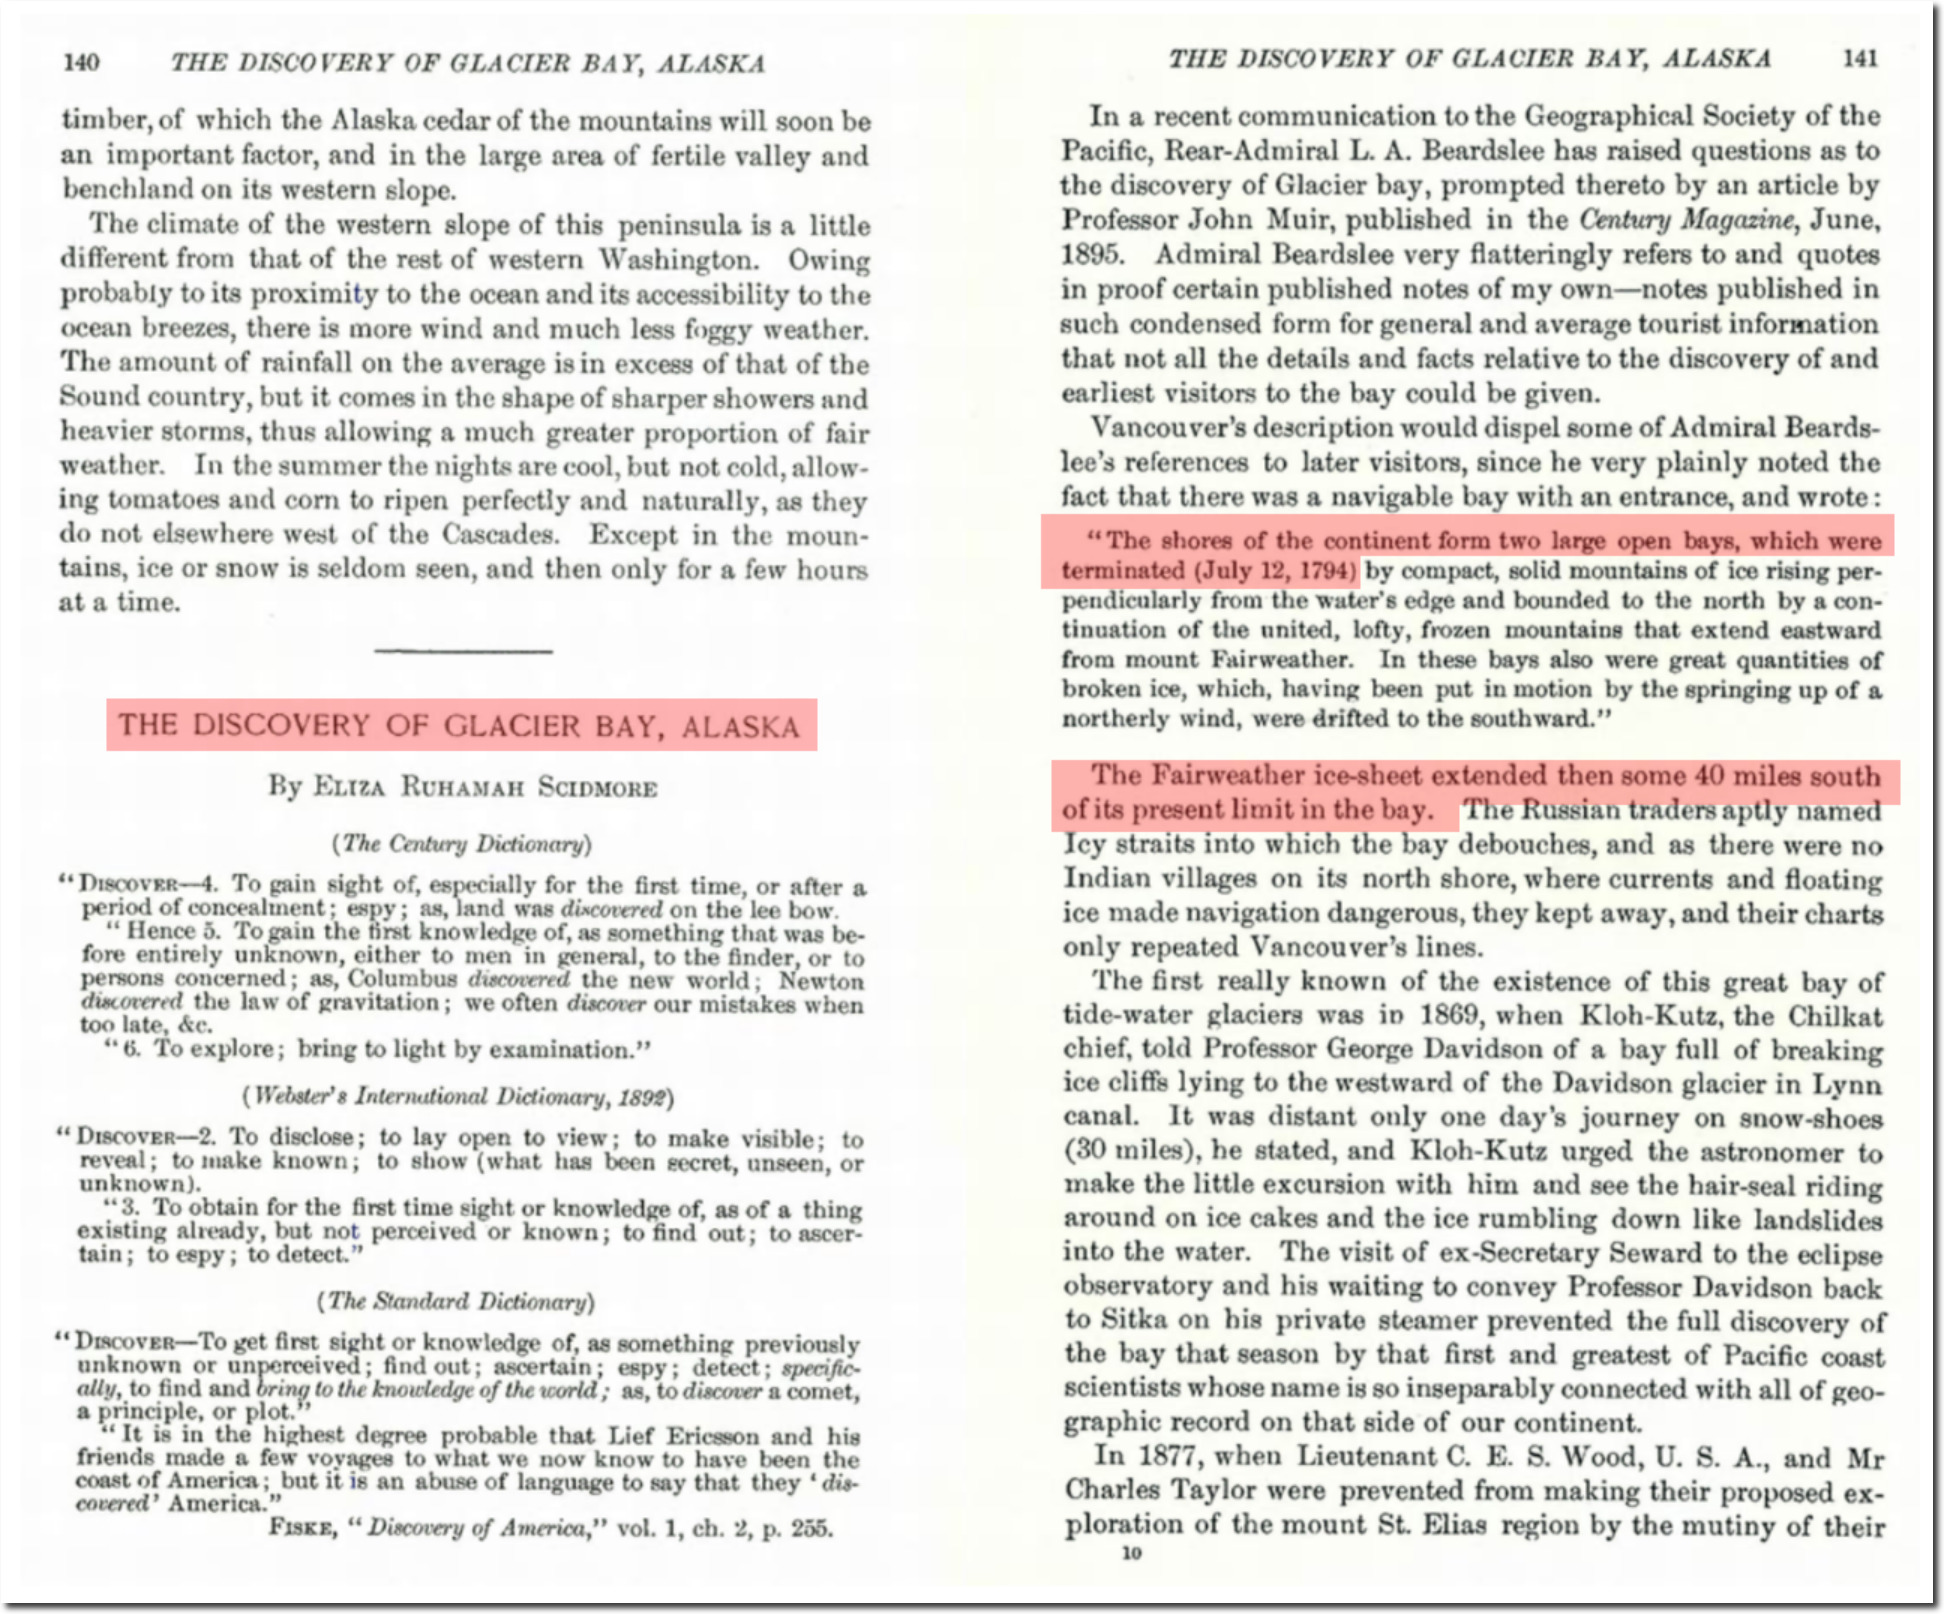
The National Geographic Archive | April 1896 | page 1

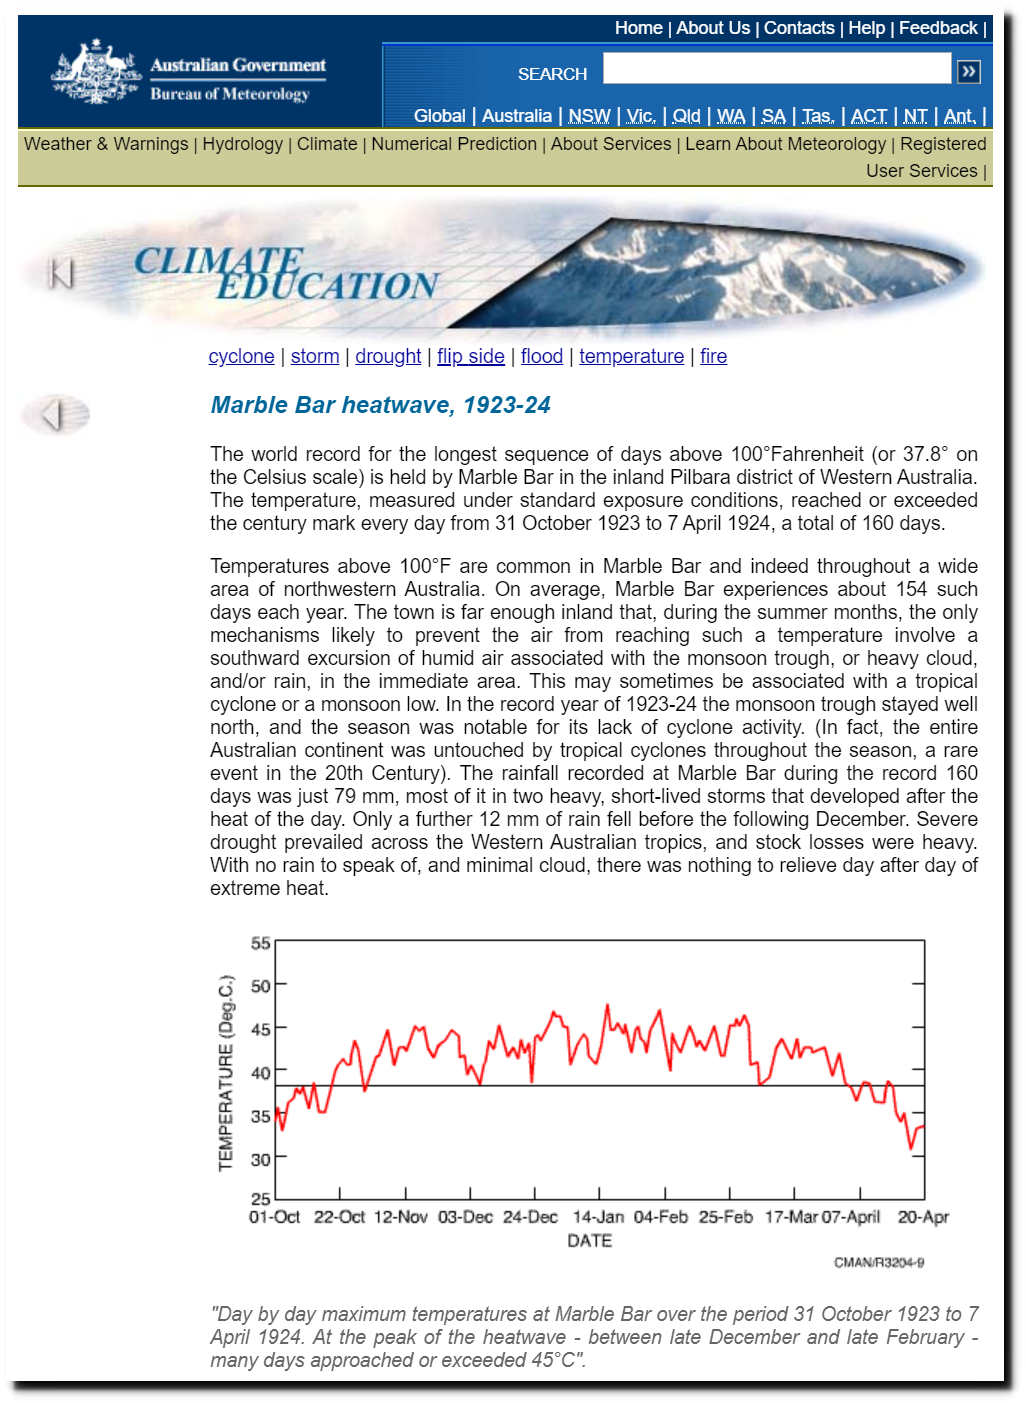
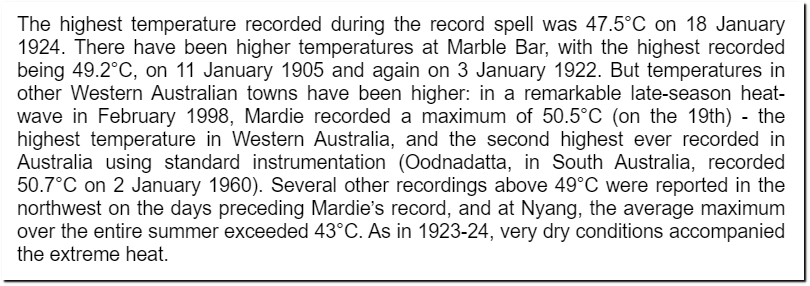
The Bureau of Meteorology used to have this web page describing the world’s record heatwave in 1923, and 50C temperatures in 1960 and 1998.

30 Mar 2009 – BOM – Australian Climate Extremes – Trove

They have since hidden this page.

Bureau of Meteorology – The page you requested was not found on this server

BOM’s excuse for hiding huge temperature anomalies before 1910, is that they claim the thermometers back then read about one degree too high.

This entry was posted in Uncategorized. Bookmark the permalink.

20 Responses to BOM Hiding The Heat In Australia

  1. Robert B says:

    The BOM did a report on those Mildura temperatures. Sorry but I don’t have a link handy. The first thing they do was assume that the second day of 124F was an error because nobody would have gone into work on a Sunday to see what was recorded.

    They then used a station 350 km away to correct it down 7 F, ignoring those towns much closer. Deniliquin is also much further from the arid regions of central Australia.

    • My father was a postmaster and proprietor of a newsagency, petrol bowser and general store. He used to record temperatures and rainfall and then report them dutifully every day to the Postmaster General’s Department. We lived at the back of the post office and general store. We worked 7 days a week despite the oppressive temperatures of the day. My dad was a stoic and dedicated man who viewed the discharge of his duties as being a matter of honour as a man. How times have changed with these soft, effeminate office dwellers judging people by their own lax standards!

      • Mark Amey says:

        Yes, those who were responsible for recording weather data took great pride in that responsibility, whether post master, farmer, or whomever. Often the hand written records contained comments that confirmed, or denied the accuracy of the data.

        But, of course, people from simpler times couldn’t be trusted to look at a thermometer and write down a number????

  2. MrGrimnasty says:

    As I’m sure you know, Jo Nova regularly carries articles related to the scandalous goings on at BoM and the efforts of a dedicated amateur to expose their gross incompetence/dishonesty.

    Well worth a look back through the archives, quite incredible.

  3. iggie says:

    ‘BOM’s excuse for hiding huge temperature anomalies before 1910, is that they claim the thermometers back then read about one degree too high.’
    And now the new electronic thermometers with their one-second response time would read about a degree higher than the LIG thermometers used up to 1996.
    This would make them compatible with the pre-1910 data.

    BTW, the BoM have increased the average means by around 0.1C from at least 1995 to 2017 when one compares the annual climate summary data to the time series you have displayed above (all due to ACORN2).
    One example of this is 2011 which shows on the TS graph as an average mean but the 2011 Annual Summary reports that:
    ‘The Australian area-averaged mean temperature in 2011 was 0.14 °C below the 1961 to 1990 average of 21.81 °C.’
    http://www.bom.gov.au/climate/current/annual/aus/2011/
    Another way to scare us with ‘it’s worse than we thought’.

  4. Peter Carroll says:

    The BOM”s excuse for data tampering is childish in the extreme. The thermometers used would have been primarily a mercury in glass type, with some being alcohol thermometers. Both types were very accurate over the range of temperatures for which they were used.
    Mercury thermometers were the standard type used in hospitals world wide. To say that a mercury thermometer can be so inaccurate as to be ignored, makes every temperature taken in every hospital, world wide, wrong. I don’t think so Tim

  5. Winsgood says:

    Sir,

    Can you please do a post in response to the articles in the media regarding https://www.theguardian.com/world/2019/dec/10/arctic-sea-ice-cover-falls-to-alarming-low-as-temperatures-rise people are interested to see what you find on that.

    Thank you

  6. iggie says:

    Robert
    I remember the document you mention and had it bookmarked.
    You remember it correctly. Use this site to download.
    https://ams.confex.com › ams › pdfpapers

    The BoM shows a 50.7C on Jan 7, 1906 for Mildura.
    http://www.bom.gov.au/climate/averages/tables/cw_076077_All.shtml

  7. John of Cloverdale, WA, Australia says:

    Tony, I found these graphs awhile ago (on one figure-link below), Australian 27 rural vs 6 city stations, historical mean temperatures; but forgot to record the source (maybe some readers can help me). Definitely shows the UHI effect as the cities have grown.
    It would be interesting, from your records, to produce an updated version similar to the one here.
    https://i.postimg.cc/qqSjXBKQ/Aus-rural-vs-city-temperatures.png

    • Aussie says:

      This is excellent info. Thanks!

      The BOM could not lie straight in bed as we say in Australia. As noted above Joanne Nova has been posting regularly on the total incompetence at the BOM.

      See kenskingdom.wordpress.com This enthusiastic amateur has been surveying the BOM stations and so far with over 300 surveyed OVER 40% are non compliant. This is disgusting as these clowns take hundreds of millions of taxpayer dollars each year and cannot even get this right.

      Where is Sussan Ley – the hopeless and ineffective Environment Minister on this?

  8. Dion MacDonald says:

    I found the stats pages for BOM dating back past 1910, it appears they weren’t hidden after all.
    Here
    http://www.bom.gov.au/climate/data/acorn-sat/#tabs=Early-data
    and here
    http://www.bom.gov.au/climate/averages/tables/cw_066062_All.shtml

    BOMs explanation of why they commence graphs at 1910 is explained here
    http://www.bom.gov.au/climate/change/about/temp_timeseries.shtml

    And lastly the climate council explanation on why 50dgrress could become the norm is explained here
    https://www.climatecouncil.org.au/resources/australias-angriest-summer-new-report/

    • Dion MacDonald says:

      Just some more info on why BOM start from about 1910
      Henry Ambrose Hunt, the first Commonwealth Meteorologist, (from 1907 to 1931) was the son of E. J. Hunt, Marine Engineer, and was born in London in 1866 within sight of the Kennington Oval. As a boy he went to Russia with his father who had a commission from the Czar to design warship engines and was there for three years.
      Hunt made steady progress in the study of meteorology, particularly on weather affecting New South Wales. During these years, as assistant to H. C. Russell, he wrote several notable papers on aspects of the climate and weather of New South Wales; and he had been acting head of the weather service for two years, when, at the end of 1906, he was selected from applicants to take charge of the new Commonwealth Bureau of Meteorology. He commenced his new assignment on 1 January 1907, and for the whole of that year he gave his energies enthusiastically to the task of unifying the methods of obtaining observations in the various Australian States and moulding the State Offices into one Commonwealth organisation.
      Thus the Commonwealth Bureau of Meteorology commenced to function on 1 January 1908 with a Central Office in Melbourne and a Divisional Office in each of the other five States’ capital cities.
      Full article HERE
      http://www.austehc.unimelb.edu.au/fam/0096.html

      and more info Here

      http://www.eoas.info/biogs/A001615b.htm

    • iggie says:

      Dion
      Your first link re ‘early data’ graph is based on SE Aust temps only (not Aust) and are homogenised i.e. not raw data.

      Your second link is the best raw data site (along with the CDO) but many stations do not have daily temps back to 1910 so are good for monthly and yearly averages only. But at least here you will find pre-1910 daily temps which show how hot it was back then (and using a Stevenson Shield).

      Your third link is to the Timeseries graph which has been adjusted at least twice to reflect ACORN1 and ACORN2. Scroll down to see the graph showing the difference between AWAP and ACORN1.
      http://www.bom.gov.au/climate/change/acorn-sat/images/temperature-trends.png
      Now compare that to your Timeseries data. For instance, 1914 has been reduced from +0.52C to +0.12C.

      The angriest summer (2018-19) was an exceptional one but only made the top ten four times – three in Dec and one in Jan. The only three ‘official’ temps above 50C were in 1960 and 1998.
      http://www.bom.gov.au/cgi-bin/climate/extremes/daily_extremes.cgi?period=%2Fcgi-bin%2Fclimate%2Fextremes%2Fdaily_extremes.cgi&climtab=tmax_high&area=aus&year=2019&mon=1&day=11

      • Dion MacDonald says:

        Iggie,

        Yes the first link is centred on SE data and as stated on the page “ The Bureau reports temperatures back to the late 19th century for those sites with long histories and good data. This includes capital cities such as Melbourne, Sydney, Adelaide and Hobart.”
        Suffice to say this information and explanation is not hidden as now both you and I have seen it. However it is incomplete and a explanation is given as to why. A point not noted in Tony’s blog. Not sure why.
        In reference to the third link and the adjustments, 1914 is indeed significant but overall the two graphs are very similar. Quite clearly you concur that the information is there for all to see so BOM aren’t really hiding anything. Great detective work that BOM aren’t hiding anything.
        The “Angriest Summer” report is not properly referenced by Tony in his opening remarks when he states “Experts predict 50C temperatures in Australia, due to increased levels of CO2 in the atmosphere.”. It doesn’t suggest 50+ never occurred or that in the past it was not hot.
        What I find odd is that this article by Tony is about BOM hiding information when what we discover is
        1. BOM didn’t really come into existence until 1907 when the Act was introduced and Henry took charge
        2. Henry was previously hands on with NSW data collection so this could be a reason why pre 1907 SE data is only represented by BOM (I can only assume this is the case)
        3. BOM quite clearly states its methodologies
        4. BOM quite clearly notes why information across Australia pre 1910 can’t be relied upon
        5. BOM quite clearly note why they only represent data from 1910 onwards (that’s because that when they started collecting it!)
        6. The “Angriest Summer” is based on BOM data from 1910.

        So the burning question of “Is BOM hiding the heat of Australia”? No, they aren’t. Are we likely to see an increase of 50+ days in Australia due to anthropological CO2 build up? Who knows, Tony doesn’t tackle this question in this blog.

        • iggie says:

          Dion, Thanks for your interesting info.
          I agree the BoM is not necessarily hiding data except many sites do not have the daily temps but only the monthly and yearly means even though they would have the records.
          The SS was in use at many sites before 1910 but are excluded when declaring records or heat waves. Why?
          What I found frustrating is that the BoM have adjusted all the temp records through ACORN1 and ACORN2 (original adjustments were made in the High Quality Data set prior to ACORN).
          I know the explanations given by the BoM for the adjustments but why would the BoM, for example, make changes to every daily temp for Bourke in Jan, 1939? Surely it wasn’t moved everyday.
          A few years ago the BoM matched the liquid/mercury in thermometer with the new ethermometers but apparently has ‘lost’ the data.

          BTW, the difference between the old Glaisher box and the SS was around 0.2C.
          A few years ago the BoM matched the liquid/mercury in thermometer with the new ethermometers but apparently has ‘lost’ the data.

  9. Thank you Tony for an excellent presentation. I loved it! Fascinating in the extreme.

  10. Thaipixie says:

    25,000 parasites gather in Spain spending taxpayers money, meanwhile…. https://www.bangkokpost.com/thailand/general/1810804/cold-claims-three-lives-in-upper-parts

Leave a Reply

Your email address will not be published. Required fields are marked *