
I have released a new version of the Unhiding The Decline climate graphing software. Download UNHIDING.zip from this link and unzip it. This will create a directory structure UNHIDING\UNHIDING\ghcnd_hcn\output
Open up a command prompt window in the UNHIDING directory which the unzip created, and enter these commands.
cd UNHIDING\ghcnd_hcn
.\ghcn.exe US.list months=05
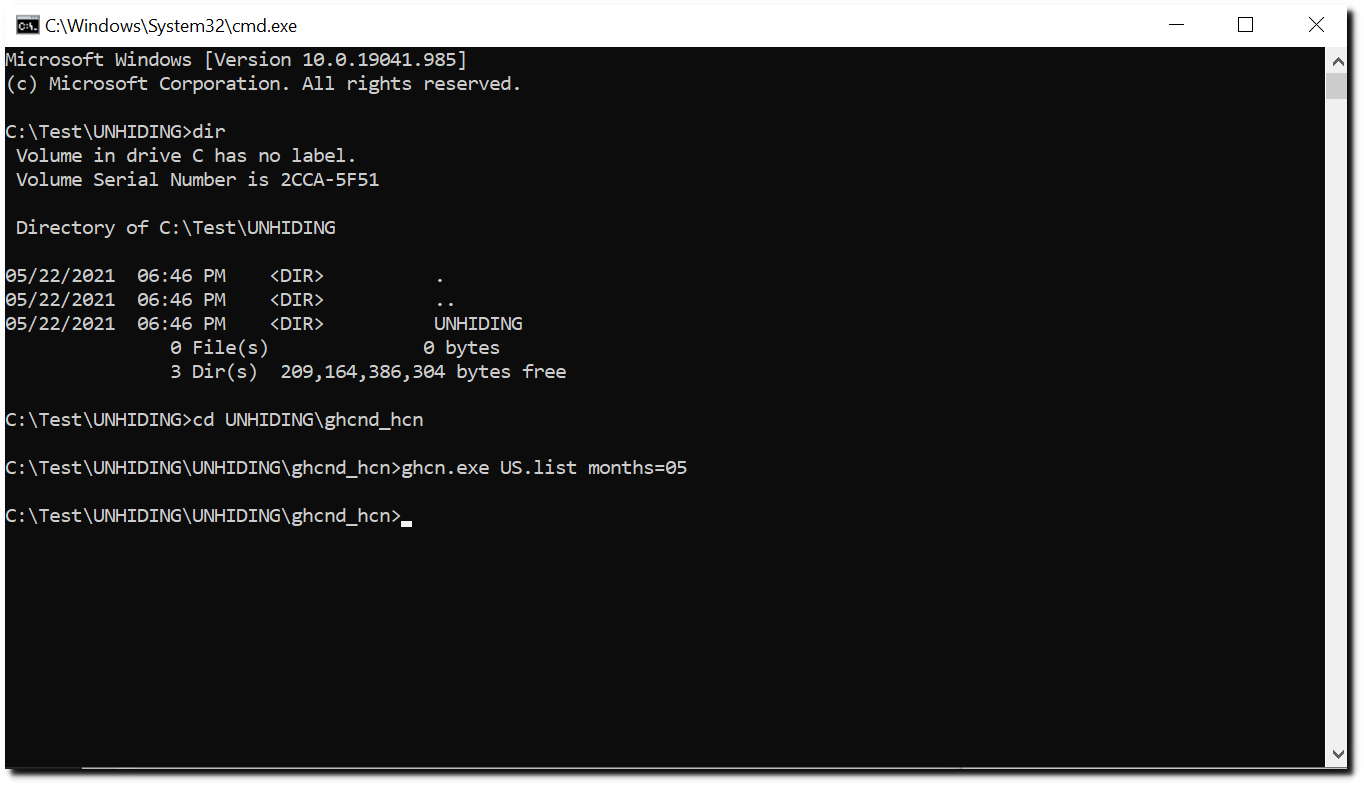
Wait a few minutes and if things are working correctly, this window will pop up.
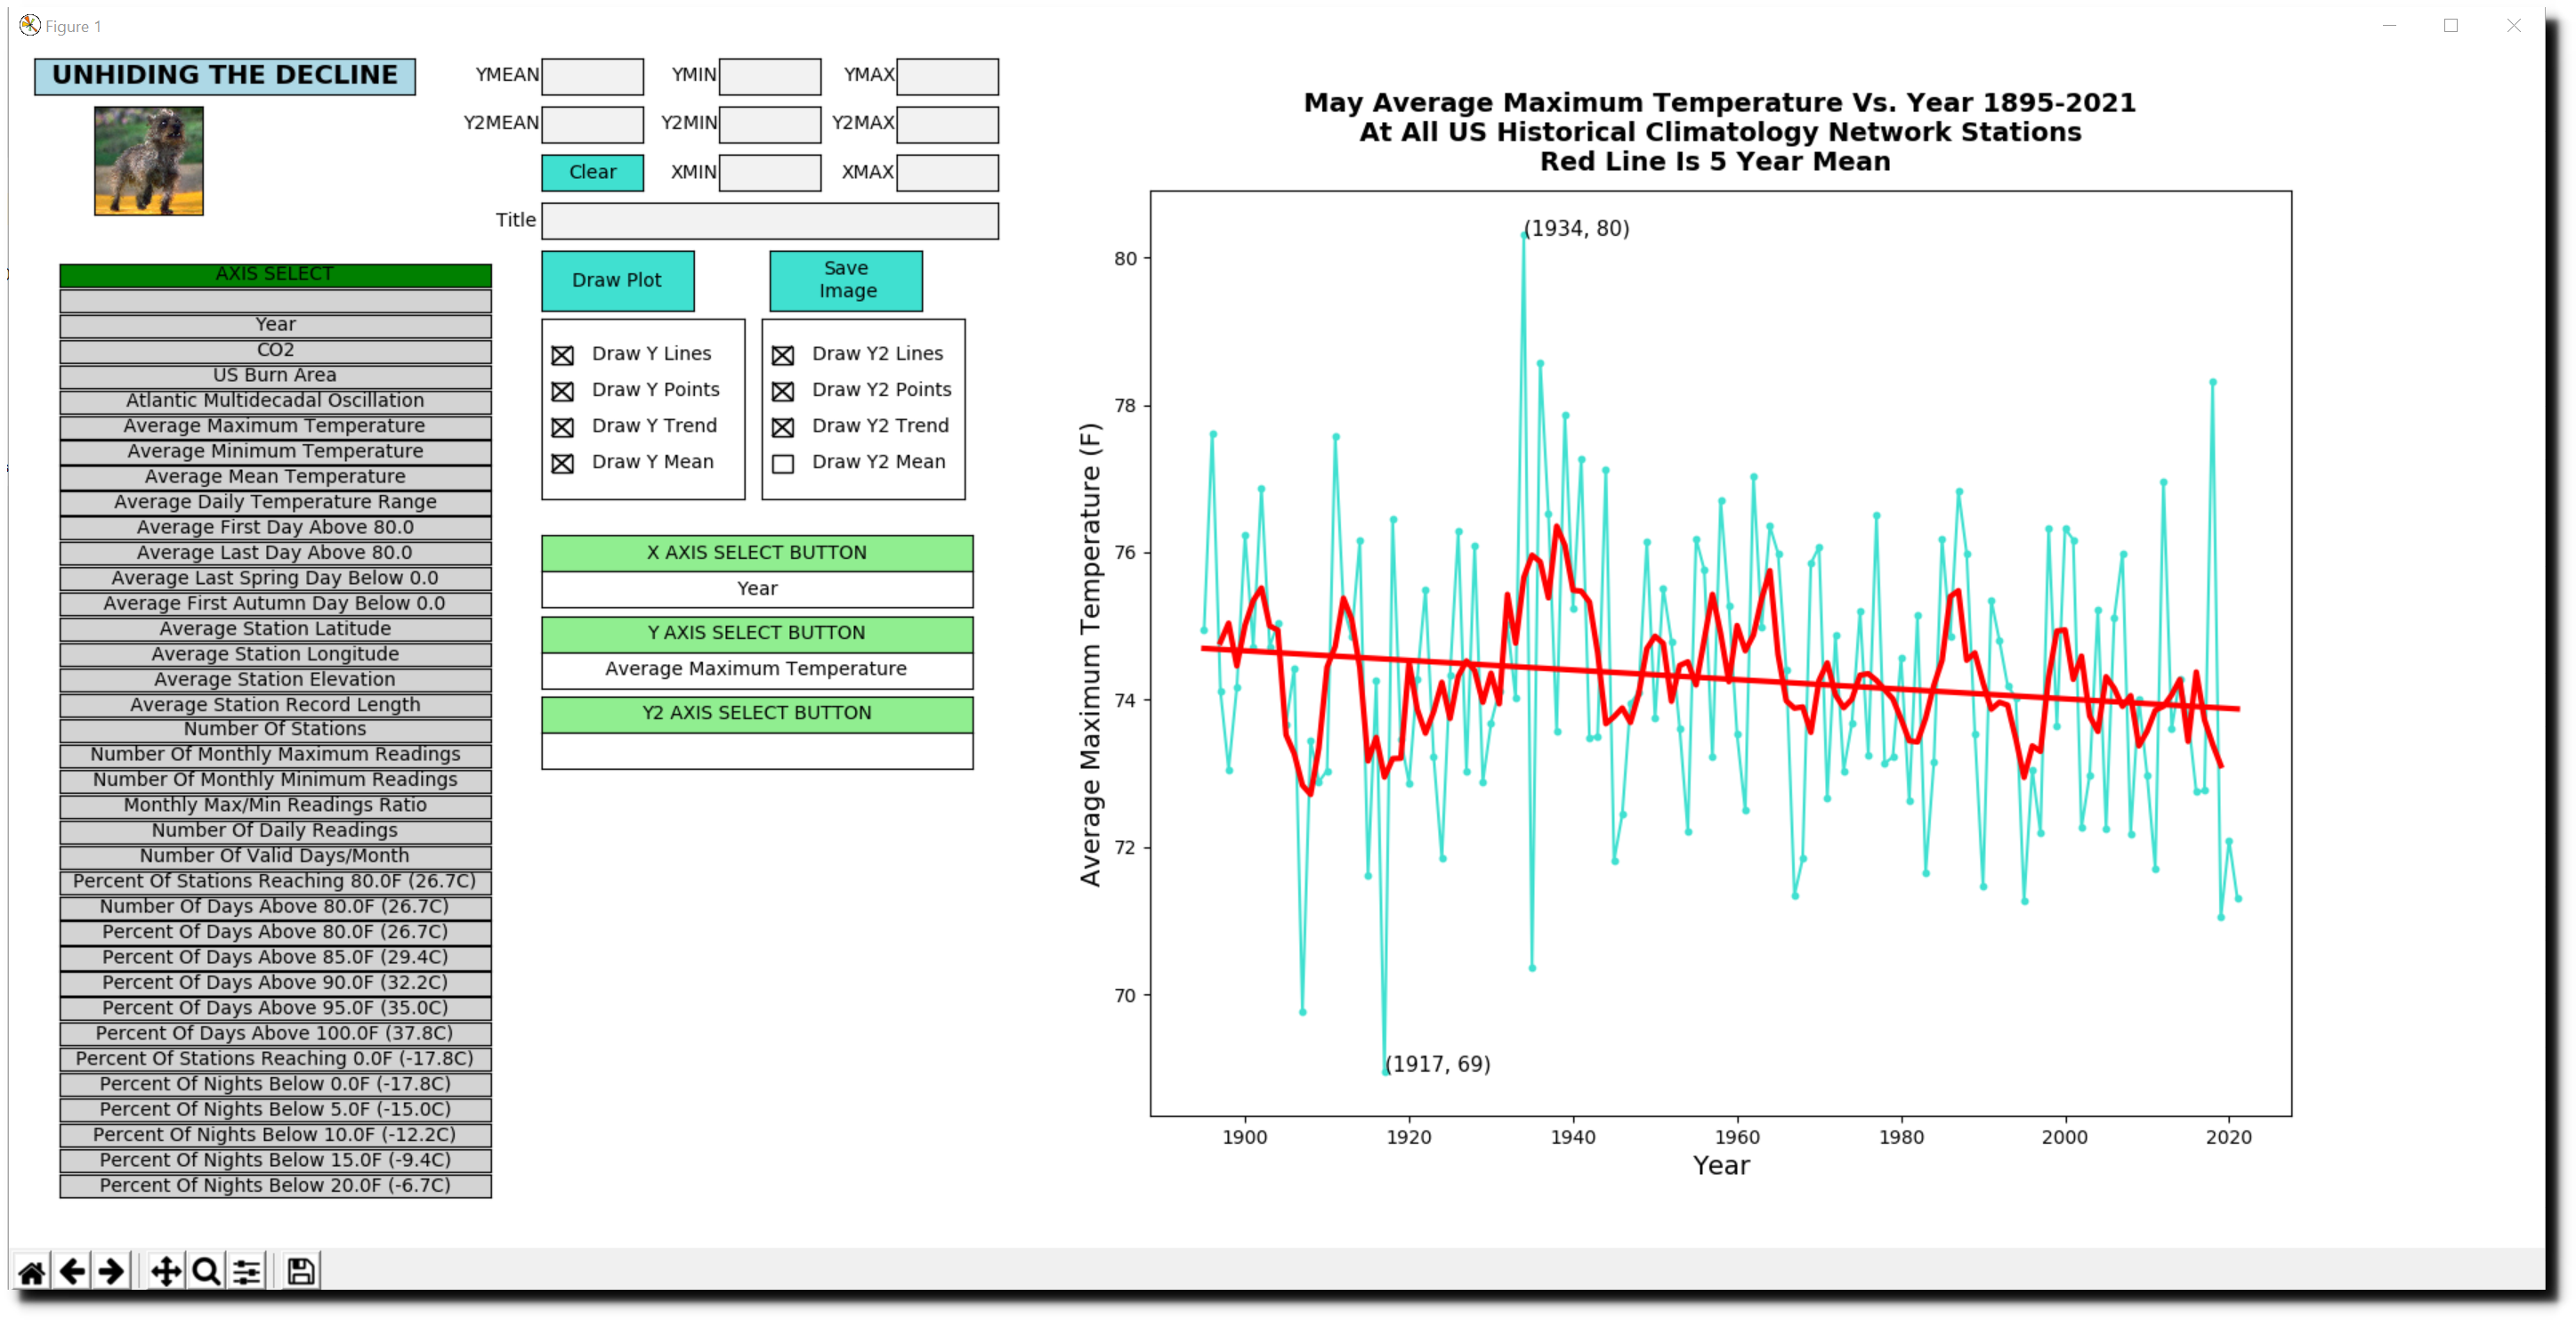
If you have used my earlier version, you will notice that the UI has changed. You can now plot two different graphs, Y and Y2. The graph below plots US Burn Area on Y, and atmospheric CO2 on Y2.

To create the graph above :
- Click on the Y AXIS SELECT button
- Click on US Burn Area in the grey box at left
- Click on the Y2 AXIS Select Button
- Click on CO2 in the grey box at left
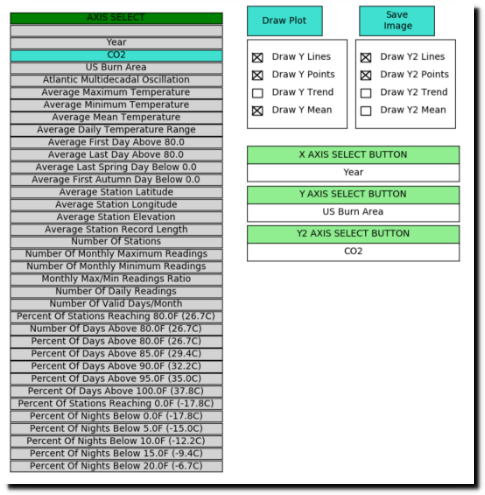
Enter a start year of 1926, and end year of 2020 as shown below.
Set the checkboxes as shown below.
Press the Draw Plot button – that will create the graph.
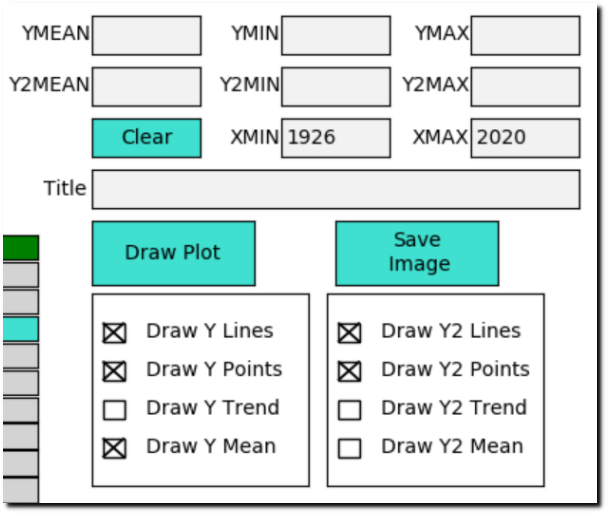
To save an image of the graph, press the Save Image button. That will save the graph image as a .png file in the UNHIDING\ghcnd_hcn\output directory.
The new code can also be run by experienced Mac and Linux users as a python script.
python3 ghcn.py US.list months=05
People with UNIX like environments can update the temperature data from NOAA with these commands:
cd ..
./get
cd ghcnd_hcn
The new code has a large amount of features which I haven’t documented here. Feel free to look at the python script ghcn.py and figure them out. Everything is contained in that file.
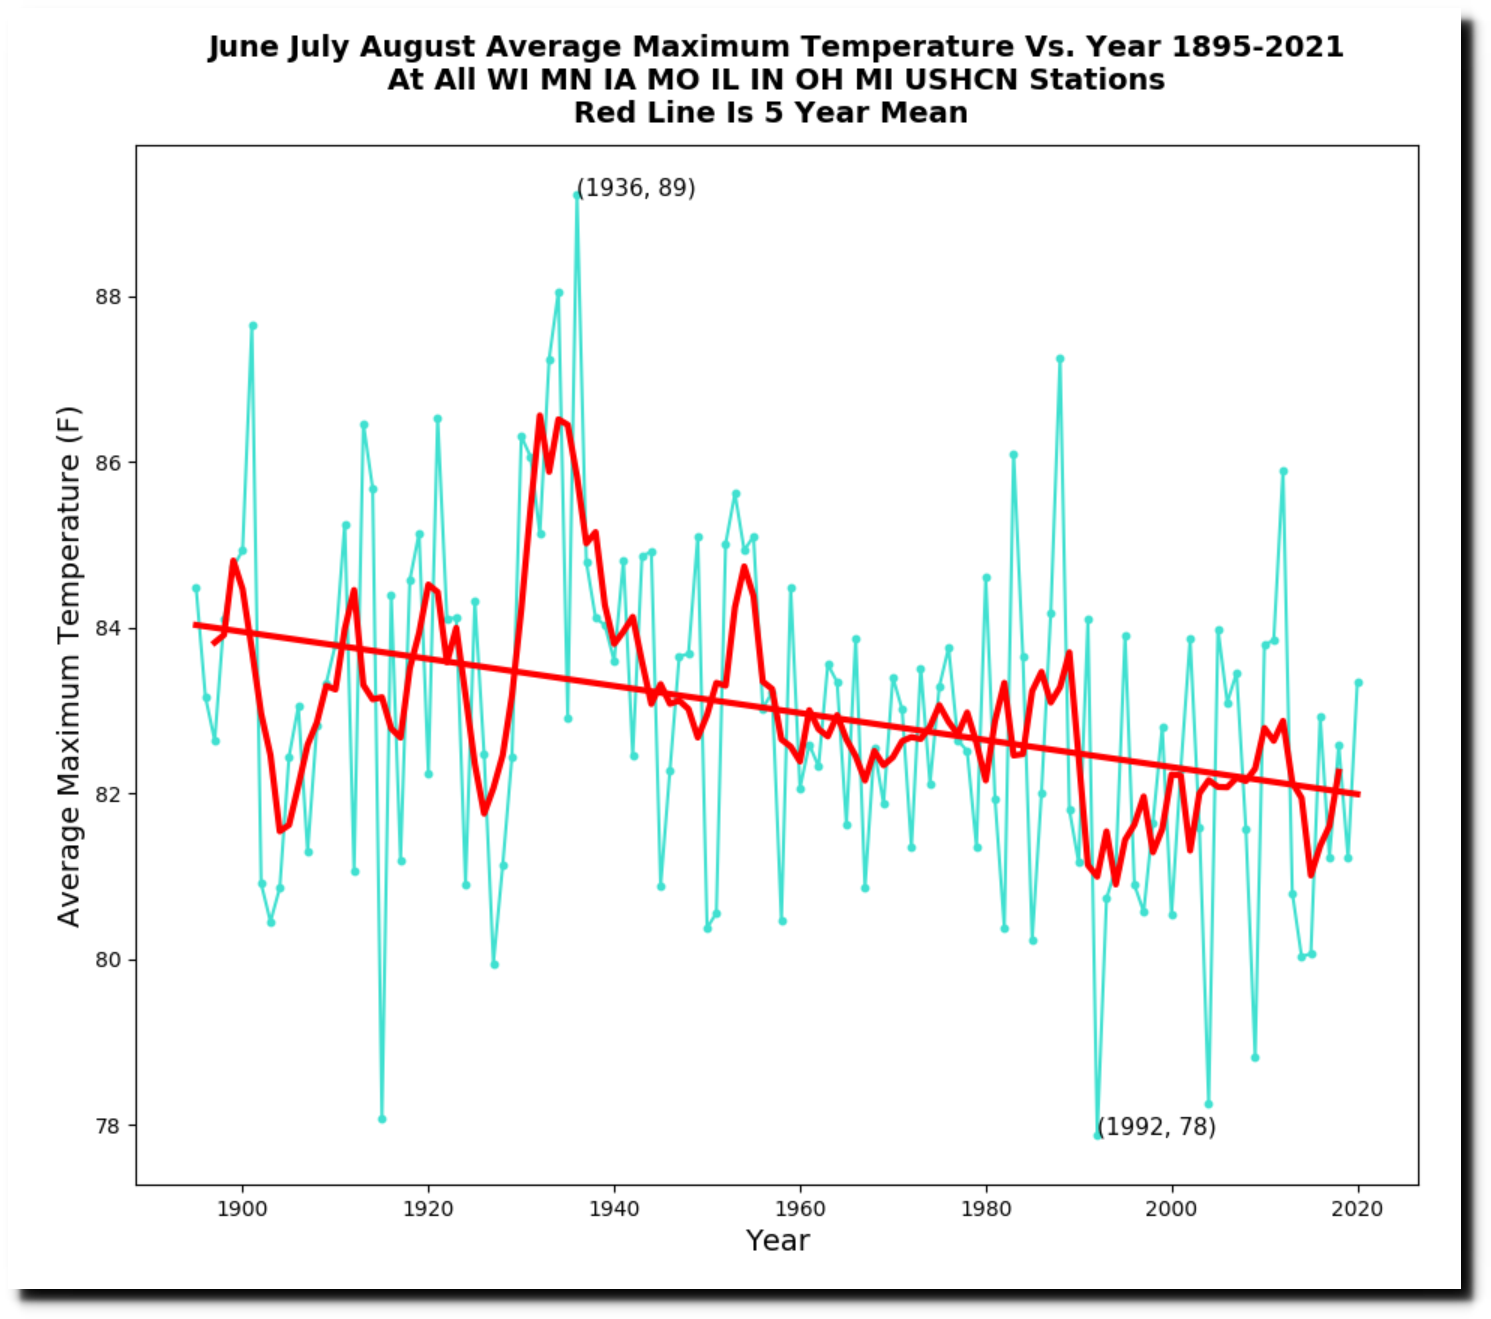
I will leave you with one more usage example for Upper Midwest summer temperatures.
.\ghcn.exe US.list months=060708 states=WIMNIAMOILINOHMI
I plan to make a video showing usage in more detail.
